| Param | Original file | Final file |
|---|---|---|
| Filename | modeM0/AS1C05_019T04_9000004388_30519cztM0_level2.evt | modeM0/AS1C05_019T04_9000004388_30519cztM0_level2_quad_clean.evt |
| Size (bytes) | 688,219,200 | 134,884,800 |
| Size | 656.3 MB | 128.6 MB |
| Events in quadrant A | 3,851,403 | 905,641 |
| Events in quadrant B | 6,906,396 | 891,761 |
| Events in quadrant C | 4,363,763 | 872,175 |
| Events in quadrant D | 5,169,404 | 848,809 |
| Mode M0 | |||
|---|---|---|---|
| Quadrant | BADHDUFLAG | Total packets | Discarded packets |
| A | 0 | 17121 | 2 |
| B | 0 | 26627 | 2 |
| C | 0 | 18467 | 2 |
| D | 0 | 20773 | 2 |
| Mode M9 | |||
|---|---|---|---|
| Quadrant | BADHDUFLAG | Total packets | Discarded packets |
| A | 0 | 4 | 0 |
| B | 0 | 4 | 0 |
| C | 0 | 4 | 0 |
| D | 0 | 4 | 0 |
| Mode SS | |||
|---|---|---|---|
| Quadrant | BADHDUFLAG | Total packets | Discarded packets |
| A | 0 | 164 | 0 |
| B | 0 | 164 | 0 |
| C | 0 | 164 | 0 |
| D | 0 | 164 | 0 |
| Quadrant | Total seconds | Saturated seconds | Saturation percentage |
|---|---|---|---|
| A | 8154 | 93 | 1.140545% |
| B | 8155 | 583 | 7.148988% |
| C | 8155 | 465 | 5.702023% |
| D | 8155 | 365 | 4.475782% |
Noise dominated data is calculated using 1-second bins in cleaned event files. If a bin has >2000 counts, and if more than 50% of those come from <1% of pixels, then it is considered to be noise-dominated and hence unusable.
| Quadrant | # 1 sec bins | Bins with >0 counts | Bins with >2000 counts | High rate bins dominated by noise | Noise dominated (total time) | Noise dominated (detector-on time) | Marked lightcurve |
|---|---|---|---|---|---|---|---|
| A | 8489 | 8156 | 1 | 1 | 0.01% | 0.01% | 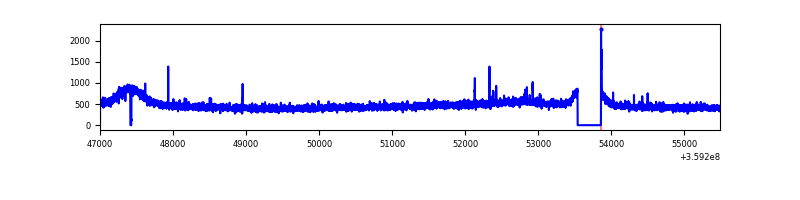 |
| B | 8490 | 8157 | 111 | 111 | 1.31% | 1.36% | 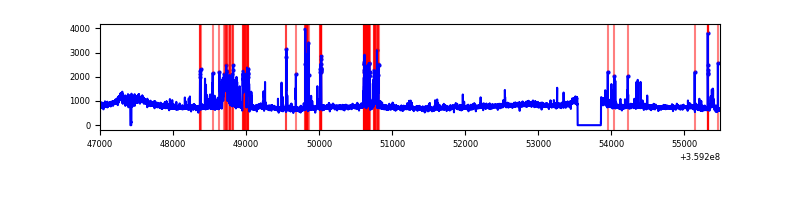 |
| C | 8490 | 8157 | 41 | 41 | 0.48% | 0.50% | 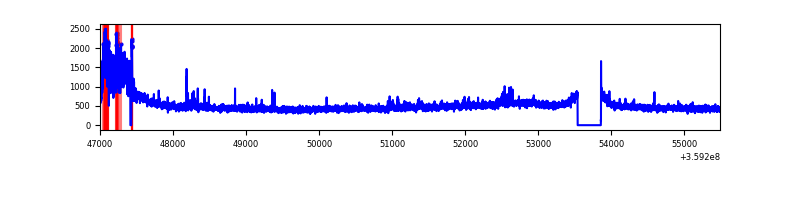 |
| D | 8490 | 8157 | 173 | 173 | 2.04% | 2.12% | 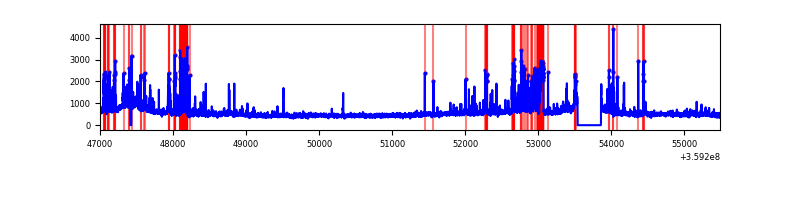 |
Top three noisy pixels from each quadrant. If the there are fewer than three noisy pixels in the level2.evt file, extra rows are filled as -1
| Pixel properties | Quadrant properties | ||||||
|---|---|---|---|---|---|---|---|
| Quadrant | DetID | PixID | Counts | Sigma | Mean | Median | Sigma |
| A | 13 | 254 | 15795 | 74.3 | 988 | 965 | 199.6 |
| A | 8 | 192 | 12861 | 59.6 | 988 | 965 | 199.6 |
| A | 12 | 96 | 12517 | 57.87 | 988 | 965 | 199.6 |
| B | 6 | 159 | 2357275 | 12693.39 | 973 | 946 | 185.6 |
| B | 0 | 229 | 612235 | 3292.97 | 973 | 946 | 185.6 |
| B | 4 | 171 | 41167 | 216.67 | 973 | 946 | 185.6 |
| C | 3 | 233 | 469834 | 2092.22 | 947 | 947 | 224.1 |
| C | 14 | 238 | 156075 | 692.2 | 947 | 947 | 224.1 |
| C | 10 | 22 | 23368 | 100.04 | 947 | 947 | 224.1 |
| D | 8 | 195 | 602124 | 2651.53 | 949 | 921 | 226.7 |
| D | 12 | 218 | 542093 | 2386.77 | 949 | 921 | 226.7 |
| D | 13 | 249 | 183534 | 805.39 | 949 | 921 | 226.7 |
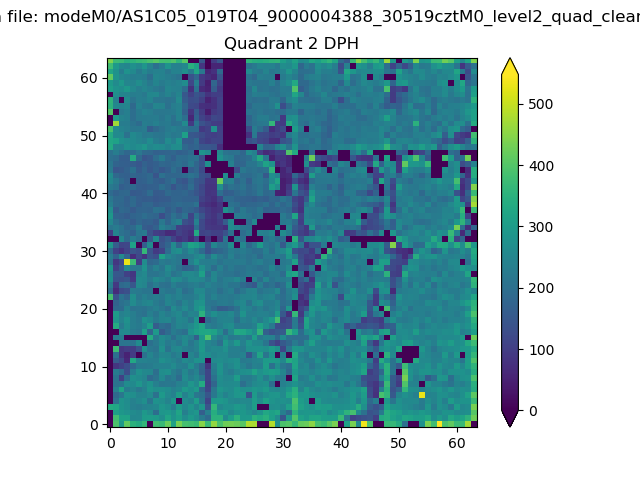
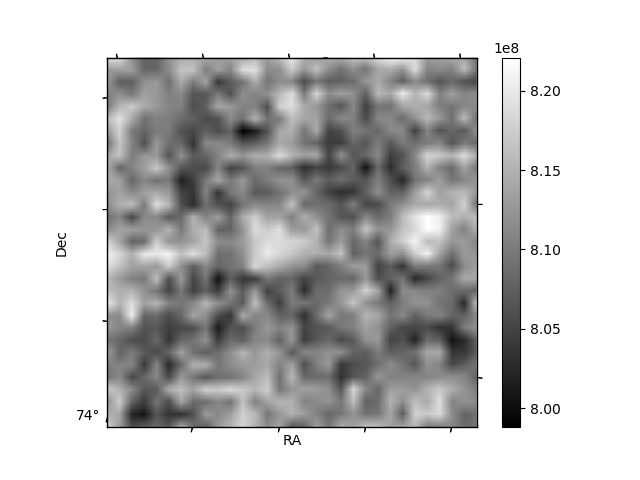
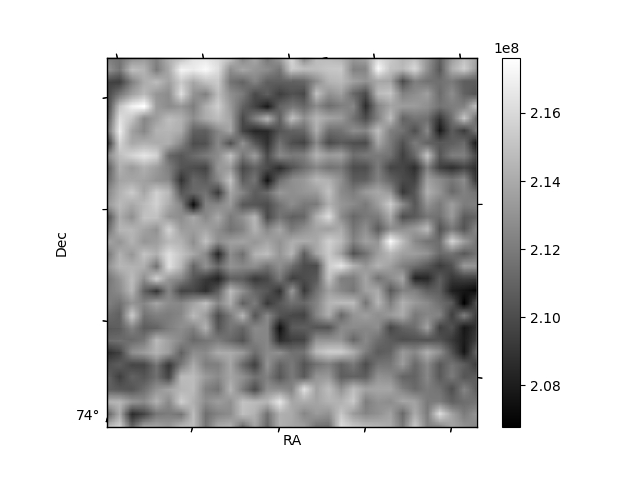
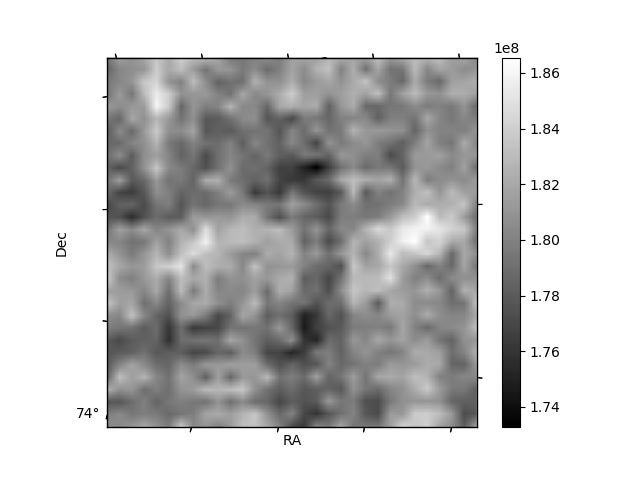
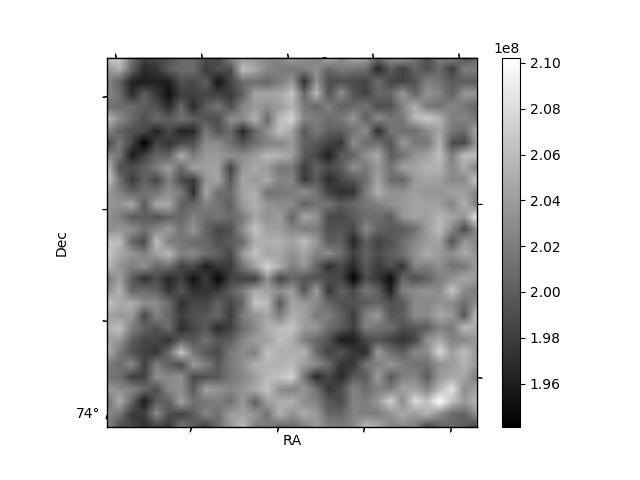
Histogram calculated using DETX and DETY for each event in the final _common_clean file
| Quadrant A | 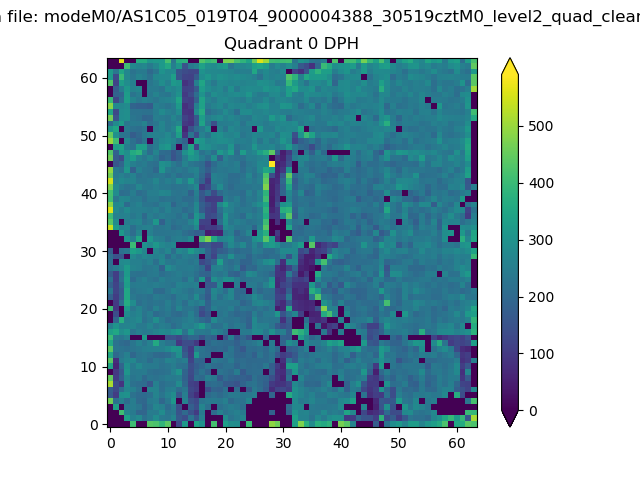 |
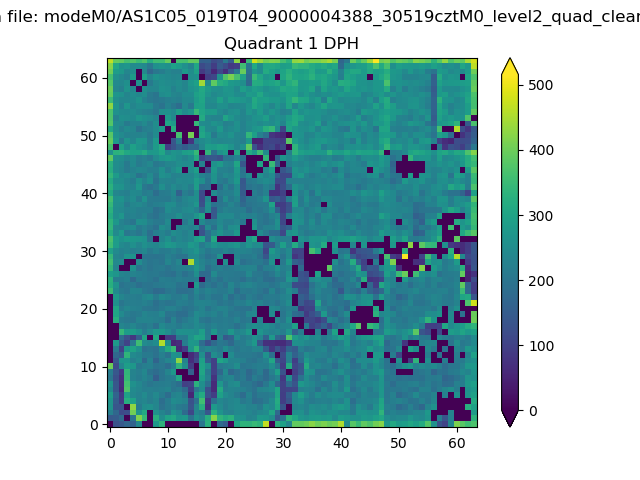 |
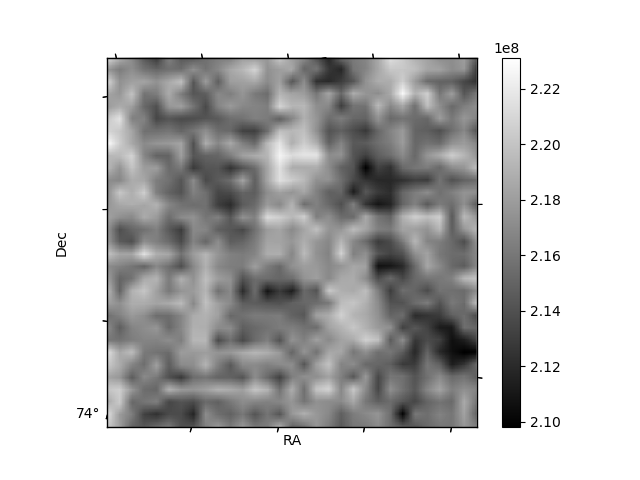
Quadrant B |
|---|---|---|---|
| Quadrant D | 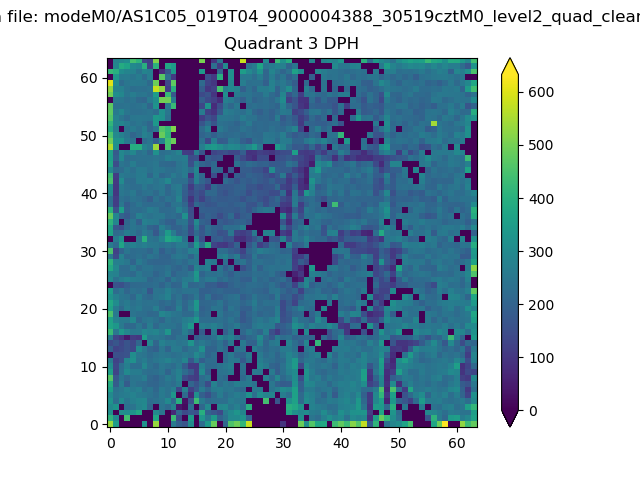 |
 |
Quadrant C |
| Plot type | Count rate plots | Images |
|---|---|---|
| Comparison with Poisson distribution Blue bars denote a histogram of data divided into 1 sec bins. Red curve is a Poisson curve with rate = median count rate of data. |
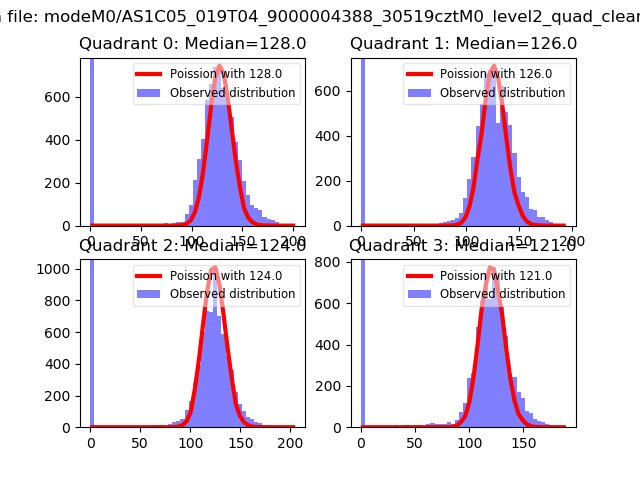 |
 |
| Quadrant-wise count rates Data is divided into 100 sec bins |
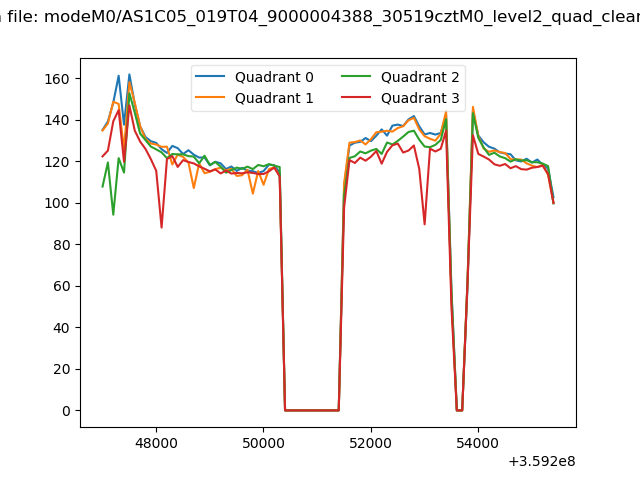 |
|
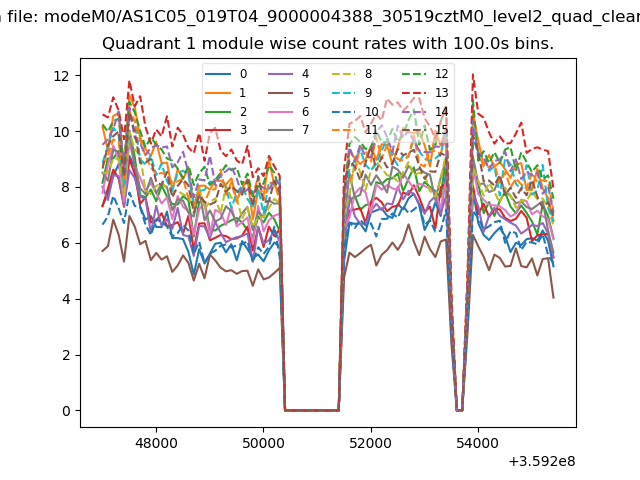
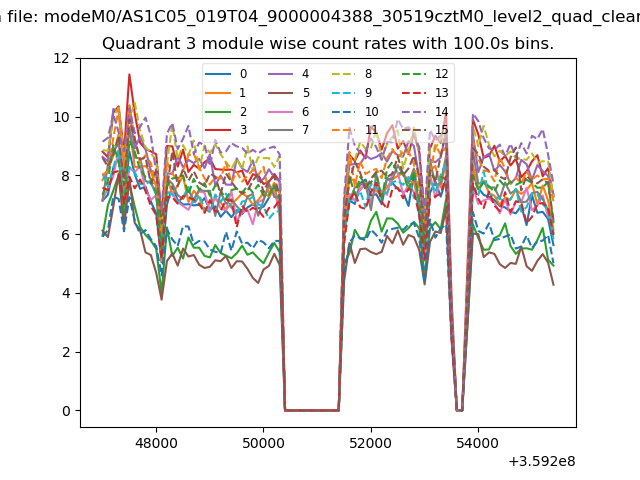
| Module-wise count rates for Quadrant A Data is divided into 100 sec bins |
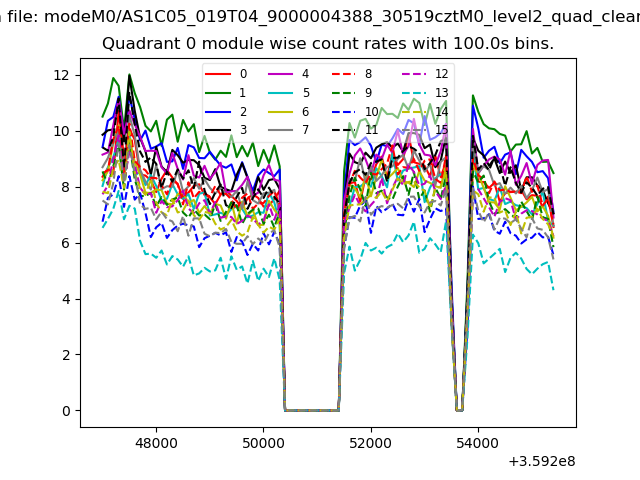 |
 |
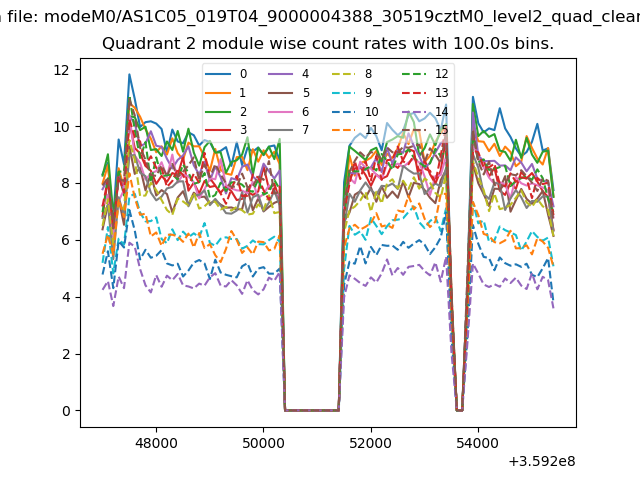
| Module-wise count rates for Quadrant B Data is divided into 100 sec bins |
 |
 |
| Module-wise count rates for Quadrant C Data is divided into 100 sec bins |
 |
 |
| Module-wise count rates for Quadrant D Data is divided into 100 sec bins |
 |
 |
| Parameter | Plot |
|---|---|
| CZT HV Monitor | 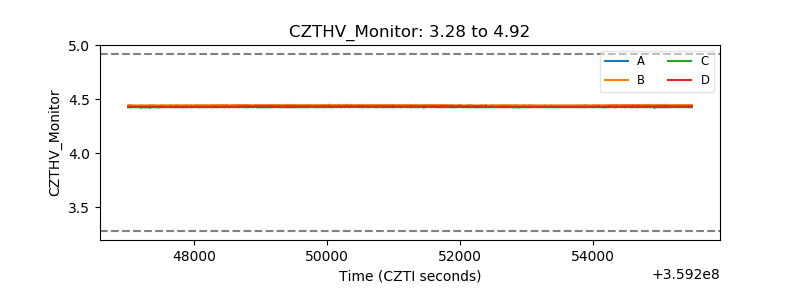 |
| D_VDD |  |
| Temperature 1 | 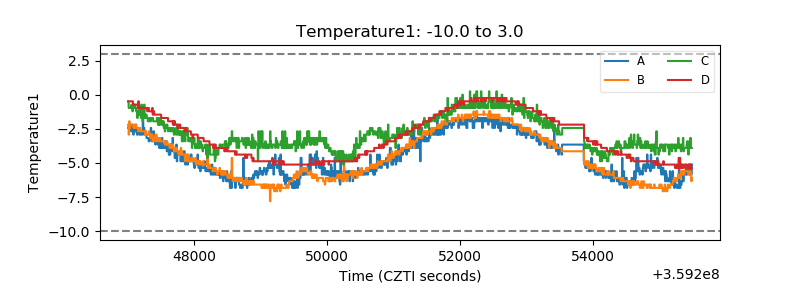 |
| Veto HV Monitor | 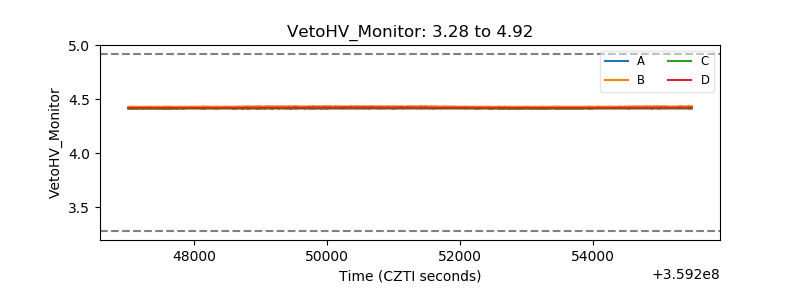 |
| Veto LLD | 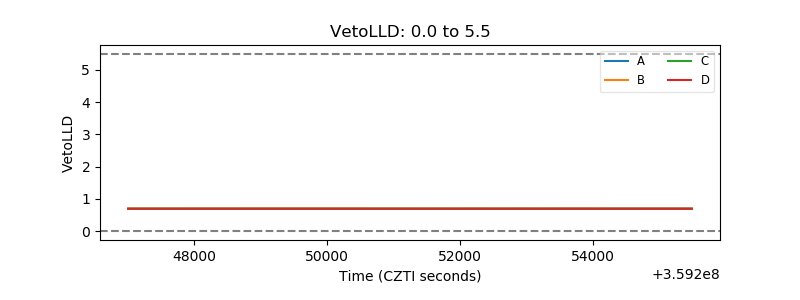 |
| Alpha Counter | 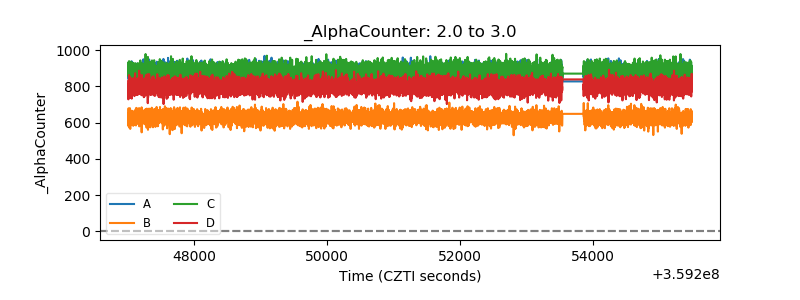 |
| _CPM_Rate | 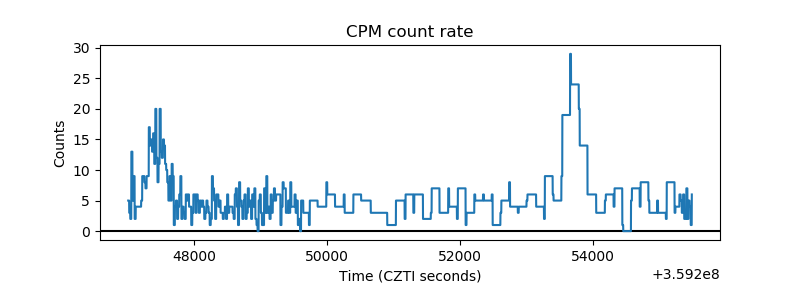 |
| CZT Counter | 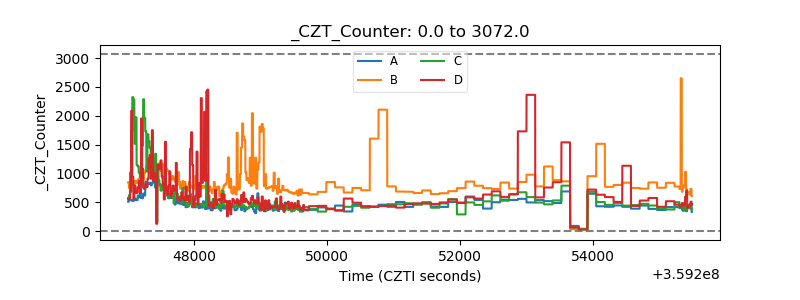 |
| +2.5 Volts monitor |  |
| +5 Volts monitor |  |
| _ROLL_ROT | 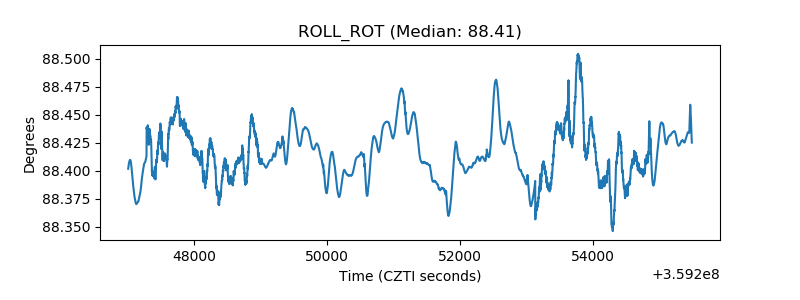 |
| _Roll_DEC | 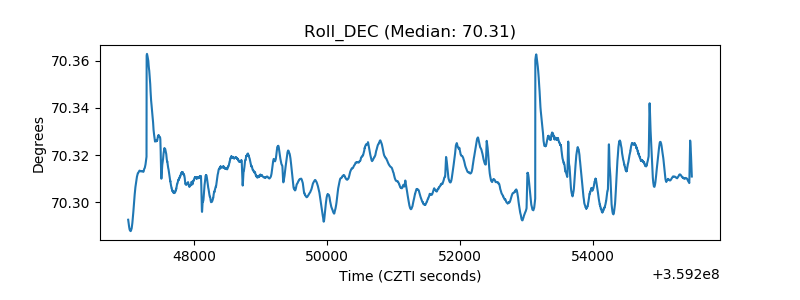 |
| _Roll_RA | 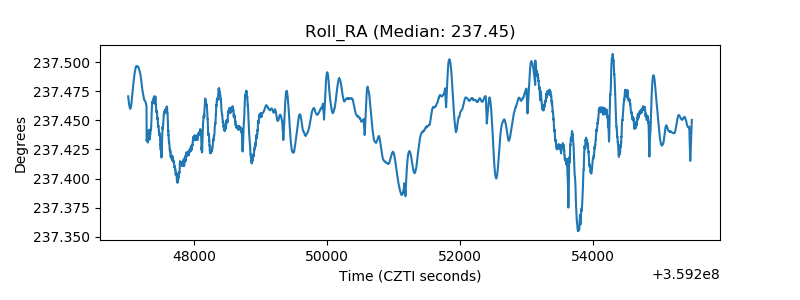 |
| Veto Counter | 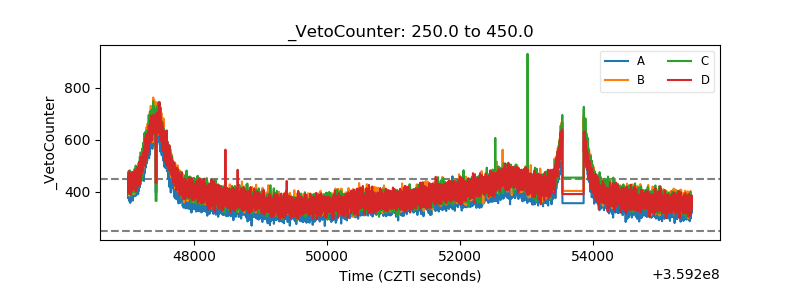 |