| Param | Original file | Final file |
|---|---|---|
| Filename | modeM0/AS1C05_019T04_9000004388_30522cztM0_level2.evt | modeM0/AS1C05_019T04_9000004388_30522cztM0_level2_quad_clean.evt |
| Size (bytes) | 925,542,720 | 178,099,200 |
| Size | 882.7 MB | 169.8 MB |
| Events in quadrant A | 5,266,523 | 1,183,770 |
| Events in quadrant B | 9,588,881 | 1,146,117 |
| Events in quadrant C | 5,568,761 | 1,149,102 |
| Events in quadrant D | 6,827,652 | 1,118,006 |
| Mode M0 | |||
|---|---|---|---|
| Quadrant | BADHDUFLAG | Total packets | Discarded packets |
| A | 0 | 23465 | 2 |
| B | 0 | 37188 | 3 |
| C | 0 | 24158 | 2 |
| D | 0 | 28079 | 2 |
| Mode M9 | |||
|---|---|---|---|
| Quadrant | BADHDUFLAG | Total packets | Discarded packets |
| A | 0 | 9 | 0 |
| B | 0 | 9 | 0 |
| C | 0 | 9 | 0 |
| D | 0 | 9 | 0 |
| Mode SS | |||
|---|---|---|---|
| Quadrant | BADHDUFLAG | Total packets | Discarded packets |
| A | 0 | 232 | 0 |
| B | 0 | 232 | 0 |
| C | 0 | 232 | 0 |
| D | 0 | 232 | 0 |
| Quadrant | Total seconds | Saturated seconds | Saturation percentage |
|---|---|---|---|
| A | 11529 | 42 | 0.364299% |
| B | 11529 | 525 | 4.553734% |
| C | 11529 | 131 | 1.136265% |
| D | 11529 | 282 | 2.446006% |
Noise dominated data is calculated using 1-second bins in cleaned event files. If a bin has >2000 counts, and if more than 50% of those come from <1% of pixels, then it is considered to be noise-dominated and hence unusable.
| Quadrant | # 1 sec bins | Bins with >0 counts | Bins with >2000 counts | High rate bins dominated by noise | Noise dominated (total time) | Noise dominated (detector-on time) | Marked lightcurve |
|---|---|---|---|---|---|---|---|
| A | 12384 | 11531 | 1 | 1 | 0.01% | 0.01% | 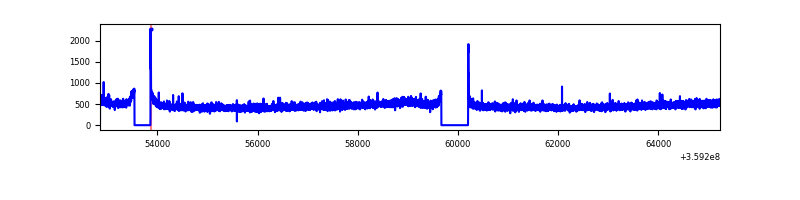 |
| B | 12384 | 11531 | 292 | 292 | 2.36% | 2.53% | 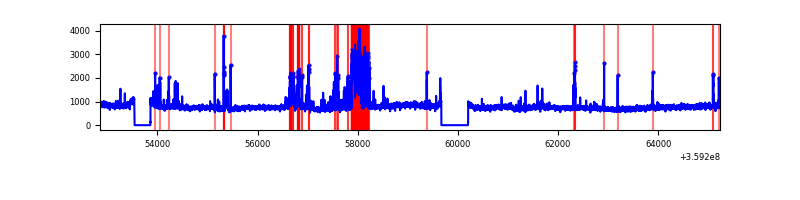 |
| C | 12384 | 11531 | 9 | 9 | 0.07% | 0.08% | 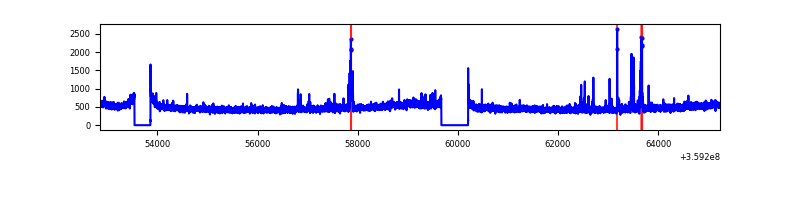 |
| D | 12384 | 11531 | 185 | 185 | 1.49% | 1.60% | 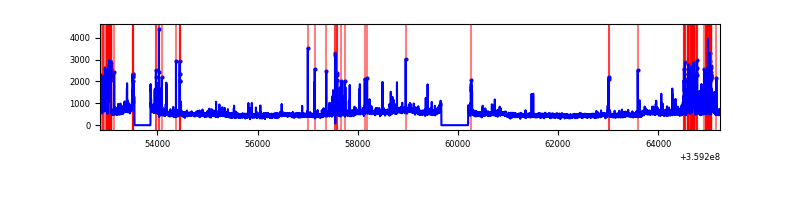 |
Top three noisy pixels from each quadrant. If the there are fewer than three noisy pixels in the level2.evt file, extra rows are filled as -1
| Pixel properties | Quadrant properties | ||||||
|---|---|---|---|---|---|---|---|
| Quadrant | DetID | PixID | Counts | Sigma | Mean | Median | Sigma |
| A | 8 | 192 | 26717 | 92.89 | 1357 | 1327 | 273.3 |
| A | 13 | 254 | 21357 | 73.28 | 1357 | 1327 | 273.3 |
| A | 3 | 137 | 13817 | 45.69 | 1357 | 1327 | 273.3 |
| B | 6 | 159 | 3270804 | 12988.21 | 1316 | 1281 | 251.7 |
| B | 6 | 36 | 975420 | 3869.78 | 1316 | 1281 | 251.7 |
| B | 0 | 229 | 51106 | 197.93 | 1316 | 1281 | 251.7 |
| C | 14 | 238 | 211237 | 685.12 | 1306 | 1315 | 306.4 |
| C | 10 | 22 | 178640 | 578.73 | 1306 | 1315 | 306.4 |
| C | 3 | 233 | 47696 | 151.37 | 1306 | 1315 | 306.4 |
| D | 8 | 195 | 825509 | 2527.4 | 1300 | 1269 | 326.1 |
| D | 13 | 249 | 424679 | 1298.32 | 1300 | 1269 | 326.1 |
| D | 12 | 218 | 259376 | 791.44 | 1300 | 1269 | 326.1 |
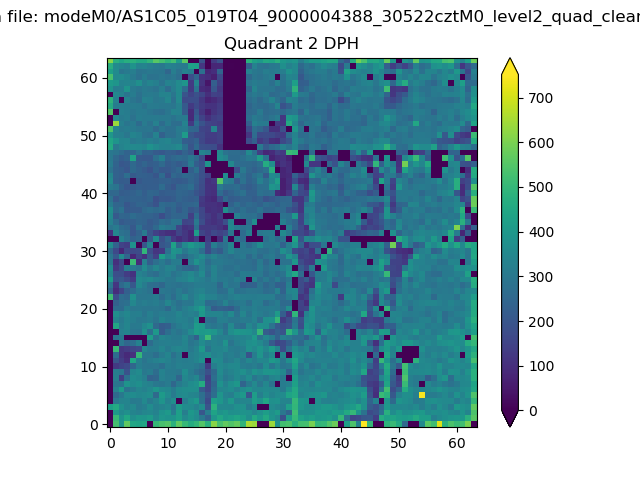
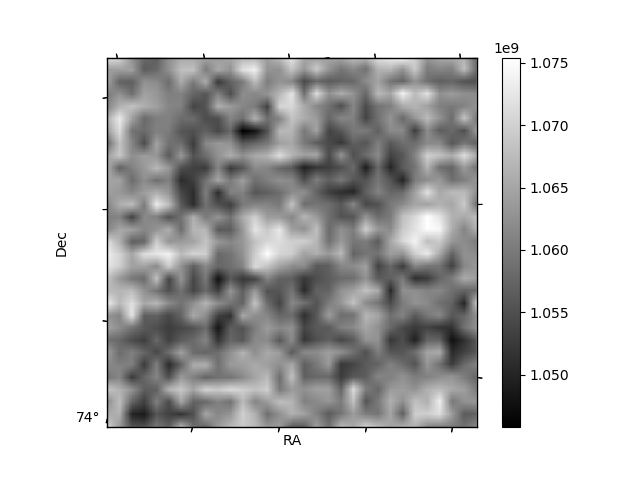
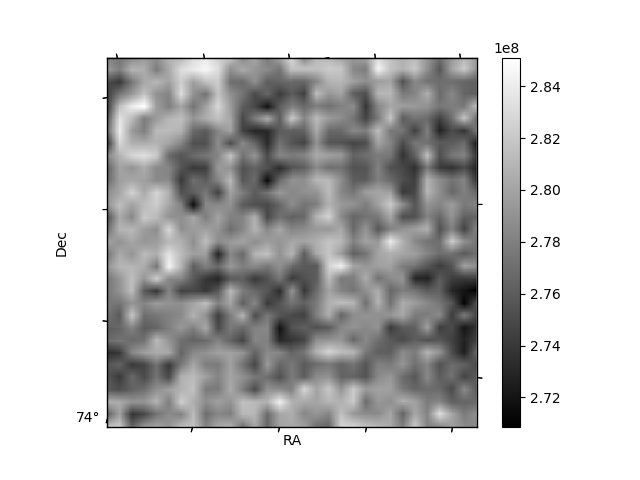
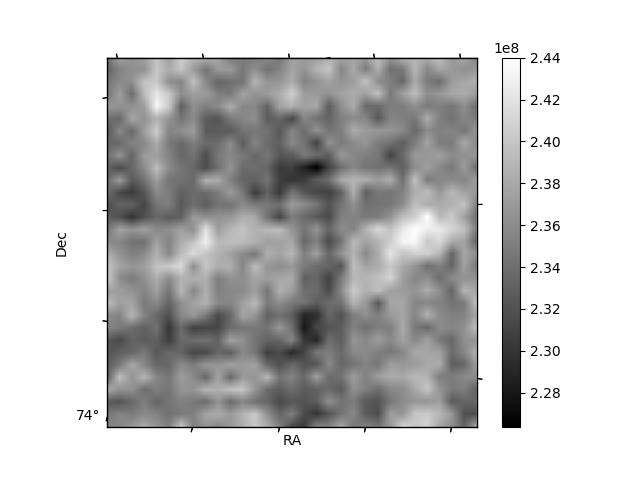
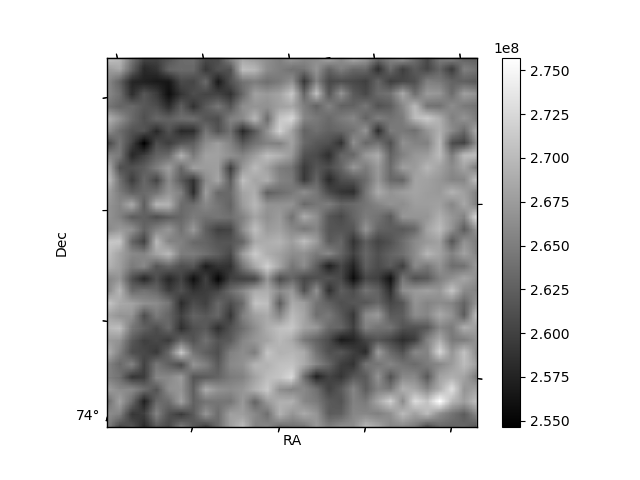
Histogram calculated using DETX and DETY for each event in the final _common_clean file
| Quadrant A | 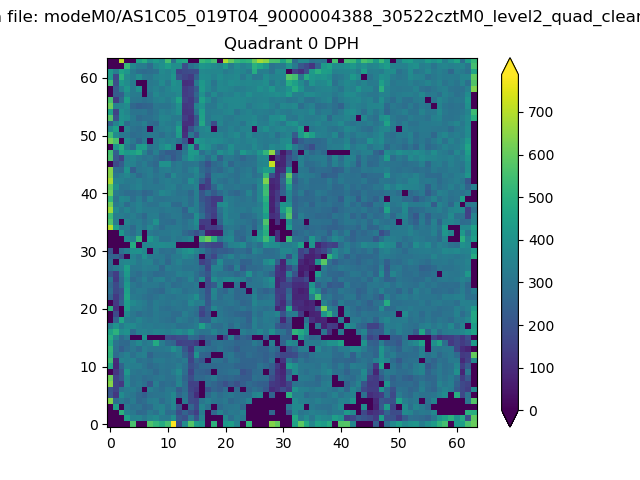 |
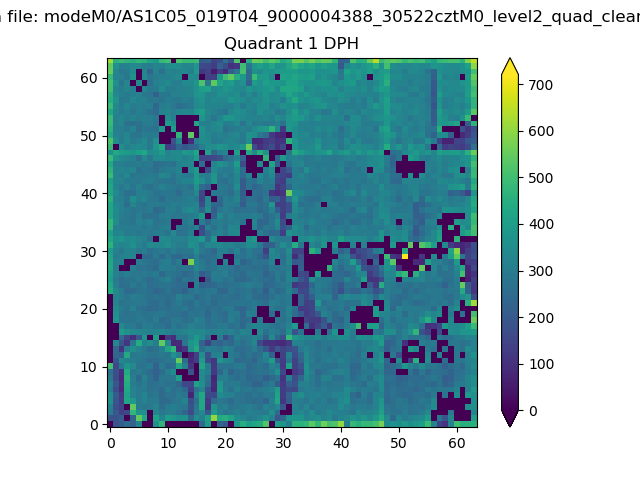 |
Quadrant B |
|---|---|---|---|
| Quadrant D | 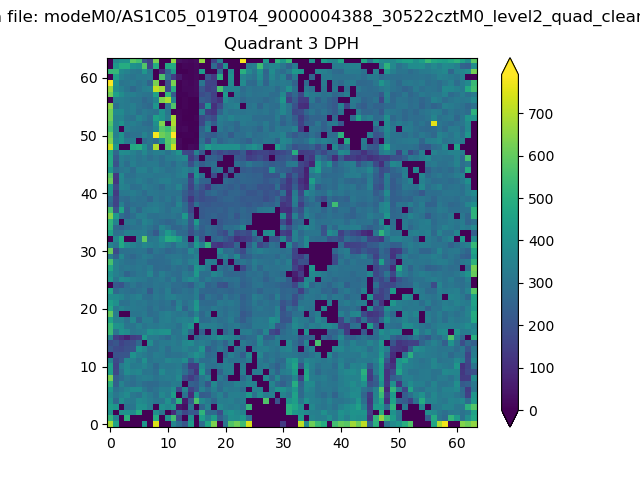 |
 |
Quadrant C |
| Plot type | Count rate plots | Images |
|---|---|---|
| Comparison with Poisson distribution Blue bars denote a histogram of data divided into 1 sec bins. Red curve is a Poisson curve with rate = median count rate of data. |
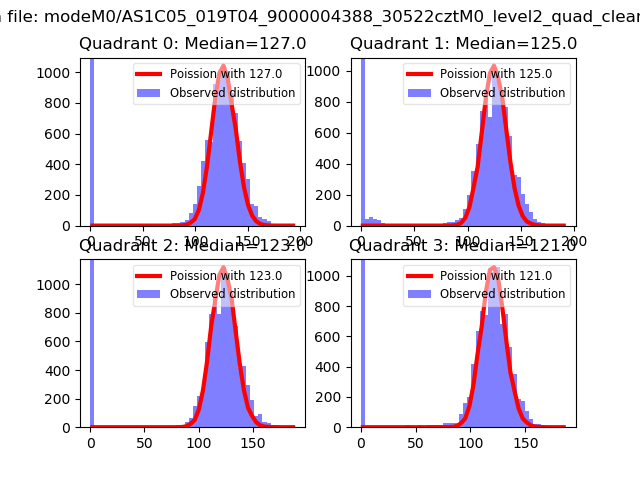 |
 |
| Quadrant-wise count rates Data is divided into 100 sec bins |
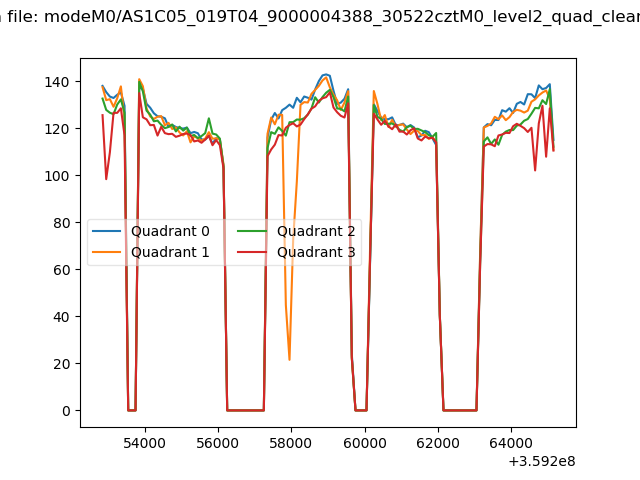 |
|
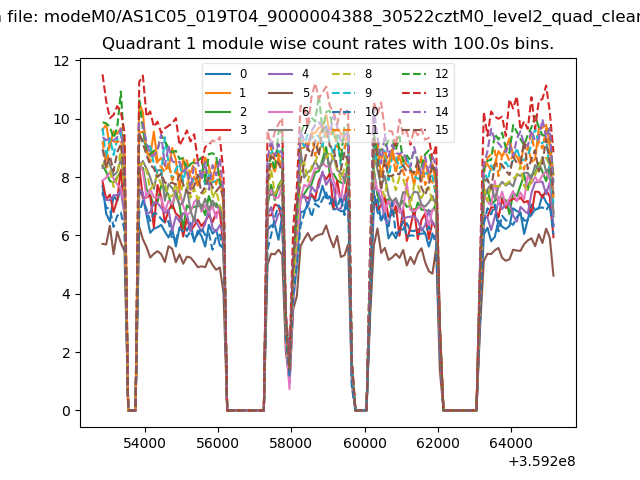
| Module-wise count rates for Quadrant A Data is divided into 100 sec bins |
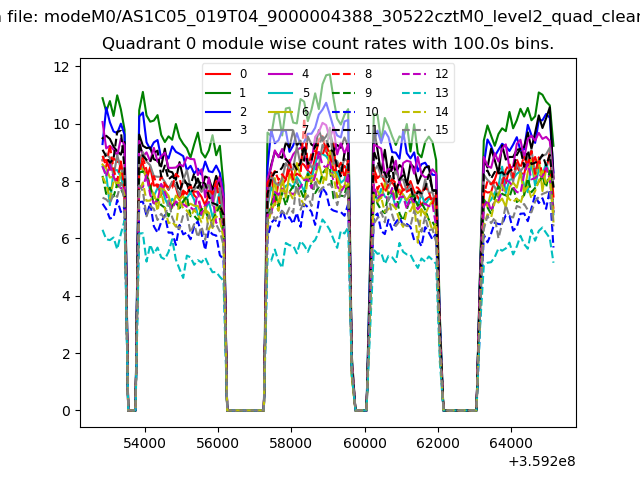 |
 |
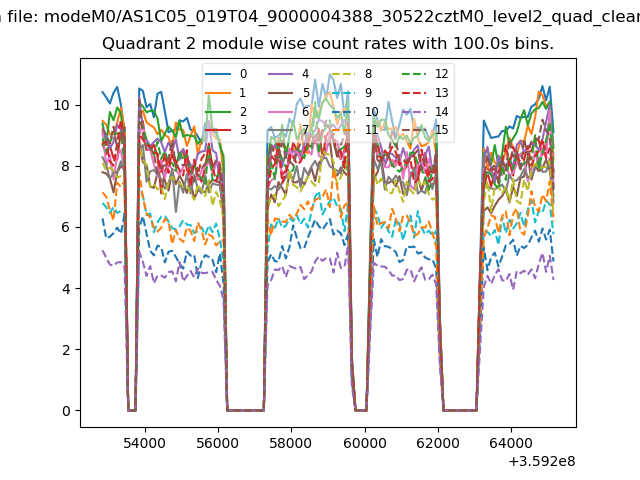
| Module-wise count rates for Quadrant B Data is divided into 100 sec bins |
 |
 |
| Module-wise count rates for Quadrant C Data is divided into 100 sec bins |
 |
 |
| Module-wise count rates for Quadrant D Data is divided into 100 sec bins |
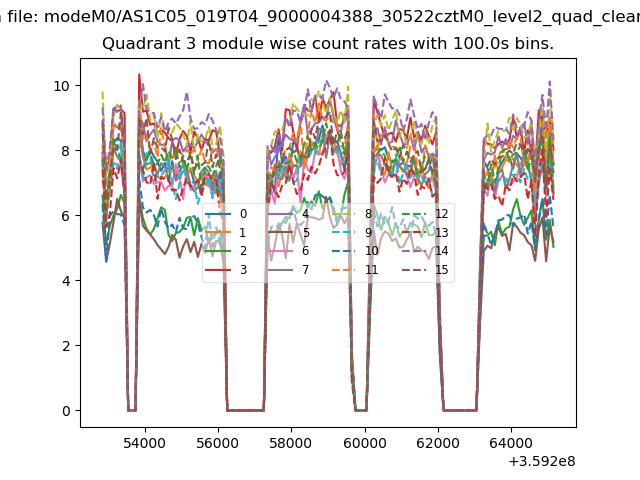 |
 |
| Parameter | Plot |
|---|---|
| CZT HV Monitor | 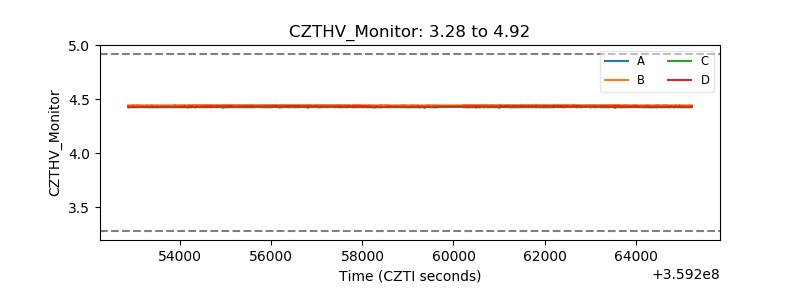 |
| D_VDD | 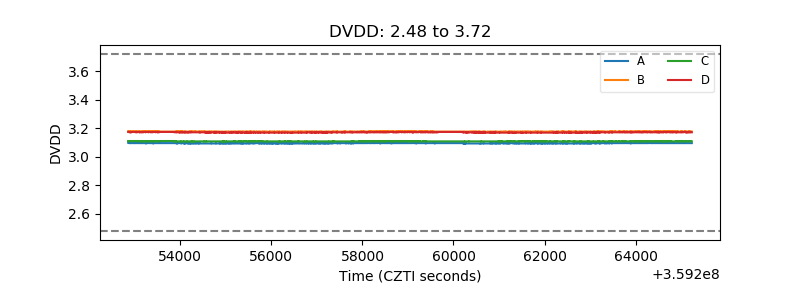 |
| Temperature 1 |  |
| Veto HV Monitor | 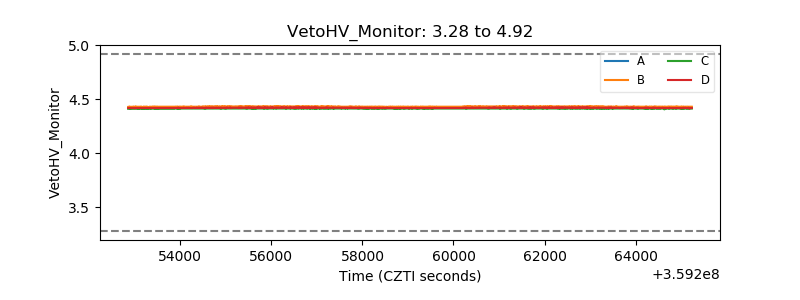 |
| Veto LLD | 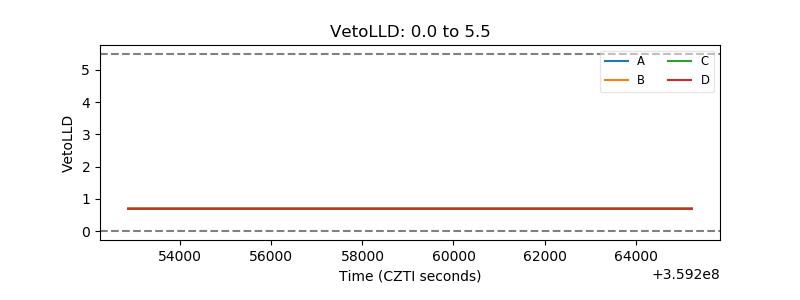 |
| Alpha Counter | 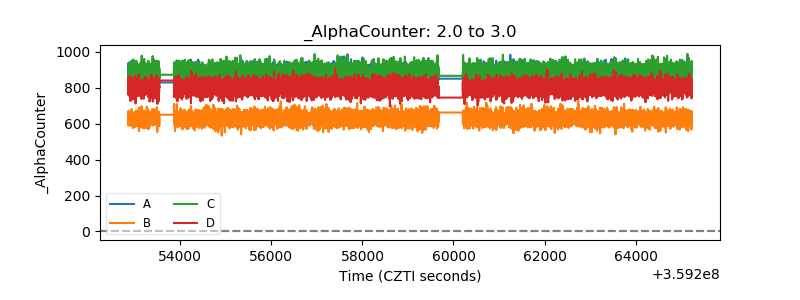 |
| _CPM_Rate | 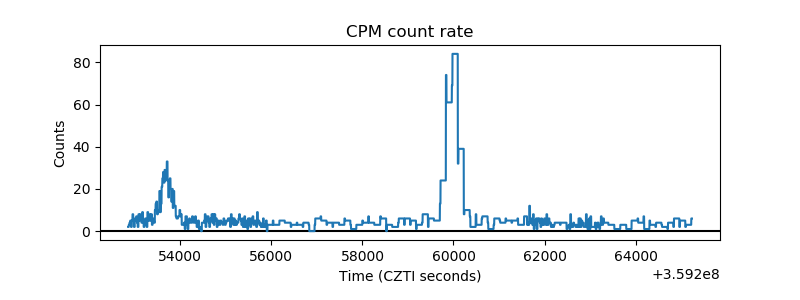 |
| CZT Counter | 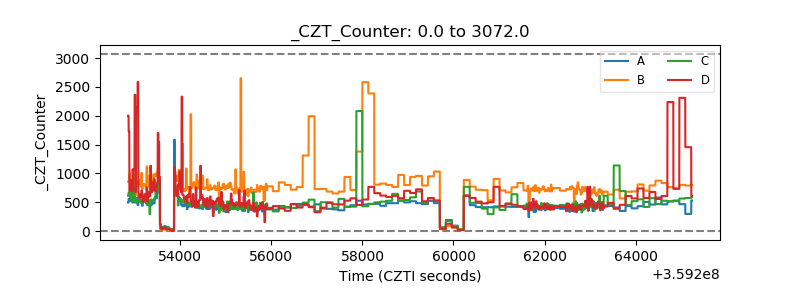 |
| +2.5 Volts monitor |  |
| +5 Volts monitor |  |
| _ROLL_ROT | 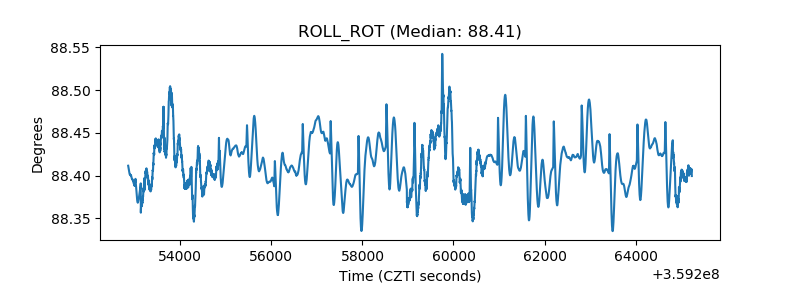 |
| _Roll_DEC | 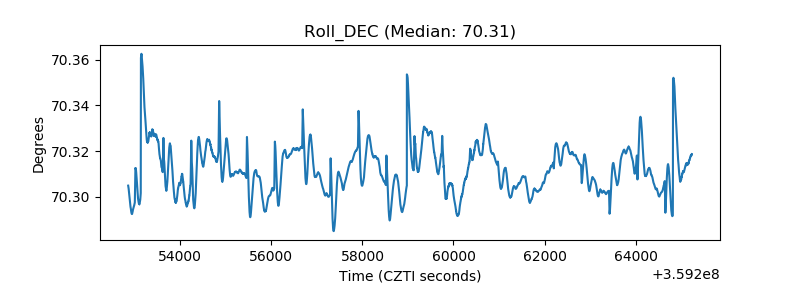 |
| _Roll_RA | 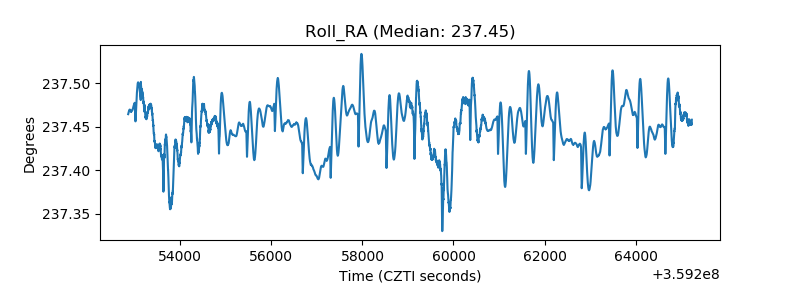 |
| Veto Counter | 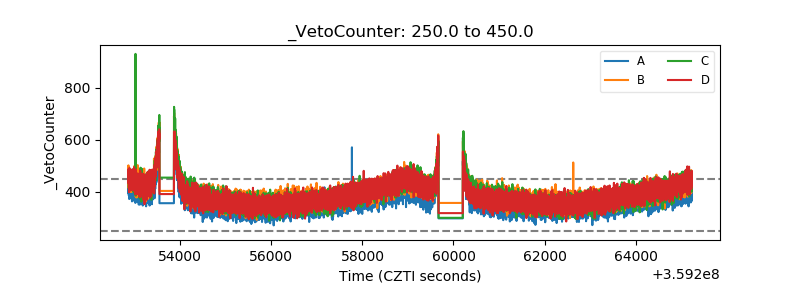 |