| Param | Original file | Final file |
|---|---|---|
| Filename | modeM0/AS1C05_019T04_9000004388_30523cztM0_level2.evt | modeM0/AS1C05_019T04_9000004388_30523cztM0_level2_quad_clean.evt |
| Size (bytes) | 588,677,760 | 122,690,880 |
| Size | 561.4 MB | 117.0 MB |
| Events in quadrant A | 3,475,170 | 820,637 |
| Events in quadrant B | 5,699,261 | 810,866 |
| Events in quadrant C | 3,645,710 | 791,677 |
| Events in quadrant D | 4,507,891 | 778,723 |
| Mode M0 | |||
|---|---|---|---|
| Quadrant | BADHDUFLAG | Total packets | Discarded packets |
| A | 0 | 15058 | 2 |
| B | 0 | 22440 | 2 |
| C | 0 | 15483 | 2 |
| D | 0 | 18575 | 2 |
| Mode M9 | |||
|---|---|---|---|
| Quadrant | BADHDUFLAG | Total packets | Discarded packets |
| A | 0 | 15 | 0 |
| B | 0 | 15 | 0 |
| C | 0 | 15 | 0 |
| D | 0 | 15 | 0 |
| Mode SS | |||
|---|---|---|---|
| Quadrant | BADHDUFLAG | Total packets | Discarded packets |
| A | 0 | 152 | 0 |
| B | 0 | 152 | 0 |
| C | 0 | 152 | 0 |
| D | 0 | 152 | 0 |
| Quadrant | Total seconds | Saturated seconds | Saturation percentage |
|---|---|---|---|
| A | 7381 | 77 | 1.043219% |
| B | 7382 | 164 | 2.221620% |
| C | 7382 | 154 | 2.086156% |
| D | 7382 | 168 | 2.275806% |
Noise dominated data is calculated using 1-second bins in cleaned event files. If a bin has >2000 counts, and if more than 50% of those come from <1% of pixels, then it is considered to be noise-dominated and hence unusable.
| Quadrant | # 1 sec bins | Bins with >0 counts | Bins with >2000 counts | High rate bins dominated by noise | Noise dominated (total time) | Noise dominated (detector-on time) | Marked lightcurve |
|---|---|---|---|---|---|---|---|
| A | 8926 | 7383 | 1 | 1 | 0.01% | 0.01% | 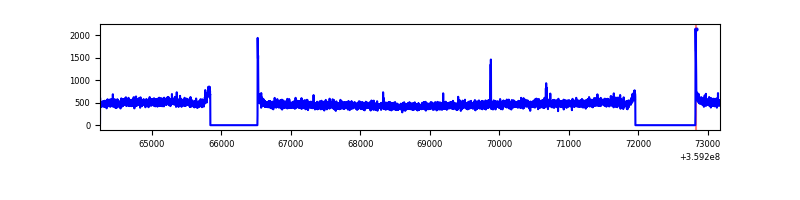 |
| B | 8927 | 7384 | 9 | 9 | 0.10% | 0.12% |  |
| C | 8927 | 7384 | 28 | 28 | 0.31% | 0.38% | 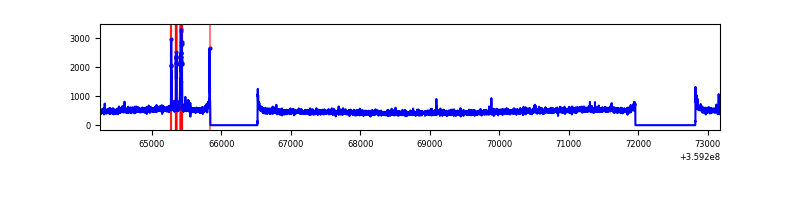 |
| D | 8927 | 7384 | 102 | 102 | 1.14% | 1.38% | 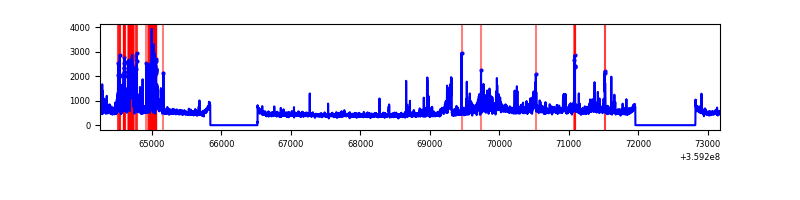 |
Top three noisy pixels from each quadrant. If the there are fewer than three noisy pixels in the level2.evt file, extra rows are filled as -1
| Pixel properties | Quadrant properties | ||||||
|---|---|---|---|---|---|---|---|
| Quadrant | DetID | PixID | Counts | Sigma | Mean | Median | Sigma |
| A | 8 | 192 | 24369 | 131.71 | 891 | 873 | 178.4 |
| A | 13 | 254 | 14547 | 76.65 | 891 | 873 | 178.4 |
| A | 3 | 137 | 9152 | 46.41 | 891 | 873 | 178.4 |
| B | 6 | 159 | 2038904 | 12123.39 | 880 | 856 | 168.1 |
| B | 6 | 36 | 104106 | 614.19 | 880 | 856 | 168.1 |
| B | 0 | 230 | 24515 | 140.74 | 880 | 856 | 168.1 |
| C | 14 | 238 | 137503 | 676.76 | 860 | 863 | 201.9 |
| C | 10 | 22 | 112326 | 552.06 | 860 | 863 | 201.9 |
| C | 3 | 233 | 17563 | 82.71 | 860 | 863 | 201.9 |
| D | 8 | 195 | 585817 | 2755.27 | 864 | 842 | 212.3 |
| D | 13 | 249 | 415259 | 1951.93 | 864 | 842 | 212.3 |
| D | 7 | 238 | 115511 | 540.1 | 864 | 842 | 212.3 |
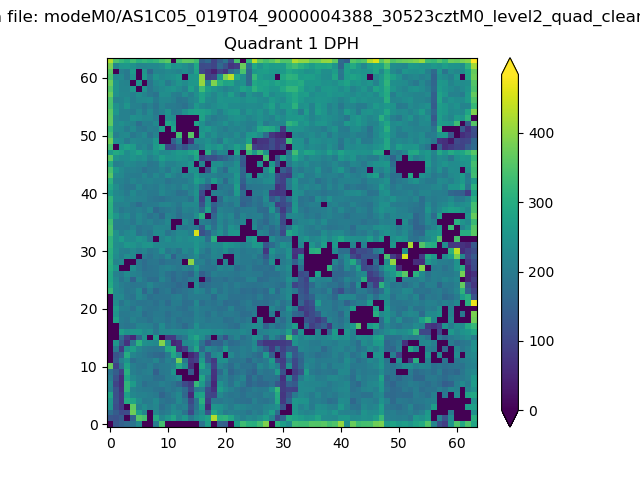
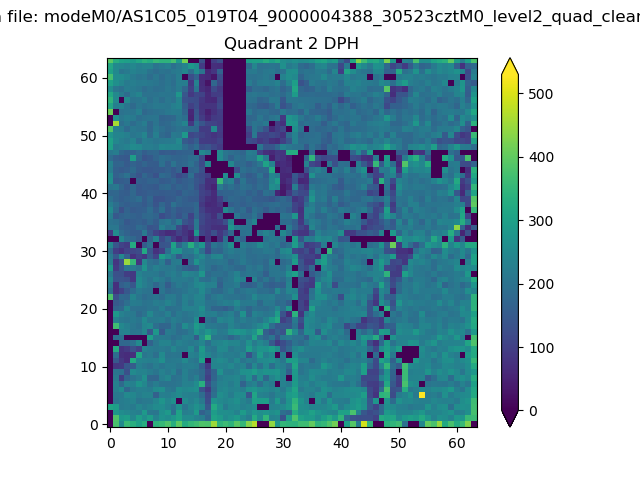
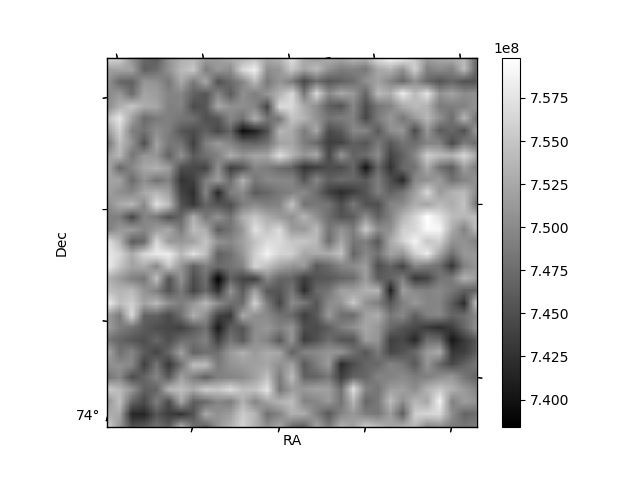
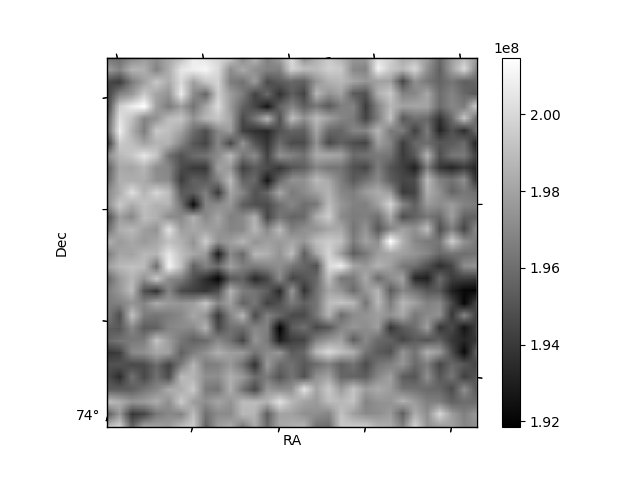
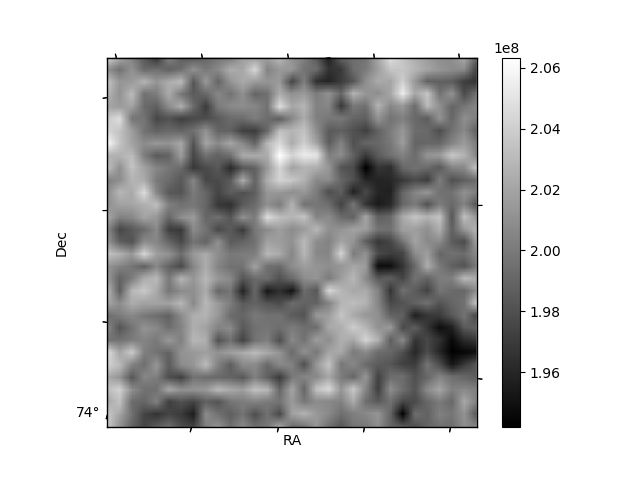
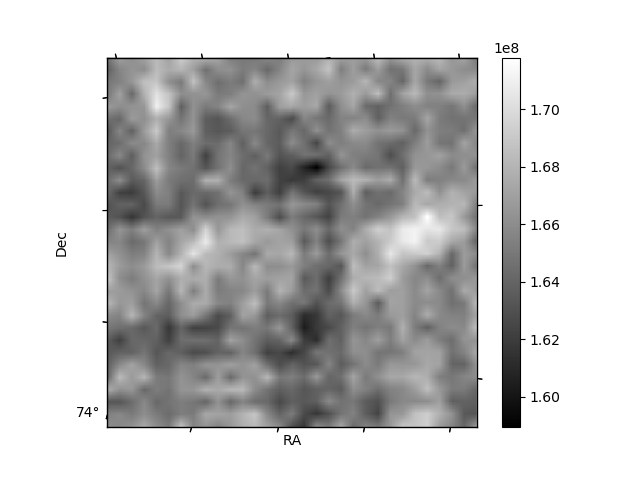
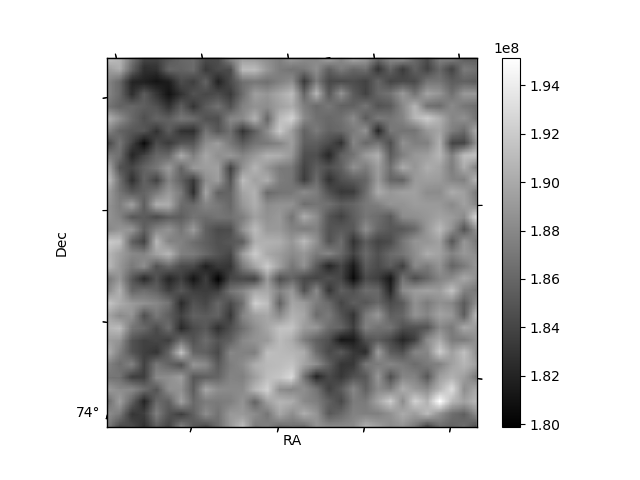
Histogram calculated using DETX and DETY for each event in the final _common_clean file
| Quadrant A | 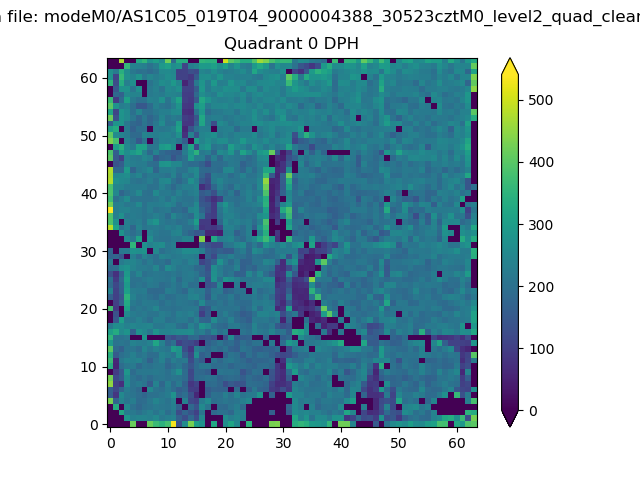 |
 |
Quadrant B |
|---|---|---|---|
| Quadrant D | 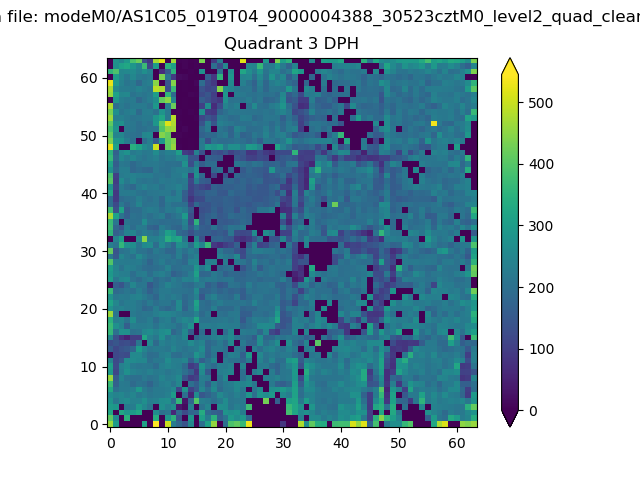 |
 |
Quadrant C |
| Plot type | Count rate plots | Images |
|---|---|---|
| Comparison with Poisson distribution Blue bars denote a histogram of data divided into 1 sec bins. Red curve is a Poisson curve with rate = median count rate of data. |
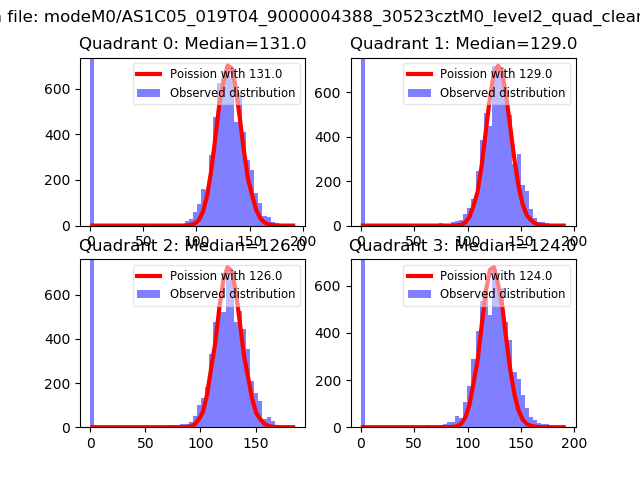 |
 |
| Quadrant-wise count rates Data is divided into 100 sec bins |
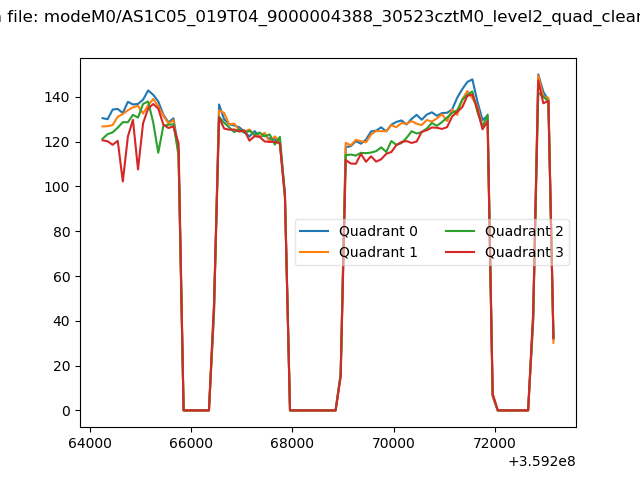 |
|
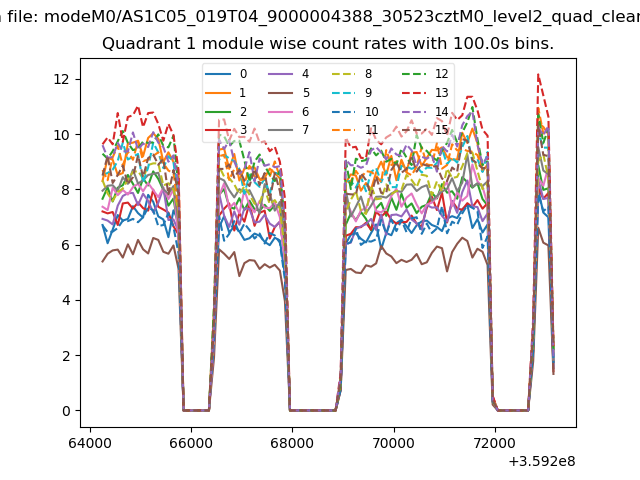
| Module-wise count rates for Quadrant A Data is divided into 100 sec bins |
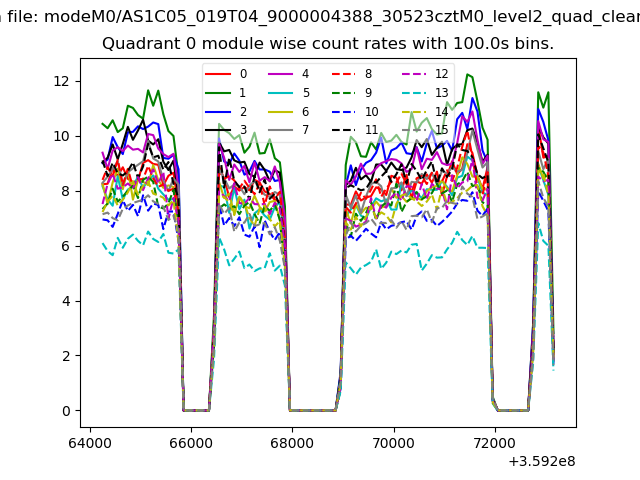 |
 |
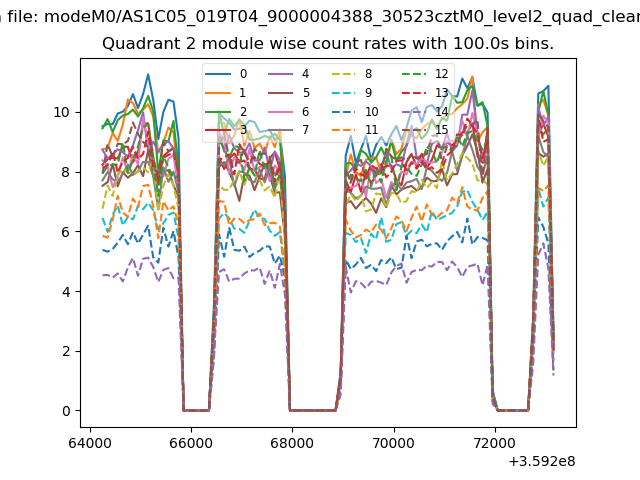
| Module-wise count rates for Quadrant B Data is divided into 100 sec bins |
 |
 |
| Module-wise count rates for Quadrant C Data is divided into 100 sec bins |
 |
 |
| Module-wise count rates for Quadrant D Data is divided into 100 sec bins |
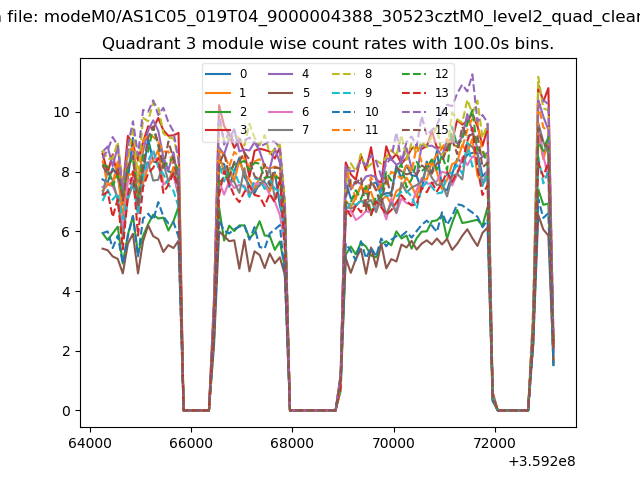 |
 |
| Parameter | Plot |
|---|---|
| CZT HV Monitor | 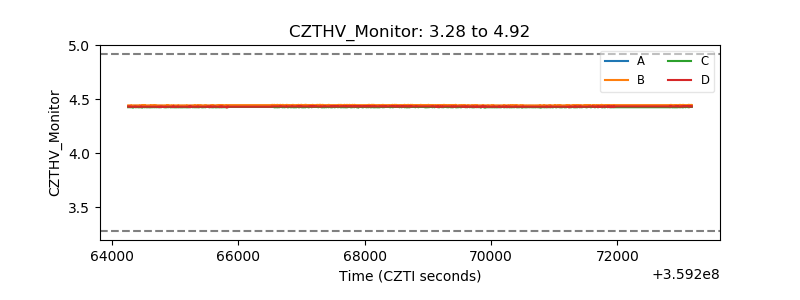 |
| D_VDD | 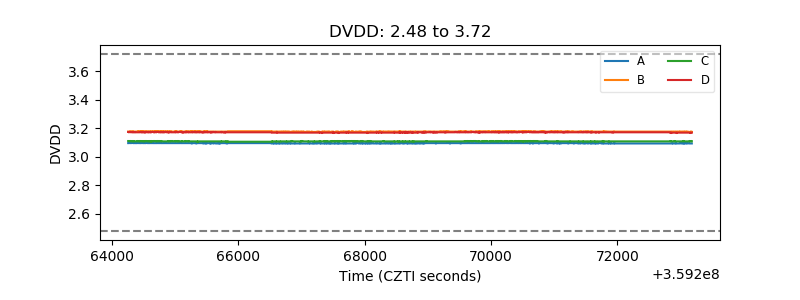 |
| Temperature 1 | 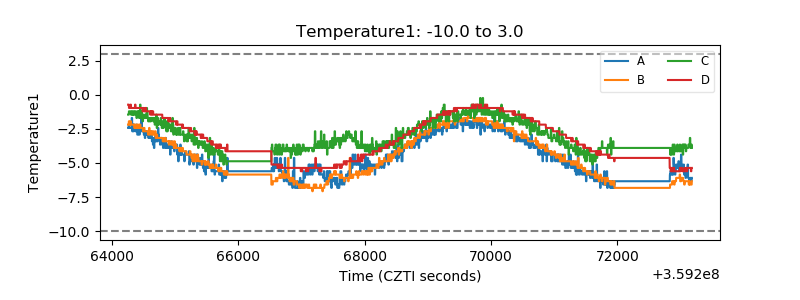 |
| Veto HV Monitor | 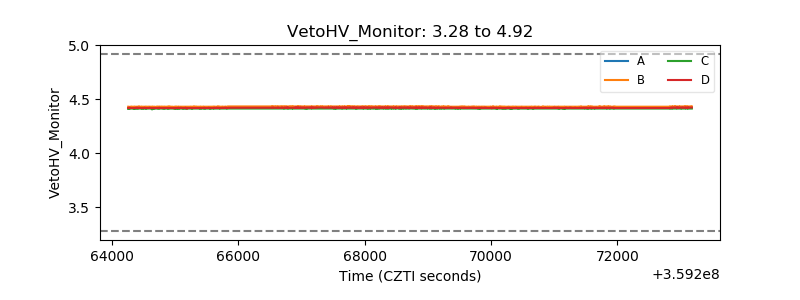 |
| Veto LLD | 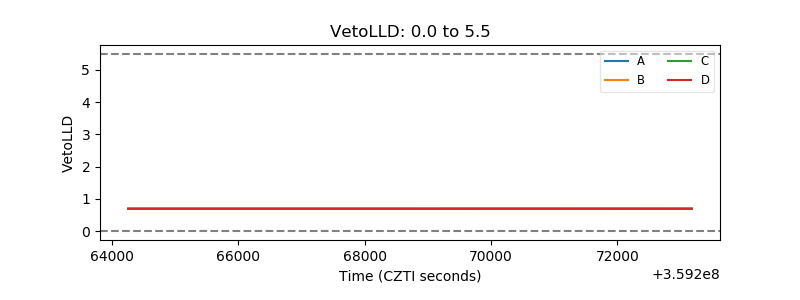 |
| Alpha Counter | 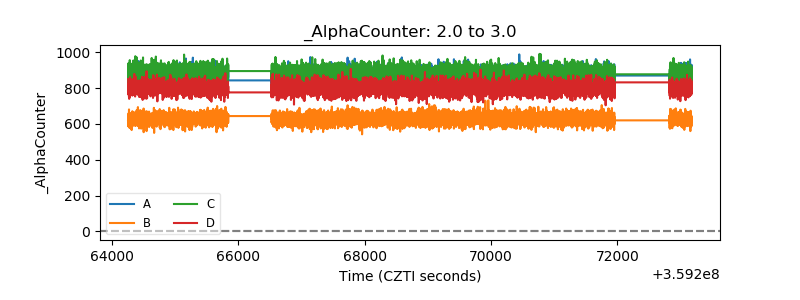 |
| _CPM_Rate | 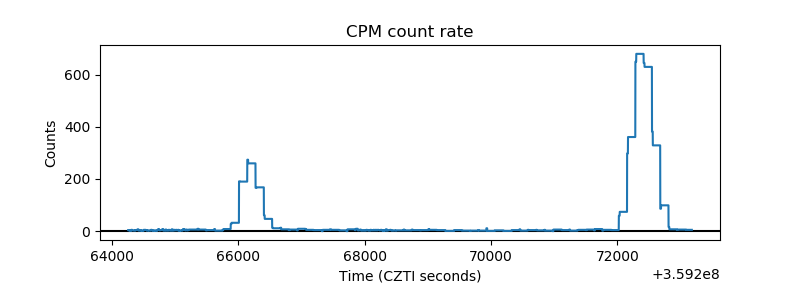 |
| CZT Counter | 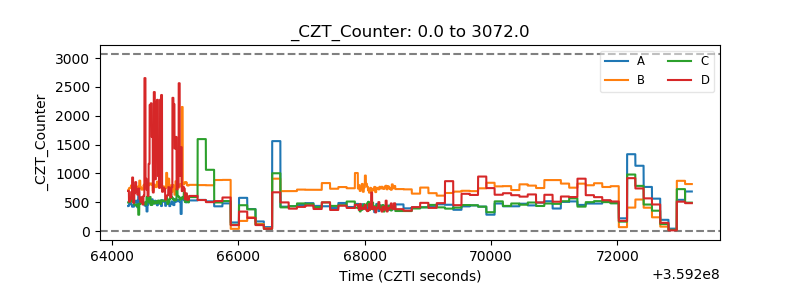 |
| +2.5 Volts monitor |  |
| +5 Volts monitor |  |
| _ROLL_ROT | 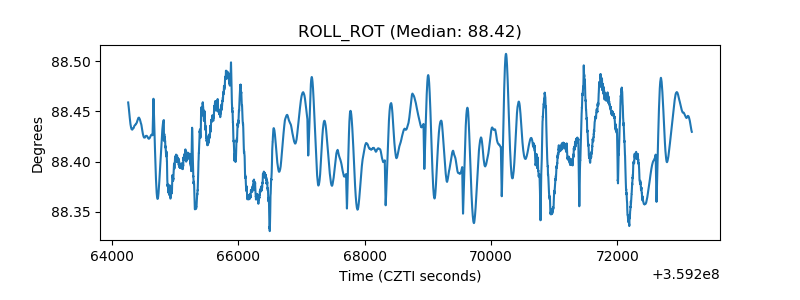 |
| _Roll_DEC | 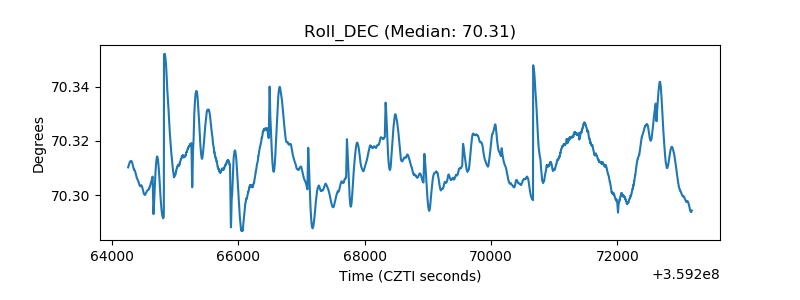 |
| _Roll_RA | 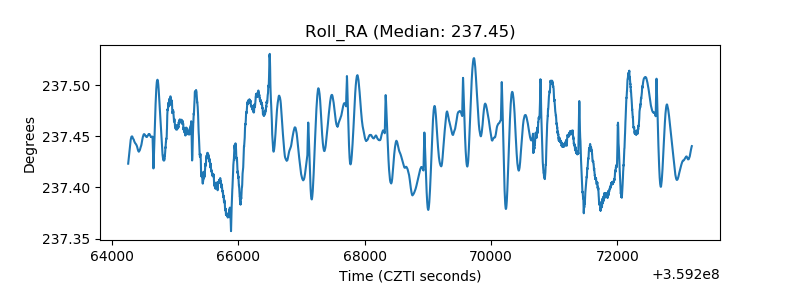 |
| Veto Counter | 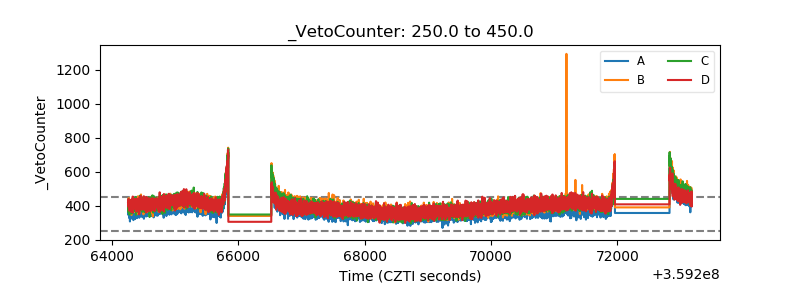 |