| Param | Original file | Final file |
|---|---|---|
| Filename | modeM0/AS1A10_053T13_9000004394cztM0_level2.fits | modeM0/AS1A10_053T13_9000004394cztM0_level2_quad_clean.evt |
| Size (bytes) | 368,887,680 | 301,366,080 |
| Size | 351.8 MB | 287.4 MB |
| Events in quadrant A | 2,307,672 | 1,726,862 |
| Events in quadrant B | 2,135,678 | 1,683,397 |
| Events in quadrant C | 2,186,818 | 1,631,063 |
| Events in quadrant D | 1,982,252 | 1,524,940 |
| Mode M0 | |||
|---|---|---|---|
| Quadrant | BADHDUFLAG | Total packets | Discarded packets |
| A | 0 | 77170 | 0 |
| B | 0 | 114950 | 0 |
| C | 0 | 82261 | 0 |
| D | 0 | 85742 | 0 |
| Mode SS | |||
|---|---|---|---|
| Quadrant | BADHDUFLAG | Total packets | Discarded packets |
| A | 0 | 762 | 0 |
| B | 0 | 762 | 0 |
| C | 0 | 762 | 0 |
| D | 0 | 762 | 0 |
| Mode M9 | |||
|---|---|---|---|
| Quadrant | BADHDUFLAG | Total packets | Discarded packets |
| A | 0 | 49 | 0 |
| B | 0 | 49 | 0 |
| C | 0 | 49 | 0 |
| D | 0 | 49 | 0 |
| Quadrant | Total seconds | Saturated seconds | Saturation percentage |
|---|---|---|---|
| A | 37250 | 255 | 0.684564% |
| B | 37250 | 844 | 2.265772% |
| C | 37250 | 966 | 2.593289% |
| D | 37250 | 335 | 0.899329% |
Noise dominated data is calculated using 1-second bins in cleaned event files. If a bin has >2000 counts, and if more than 50% of those come from <1% of pixels, then it is considered to be noise-dominated and hence unusable.
| Quadrant | # 1 sec bins | Bins with >0 counts | Bins with >2000 counts | High rate bins dominated by noise | Noise dominated (total time) | Noise dominated (detector-on time) | Marked lightcurve |
|---|---|---|---|---|---|---|---|
| A | 42309 | 37249 | 0 | 0 | 0.00% | 0.00% |  |
| B | 42309 | 37236 | 0 | 0 | 0.00% | 0.00% |  |
| C | 42309 | 37249 | 0 | 0 | 0.00% | 0.00% |  |
| D | 42309 | 37249 | 0 | 0 | 0.00% | 0.00% |  |
Top three noisy pixels from each quadrant. If the there are fewer than three noisy pixels in the level2.evt file, extra rows are filled as -1
| Pixel properties | Quadrant properties | ||||||
|---|---|---|---|---|---|---|---|
| Quadrant | DetID | PixID | Counts | Sigma | Mean | Median | Sigma |
| A | 0 | 29 | 2205 | 11.11 | 601 | 566 | 147.5 |
| A | 9 | 19 | 1772 | 8.18 | 601 | 566 | 147.5 |
| A | 7 | 110 | 1744 | 7.99 | 601 | 566 | 147.5 |
| B | 2 | 9 | 1788 | 10.89 | 565 | 539 | 114.7 |
| B | 2 | 8 | 1478 | 8.19 | 565 | 539 | 114.7 |
| B | 3 | 17 | 1461 | 8.04 | 565 | 539 | 114.7 |
| C | 12 | 241 | 1514 | 6.54 | 578 | 540 | 148.9 |
| C | 3 | 126 | 1500 | 6.45 | 578 | 540 | 148.9 |
| C | 7 | 111 | 1495 | 6.42 | 578 | 540 | 148.9 |
| D | 15 | 46 | 1457 | 6.28 | 565 | 517 | 149.6 |
| D | 7 | 3 | 1375 | 5.74 | 565 | 517 | 149.6 |
| D | 6 | 231 | 1370 | 5.7 | 565 | 517 | 149.6 |
Histogram calculated using DETX and DETY for each event in the final _common_clean file
| Quadrant A | 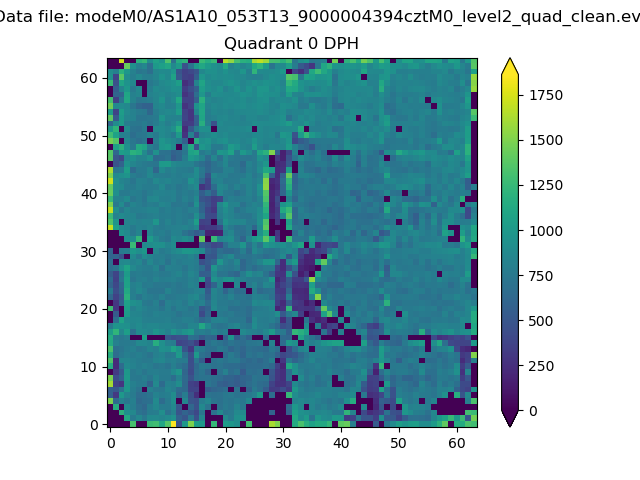 |
 |
Quadrant B |
|---|---|---|---|
| Quadrant D |  |
 |
Quadrant C |
| Plot type | Count rate plots | Images |
|---|---|---|
| Comparison with Poisson distribution Blue bars denote a histogram of data divided into 1 sec bins. Red curve is a Poisson curve with rate = median count rate of data. |
 |
 |
| Quadrant-wise count rates Data is divided into 100 sec bins |
 |
|
| Module-wise count rates for Quadrant A Data is divided into 100 sec bins |
 |
 |
| Module-wise count rates for Quadrant B Data is divided into 100 sec bins |
 |
 |
| Module-wise count rates for Quadrant C Data is divided into 100 sec bins |
 |
 |
| Module-wise count rates for Quadrant D Data is divided into 100 sec bins |
 |
 |
| Parameter | Plot |
|---|---|
| CZT HV Monitor |  |
| D_VDD | 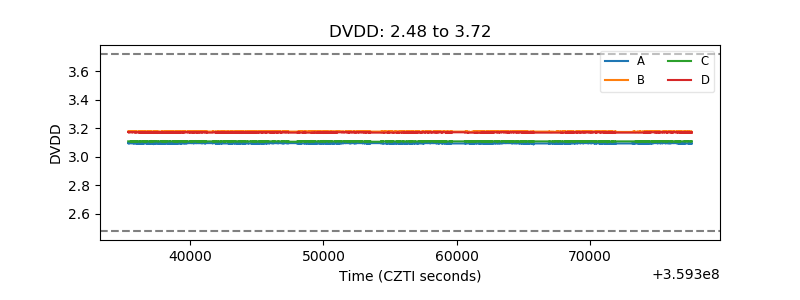 |
| Temperature 1 |  |
| Veto HV Monitor |  |
| Veto LLD |  |
| Alpha Counter |  |
| _CPM_Rate |  |
| CZT Counter |  |
| +2.5 Volts monitor |  |
| +5 Volts monitor |  |
| _ROLL_ROT |  |
| _Roll_DEC |  |
| _Roll_RA |  |
| Veto Counter |  |