| Param | Original file | Final file |
|---|---|---|
| Filename | modeM0/AS1A10_053T13_9000004394_30533cztM0_level2.evt | modeM0/AS1A10_053T13_9000004394_30533cztM0_level2_quad_clean.evt |
| Size (bytes) | 132,554,880 | 21,323,520 |
| Size | 126.4 MB | 20.3 MB |
| Events in quadrant A | 812,599 | 135,744 |
| Events in quadrant B | 1,316,458 | 133,229 |
| Events in quadrant C | 831,738 | 127,085 |
| Events in quadrant D | 938,264 | 126,971 |
| Mode M0 | |||
|---|---|---|---|
| Quadrant | BADHDUFLAG | Total packets | Discarded packets |
| A | 0 | 3464 | 1 |
| B | 0 | 5047 | 1 |
| C | 0 | 3484 | 2 |
| D | 0 | 3789 | 1 |
| Mode SS | |||
|---|---|---|---|
| Quadrant | BADHDUFLAG | Total packets | Discarded packets |
| A | 0 | 34 | 0 |
| B | 0 | 34 | 0 |
| C | 0 | 34 | 0 |
| D | 0 | 34 | 0 |
| Quadrant | Total seconds | Saturated seconds | Saturation percentage |
|---|---|---|---|
| A | 1658 | 20 | 1.206273% |
| B | 1658 | 45 | 2.714113% |
| C | 1657 | 38 | 2.293301% |
| D | 1657 | 15 | 0.905250% |
Noise dominated data is calculated using 1-second bins in cleaned event files. If a bin has >2000 counts, and if more than 50% of those come from <1% of pixels, then it is considered to be noise-dominated and hence unusable.
| Quadrant | # 1 sec bins | Bins with >0 counts | Bins with >2000 counts | High rate bins dominated by noise | Noise dominated (total time) | Noise dominated (detector-on time) | Marked lightcurve |
|---|---|---|---|---|---|---|---|
| A | 1658 | 1658 | 1 | 1 | 0.06% | 0.06% | 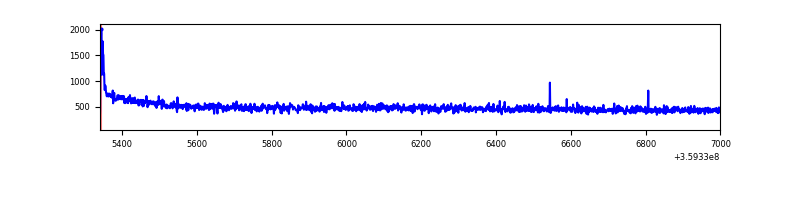 |
| B | 1658 | 1658 | 0 | 0 | 0.00% | 0.00% | 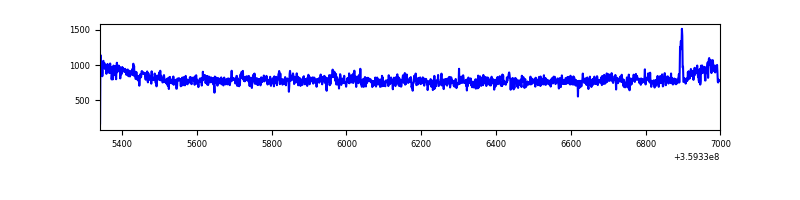 |
| C | 1657 | 1657 | 0 | 0 | 0.00% | 0.00% | 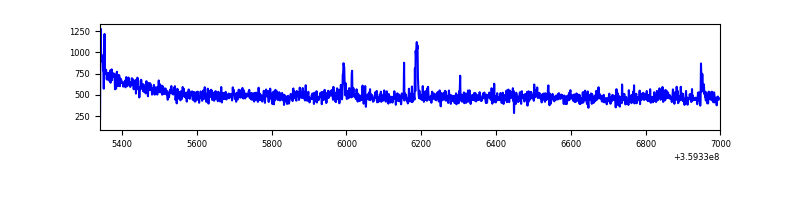 |
| D | 1657 | 1657 | 5 | 5 | 0.30% | 0.30% | 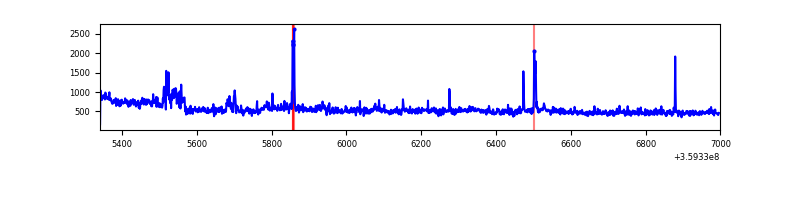 |
Top three noisy pixels from each quadrant. If the there are fewer than three noisy pixels in the level2.evt file, extra rows are filled as -1
| Pixel properties | Quadrant properties | ||||||
|---|---|---|---|---|---|---|---|
| Quadrant | DetID | PixID | Counts | Sigma | Mean | Median | Sigma |
| A | 8 | 192 | 13248 | 294.4 | 206 | 201 | 44.3 |
| A | 13 | 254 | 3257 | 68.96 | 206 | 201 | 44.3 |
| A | 3 | 137 | 2086 | 42.53 | 206 | 201 | 44.3 |
| B | 6 | 159 | 471883 | 11314.37 | 206 | 201 | 41.7 |
| B | 6 | 36 | 22895 | 544.37 | 206 | 201 | 41.7 |
| B | 0 | 230 | 6333 | 147.09 | 206 | 201 | 41.7 |
| C | 14 | 238 | 32606 | 662.47 | 198 | 198 | 48.9 |
| C | 10 | 22 | 9649 | 193.19 | 198 | 198 | 48.9 |
| C | 3 | 233 | 8458 | 168.85 | 198 | 198 | 48.9 |
| D | 8 | 195 | 88487 | 1789.94 | 199 | 193 | 49.3 |
| D | 1 | 52 | 74463 | 1505.64 | 199 | 193 | 49.3 |
| D | 2 | 234 | 8206 | 162.44 | 199 | 193 | 49.3 |
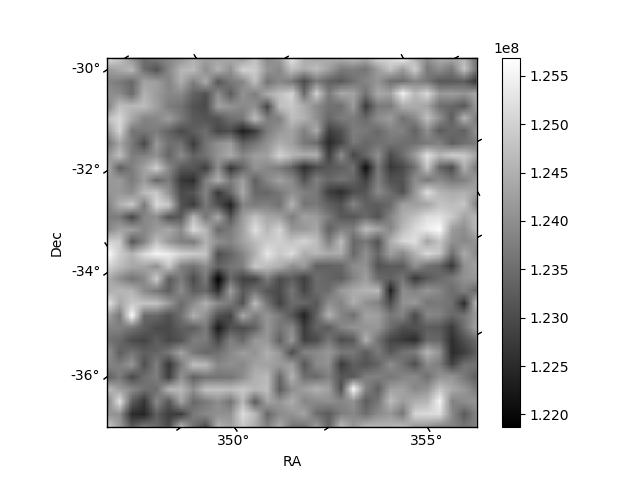
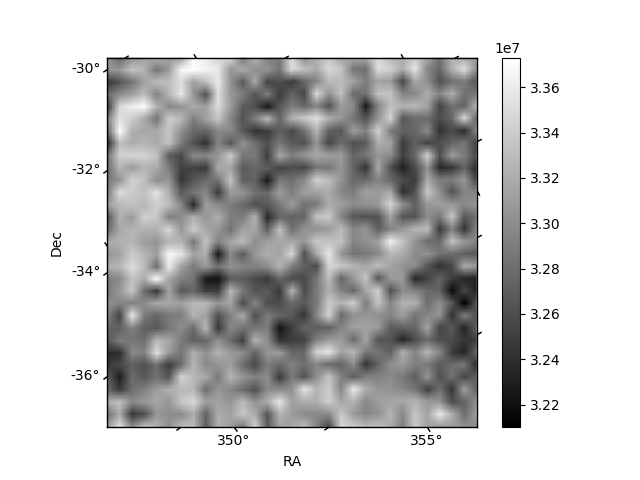
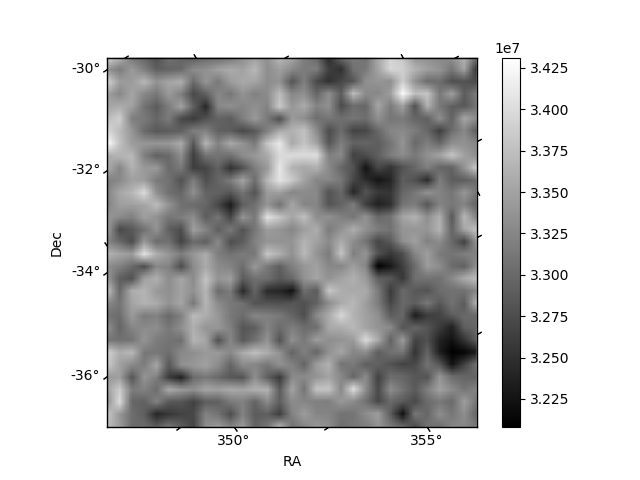
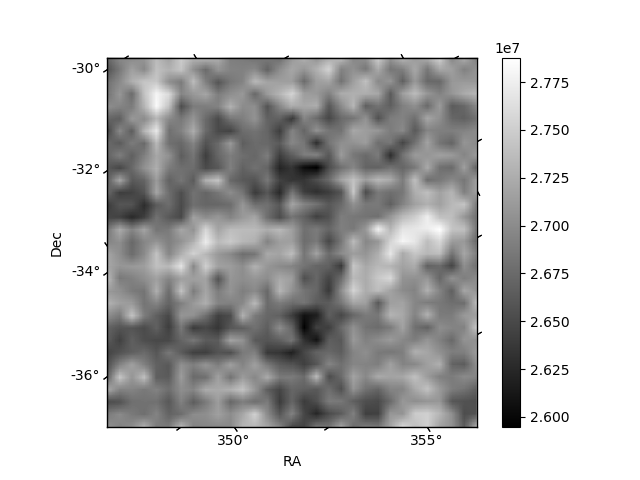
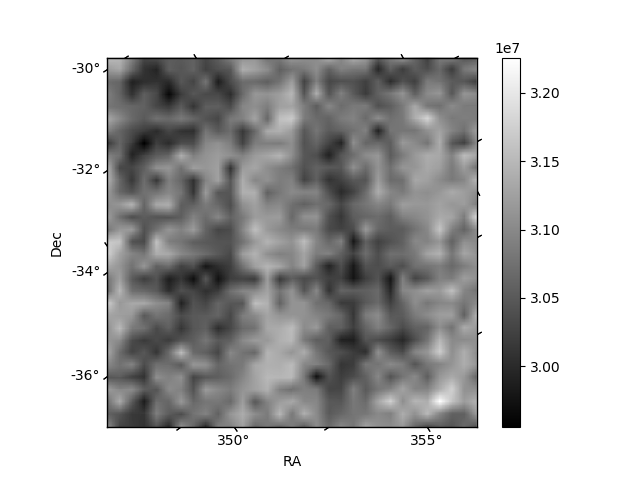
Histogram calculated using DETX and DETY for each event in the final _common_clean file
| Quadrant A | 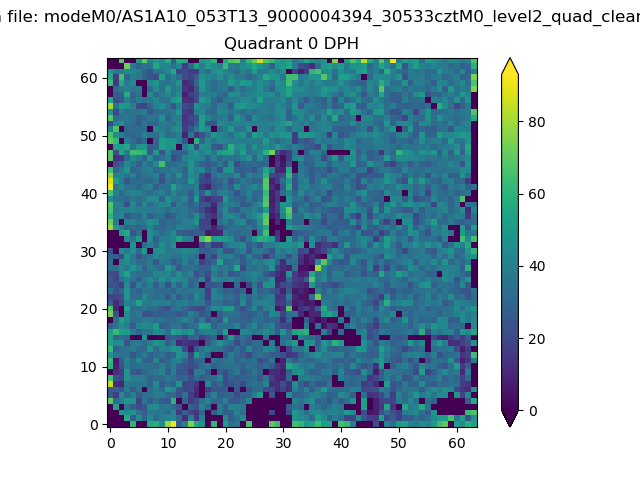 |
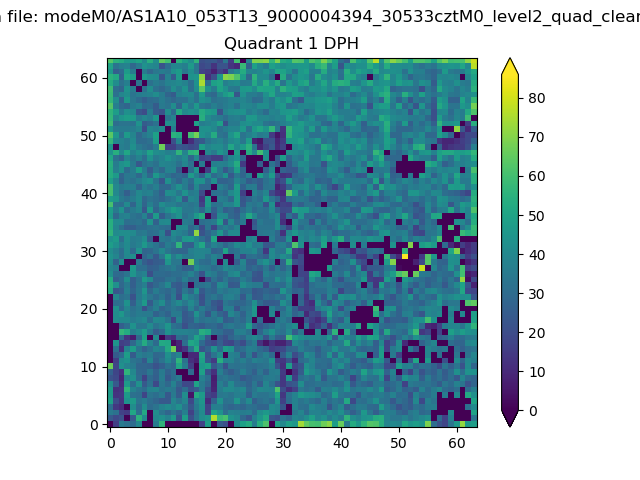 |
Quadrant B |
|---|---|---|---|
| Quadrant D | 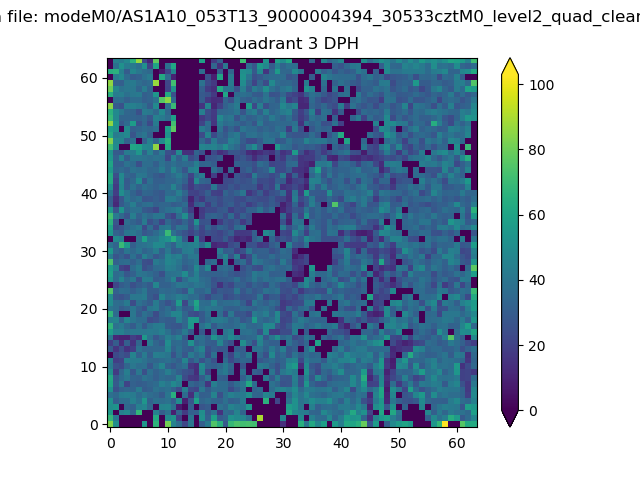 |
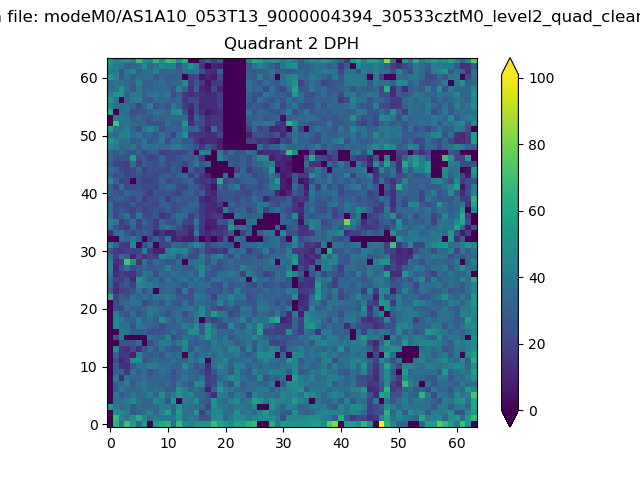 |
Quadrant C |
| Plot type | Count rate plots | Images |
|---|---|---|
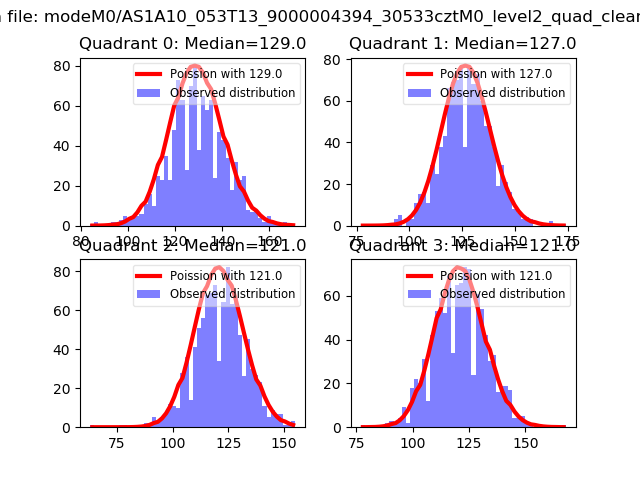
| Comparison with Poisson distribution Blue bars denote a histogram of data divided into 1 sec bins. Red curve is a Poisson curve with rate = median count rate of data. |
 |
 |
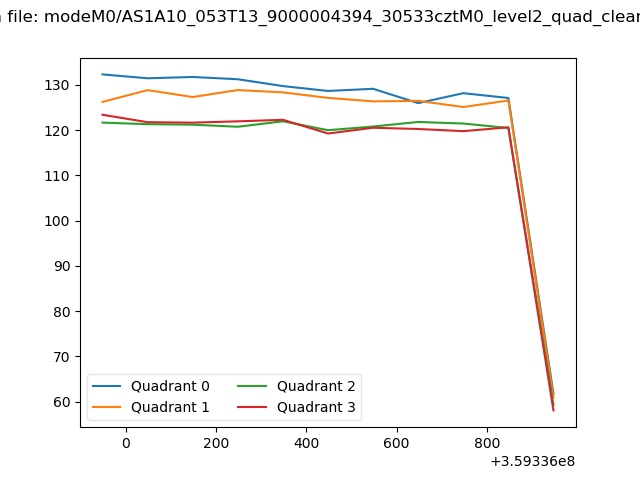
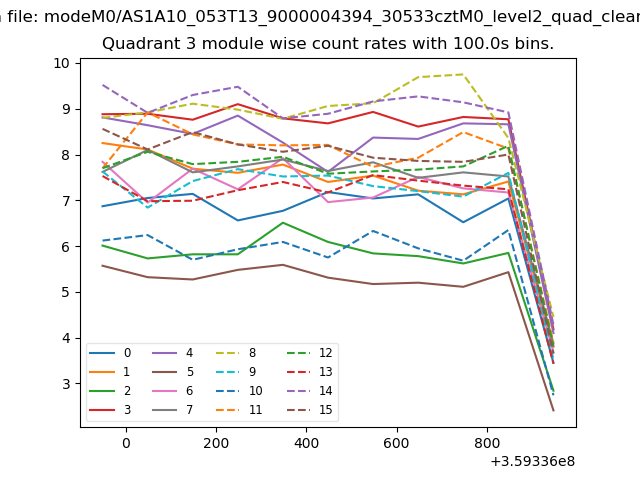
| Quadrant-wise count rates Data is divided into 100 sec bins |
 |
|
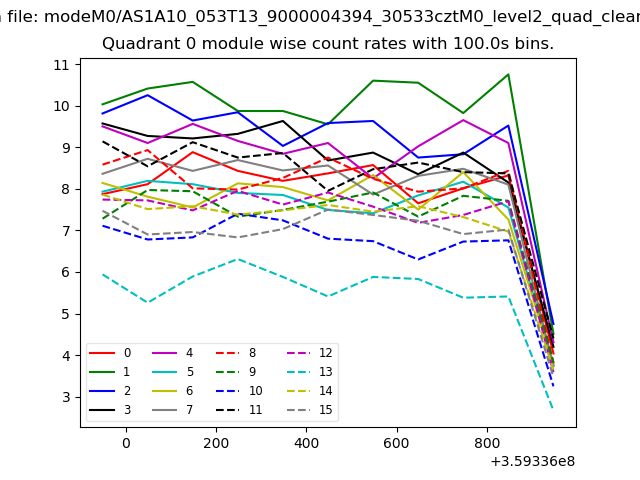
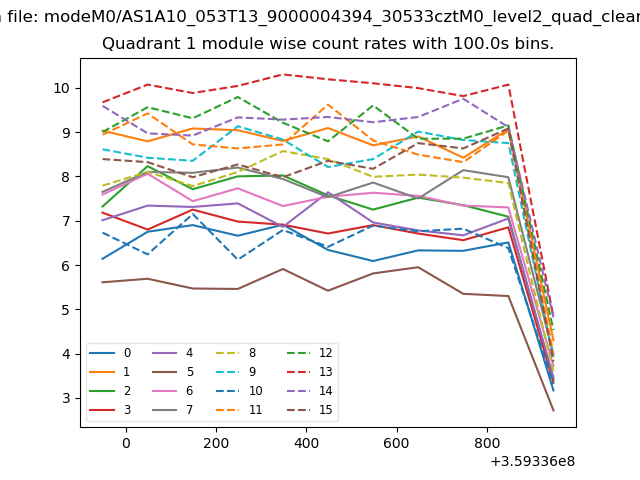
| Module-wise count rates for Quadrant A Data is divided into 100 sec bins |
 |
 |
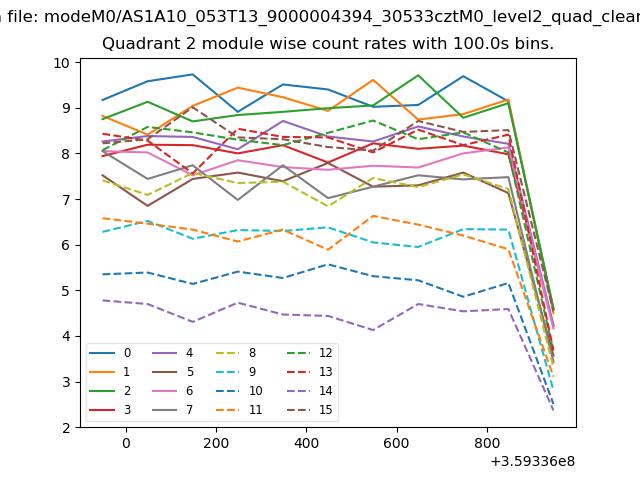
| Module-wise count rates for Quadrant B Data is divided into 100 sec bins |
 |
 |
| Module-wise count rates for Quadrant C Data is divided into 100 sec bins |
 |
 |
| Module-wise count rates for Quadrant D Data is divided into 100 sec bins |
 |
 |
| Parameter | Plot |
|---|---|
| CZT HV Monitor | 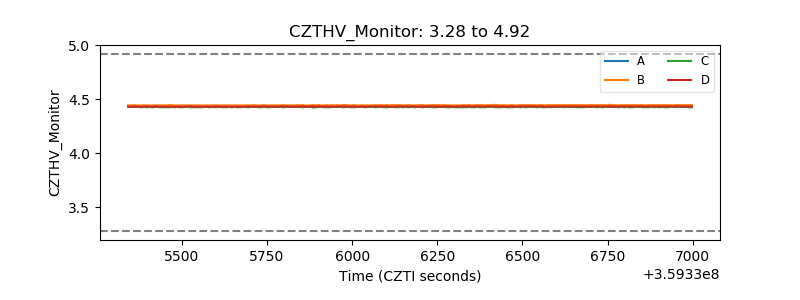 |
| D_VDD | 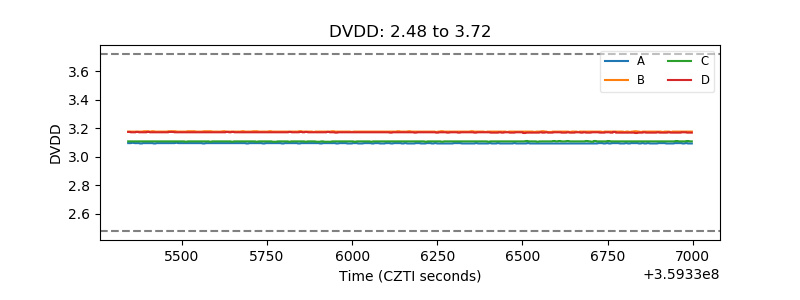 |
| Temperature 1 | 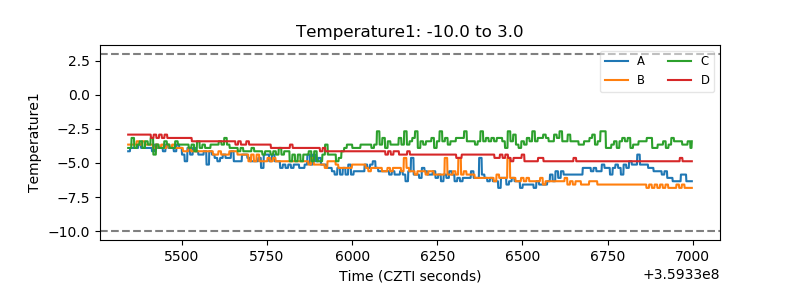 |
| Veto HV Monitor | 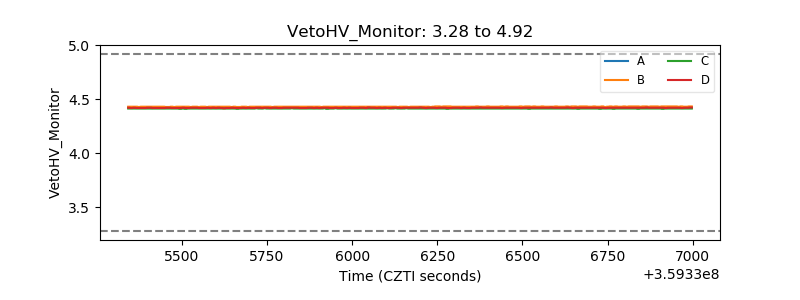 |
| Veto LLD | 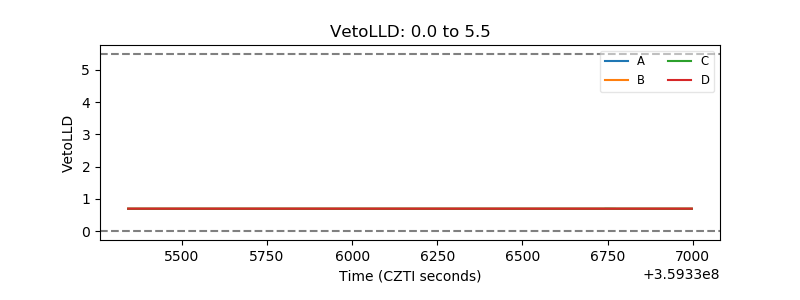 |
| Alpha Counter | 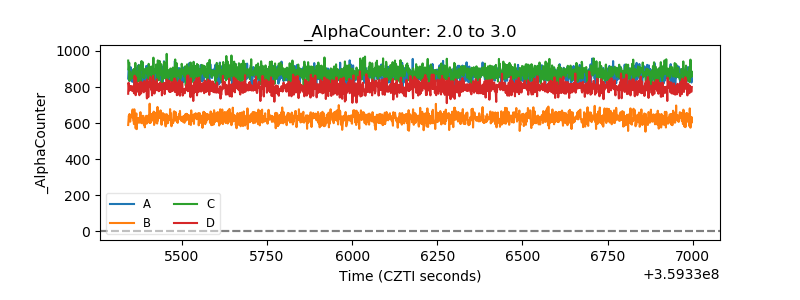 |
| _CPM_Rate | 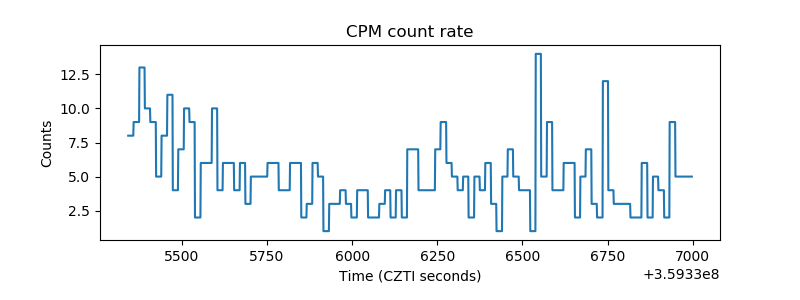 |
| CZT Counter | 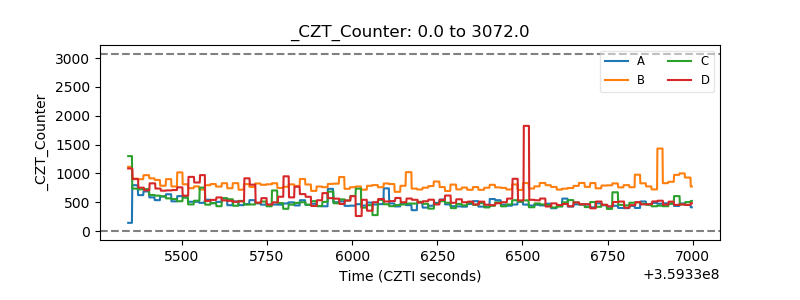 |
| +2.5 Volts monitor |  |
| +5 Volts monitor |  |
| _ROLL_ROT | 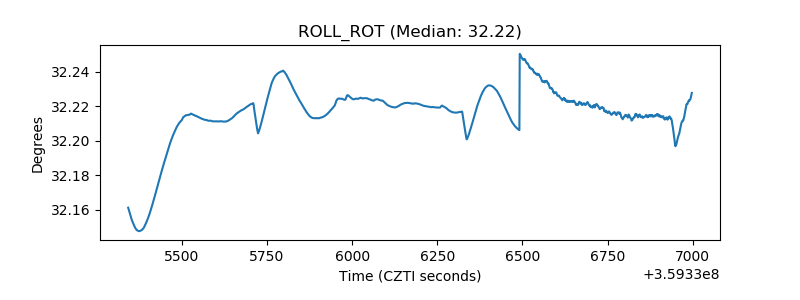 |
| _Roll_DEC | 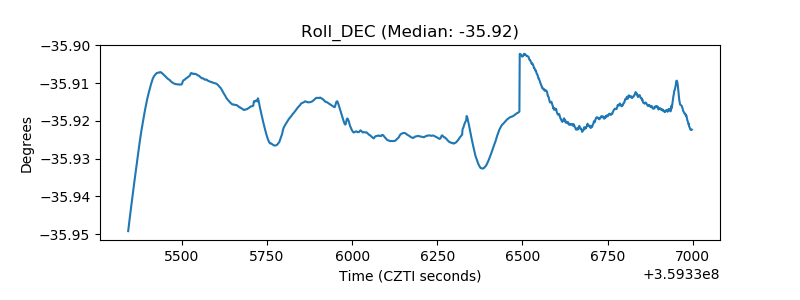 |
| _Roll_RA | 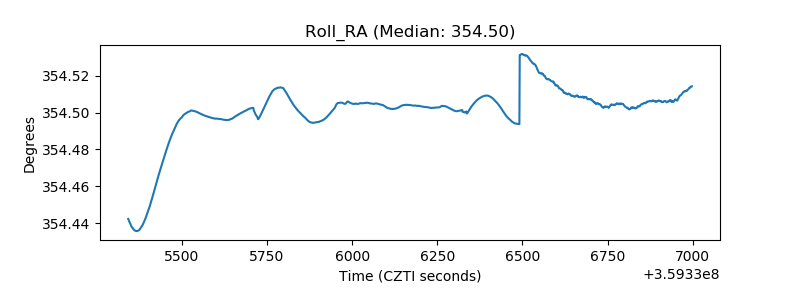 |
| Veto Counter | 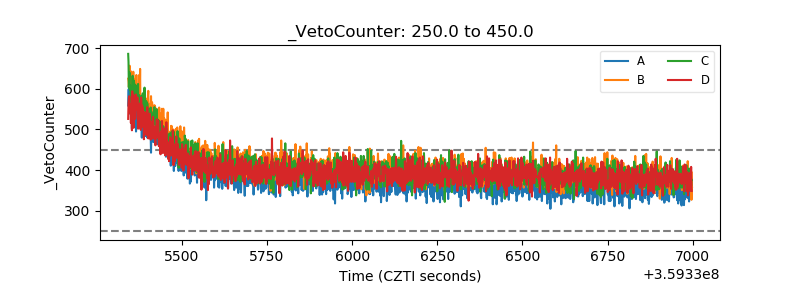 |