| Param | Original file | Final file |
|---|---|---|
| Filename | modeM0/AS1A10_053T13_9000004394_30536cztM0_level2.evt | modeM0/AS1A10_053T13_9000004394_30536cztM0_level2_quad_clean.evt |
| Size (bytes) | 1,491,785,280 | 240,949,440 |
| Size | 1.4 GB | 229.8 MB |
| Events in quadrant A | 8,822,957 | 1,539,360 |
| Events in quadrant B | 14,827,231 | 1,519,135 |
| Events in quadrant C | 9,147,576 | 1,487,762 |
| Events in quadrant D | 11,123,260 | 1,466,047 |
| Mode M0 | |||
|---|---|---|---|
| Quadrant | BADHDUFLAG | Total packets | Discarded packets |
| A | 0 | 38224 | 4 |
| B | 0 | 57560 | 4 |
| C | 0 | 38666 | 4 |
| D | 0 | 45008 | 4 |
| Mode SS | |||
|---|---|---|---|
| Quadrant | BADHDUFLAG | Total packets | Discarded packets |
| A | 0 | 380 | 0 |
| B | 0 | 380 | 0 |
| C | 0 | 380 | 0 |
| D | 0 | 380 | 0 |
| Mode M9 | |||
|---|---|---|---|
| Quadrant | BADHDUFLAG | Total packets | Discarded packets |
| A | 0 | 18 | 0 |
| B | 0 | 18 | 0 |
| C | 0 | 18 | 0 |
| D | 0 | 18 | 0 |
| Quadrant | Total seconds | Saturated seconds | Saturation percentage |
|---|---|---|---|
| A | 18654 | 136 | 0.729066% |
| B | 18653 | 479 | 2.567952% |
| C | 18653 | 318 | 1.704820% |
| D | 18653 | 243 | 1.302740% |
Noise dominated data is calculated using 1-second bins in cleaned event files. If a bin has >2000 counts, and if more than 50% of those come from <1% of pixels, then it is considered to be noise-dominated and hence unusable.
| Quadrant | # 1 sec bins | Bins with >0 counts | Bins with >2000 counts | High rate bins dominated by noise | Noise dominated (total time) | Noise dominated (detector-on time) | Marked lightcurve |
|---|---|---|---|---|---|---|---|
| A | 20484 | 18658 | 2 | 2 | 0.01% | 0.01% | 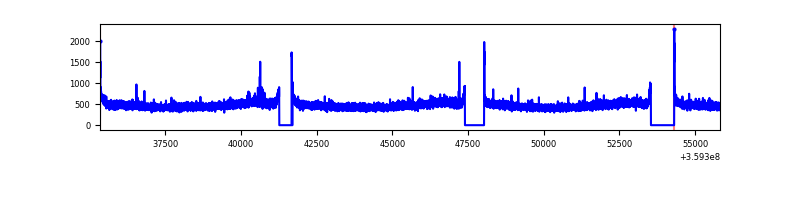 |
| B | 20483 | 18657 | 124 | 124 | 0.61% | 0.66% | 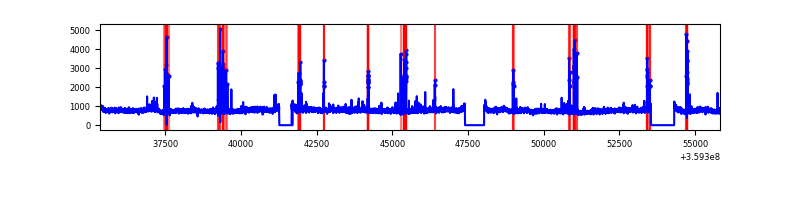 |
| C | 20483 | 18657 | 3 | 3 | 0.01% | 0.02% | 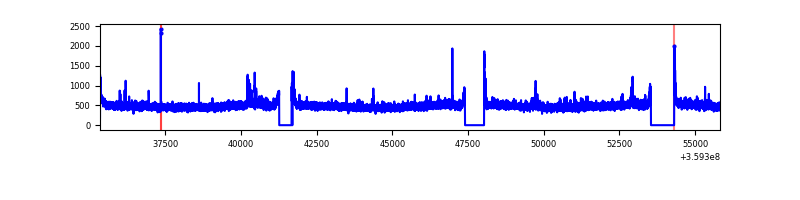 |
| D | 20483 | 18657 | 131 | 131 | 0.64% | 0.70% | 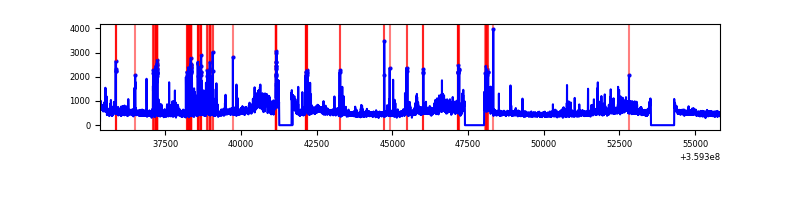 |
Top three noisy pixels from each quadrant. If the there are fewer than three noisy pixels in the level2.evt file, extra rows are filled as -1
| Pixel properties | Quadrant properties | ||||||
|---|---|---|---|---|---|---|---|
| Quadrant | DetID | PixID | Counts | Sigma | Mean | Median | Sigma |
| A | 8 | 192 | 54035 | 114.39 | 2269 | 2224 | 452.9 |
| A | 13 | 254 | 35026 | 72.42 | 2269 | 2224 | 452.9 |
| A | 3 | 137 | 22692 | 45.19 | 2269 | 2224 | 452.9 |
| B | 6 | 159 | 5254197 | 12306.41 | 2226 | 2166 | 426.8 |
| B | 4 | 171 | 378313 | 881.38 | 2226 | 2166 | 426.8 |
| B | 0 | 229 | 254184 | 590.52 | 2226 | 2166 | 426.8 |
| C | 14 | 238 | 356737 | 692.47 | 2180 | 2193 | 512.0 |
| C | 3 | 233 | 158531 | 305.35 | 2180 | 2193 | 512.0 |
| C | 0 | 10 | 59178 | 111.3 | 2180 | 2193 | 512.0 |
| D | 1 | 52 | 993801 | 1899.27 | 2207 | 2148 | 522.1 |
| D | 8 | 195 | 847459 | 1618.98 | 2207 | 2148 | 522.1 |
| D | 13 | 104 | 505589 | 964.22 | 2207 | 2148 | 522.1 |
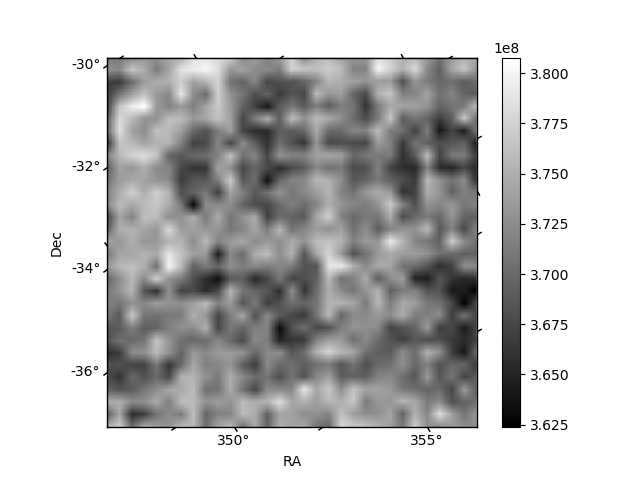
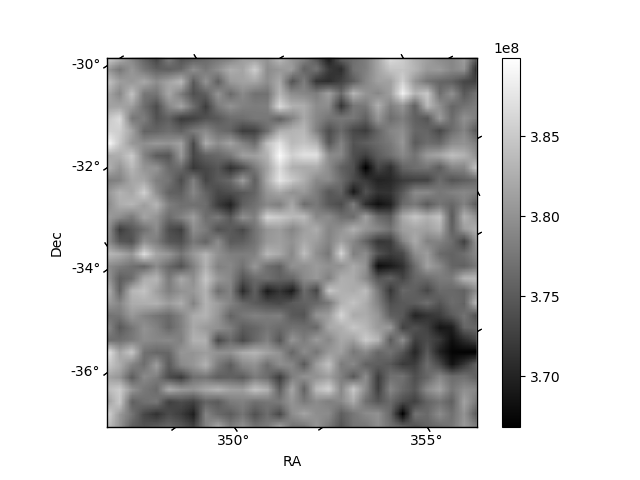
Histogram calculated using DETX and DETY for each event in the final _common_clean file
| Quadrant A | 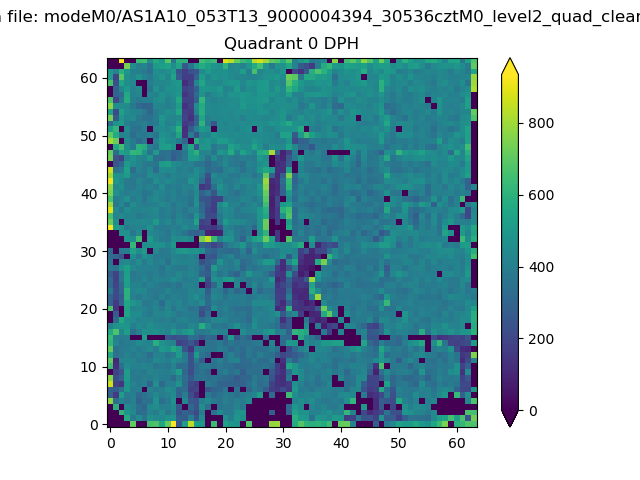 |
 |
Quadrant B |
|---|---|---|---|
| Quadrant D | 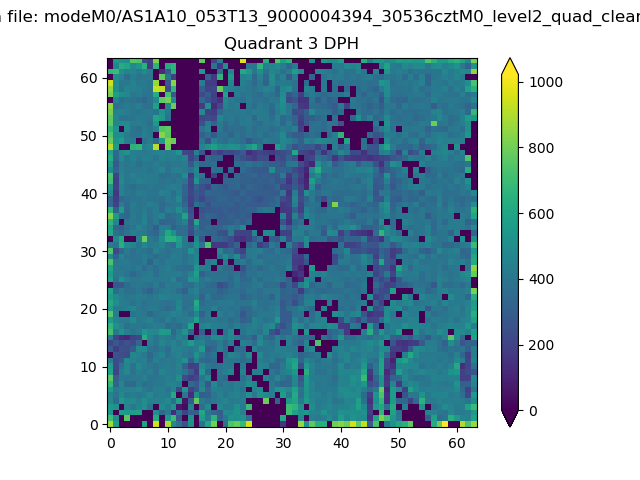 |
 |
Quadrant C |
| Plot type | Count rate plots | Images |
|---|---|---|
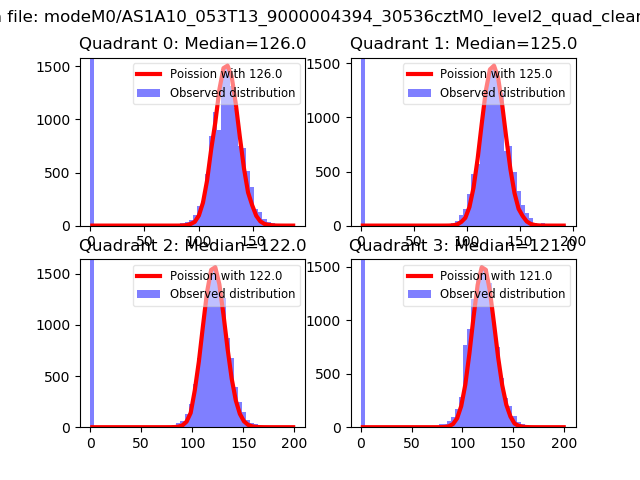
| Comparison with Poisson distribution Blue bars denote a histogram of data divided into 1 sec bins. Red curve is a Poisson curve with rate = median count rate of data. |
 |
 |
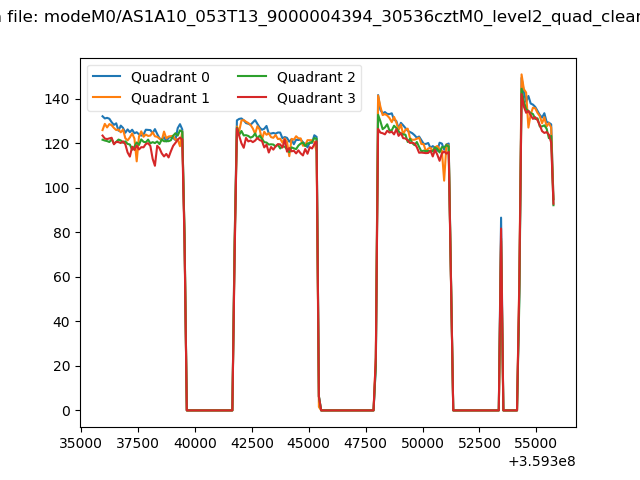
| Quadrant-wise count rates Data is divided into 100 sec bins |
 |
|
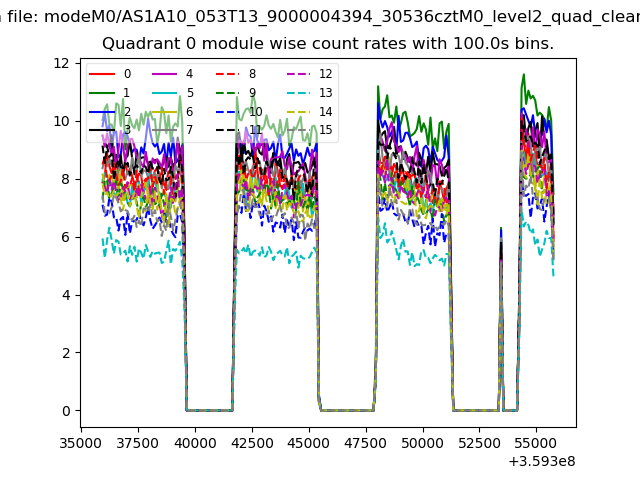
| Module-wise count rates for Quadrant A Data is divided into 100 sec bins |
 |
 |
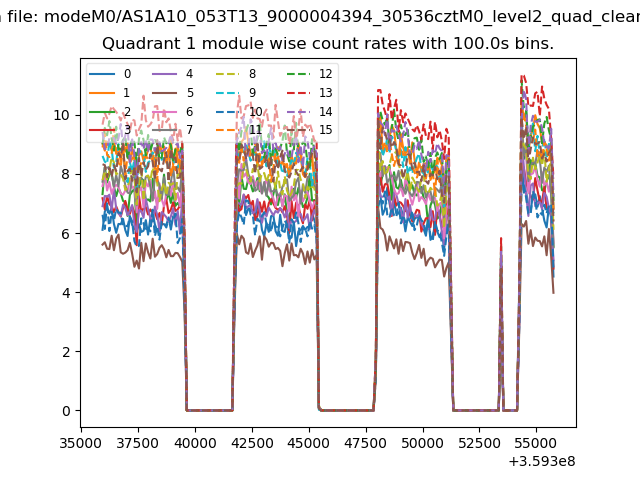
| Module-wise count rates for Quadrant B Data is divided into 100 sec bins |
 |
 |
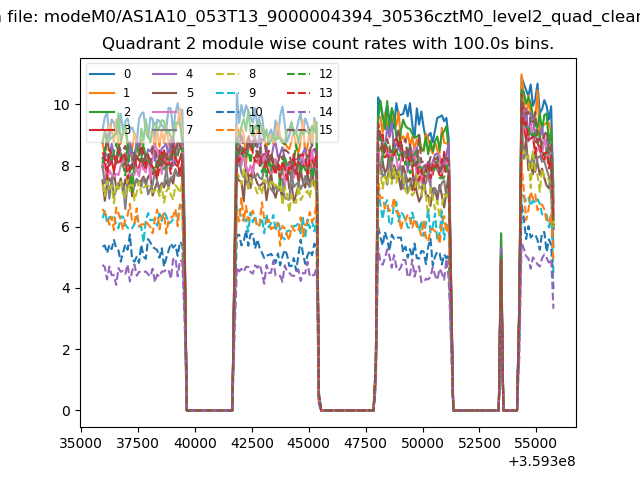
| Module-wise count rates for Quadrant C Data is divided into 100 sec bins |
 |
 |
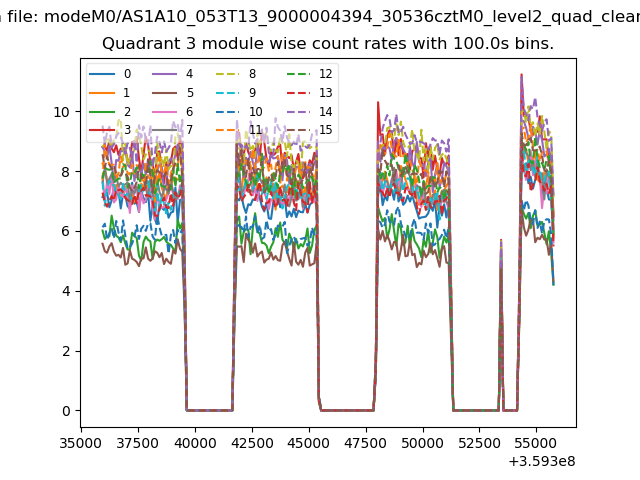
| Module-wise count rates for Quadrant D Data is divided into 100 sec bins |
 |
 |
| Parameter | Plot |
|---|---|
| CZT HV Monitor | 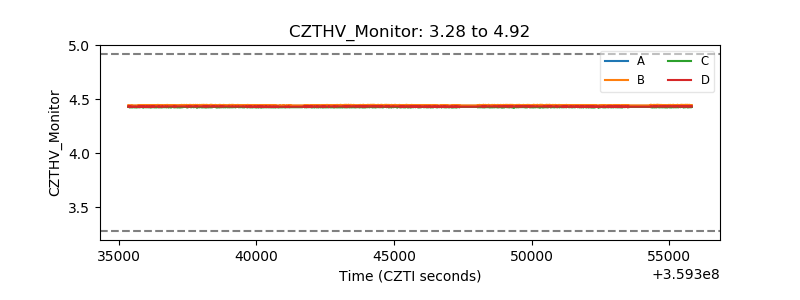 |
| D_VDD | 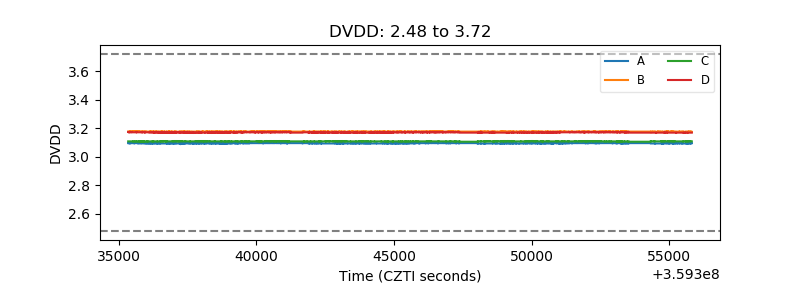 |
| Temperature 1 | 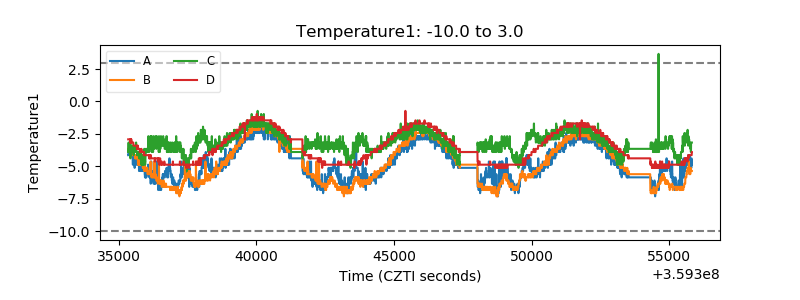 |
| Veto HV Monitor | 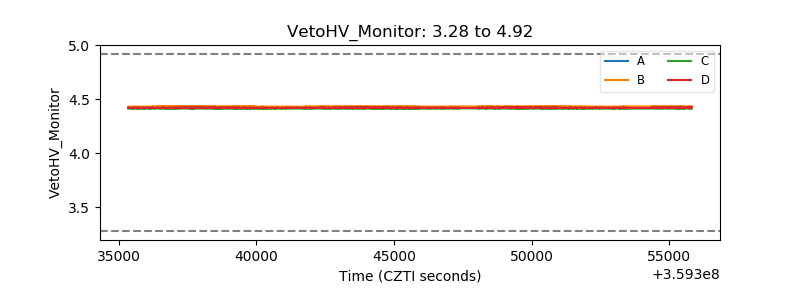 |
| Veto LLD |  |
| Alpha Counter | 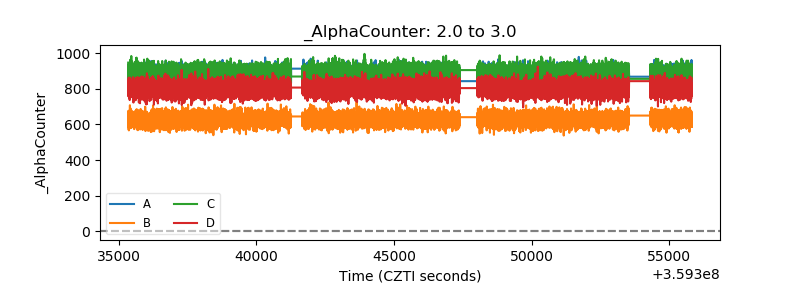 |
| _CPM_Rate | 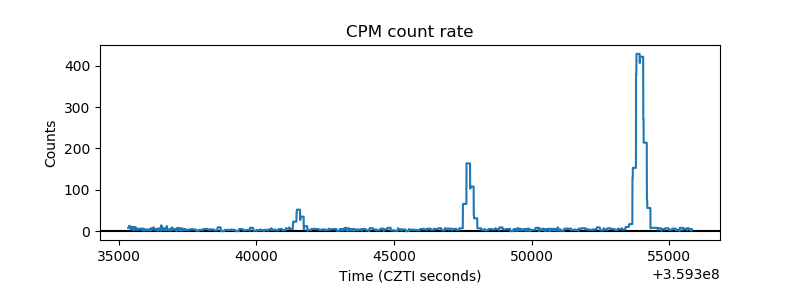 |
| CZT Counter | 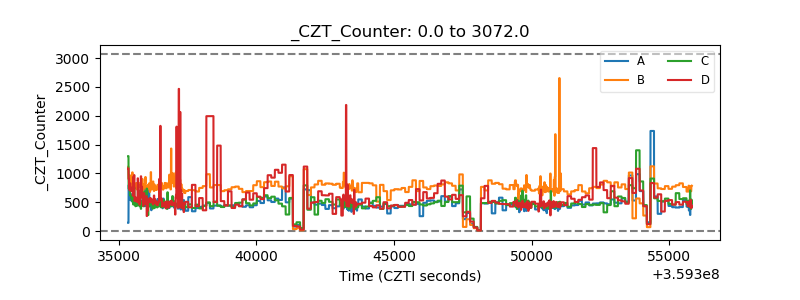 |
| +2.5 Volts monitor |  |
| +5 Volts monitor |  |
| _ROLL_ROT | 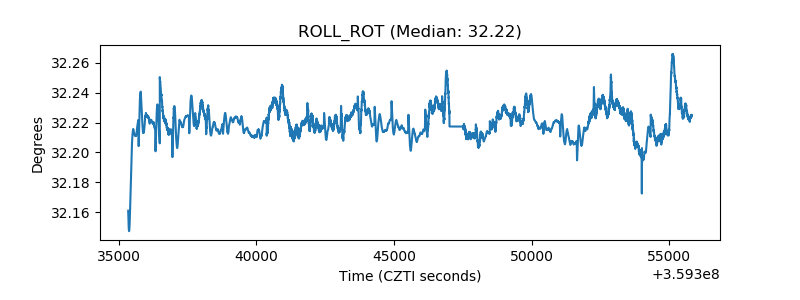 |
| _Roll_DEC | 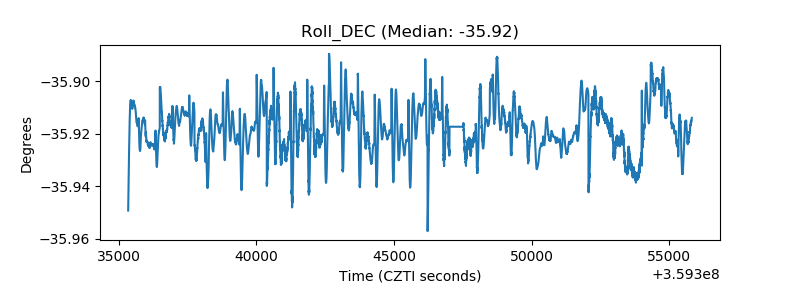 |
| _Roll_RA |  |
| Veto Counter | 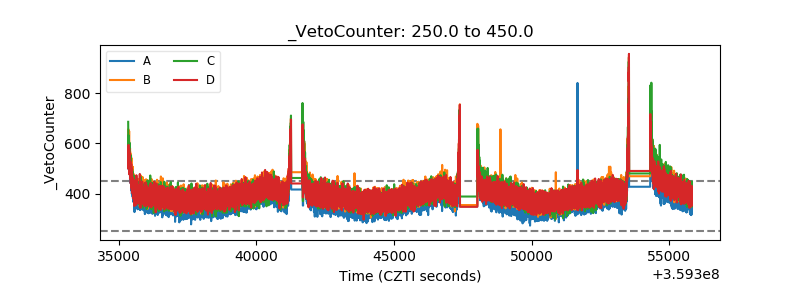 |