| Param | Original file | Final file |
|---|---|---|
| Filename | modeM0/AS1A10_053T13_9000004394_30537cztM0_level2.evt | modeM0/AS1A10_053T13_9000004394_30537cztM0_level2_quad_clean.evt |
| Size (bytes) | 516,588,480 | 92,292,480 |
| Size | 492.7 MB | 88.0 MB |
| Events in quadrant A | 3,157,024 | 594,926 |
| Events in quadrant B | 5,257,766 | 587,836 |
| Events in quadrant C | 3,361,991 | 577,801 |
| Events in quadrant D | 3,419,329 | 572,934 |
| Mode M0 | |||
|---|---|---|---|
| Quadrant | BADHDUFLAG | Total packets | Discarded packets |
| A | 0 | 13502 | 1 |
| B | 0 | 20516 | 1 |
| C | 0 | 14021 | 1 |
| D | 0 | 14242 | 1 |
| Mode SS | |||
|---|---|---|---|
| Quadrant | BADHDUFLAG | Total packets | Discarded packets |
| A | 0 | 134 | 0 |
| B | 0 | 134 | 0 |
| C | 0 | 134 | 0 |
| D | 0 | 134 | 0 |
| Mode M9 | |||
|---|---|---|---|
| Quadrant | BADHDUFLAG | Total packets | Discarded packets |
| A | 0 | 9 | 0 |
| B | 0 | 9 | 0 |
| C | 0 | 9 | 0 |
| D | 0 | 9 | 0 |
| Quadrant | Total seconds | Saturated seconds | Saturation percentage |
|---|---|---|---|
| A | 6620 | 28 | 0.422961% |
| B | 6621 | 163 | 2.461864% |
| C | 6621 | 99 | 1.495242% |
| D | 6621 | 20 | 0.302069% |
Noise dominated data is calculated using 1-second bins in cleaned event files. If a bin has >2000 counts, and if more than 50% of those come from <1% of pixels, then it is considered to be noise-dominated and hence unusable.
| Quadrant | # 1 sec bins | Bins with >0 counts | Bins with >2000 counts | High rate bins dominated by noise | Noise dominated (total time) | Noise dominated (detector-on time) | Marked lightcurve |
|---|---|---|---|---|---|---|---|
| A | 7570 | 6621 | 0 | 0 | 0.00% | 0.00% |  |
| B | 7571 | 6622 | 59 | 59 | 0.78% | 0.89% | 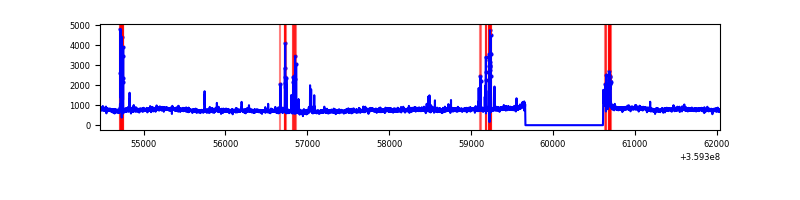 |
| C | 7571 | 6622 | 8 | 8 | 0.11% | 0.12% | 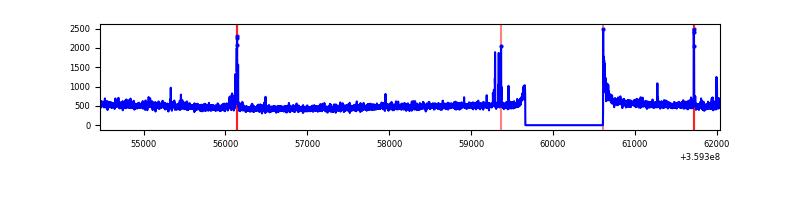 |
| D | 7571 | 6622 | 1 | 1 | 0.01% | 0.02% | 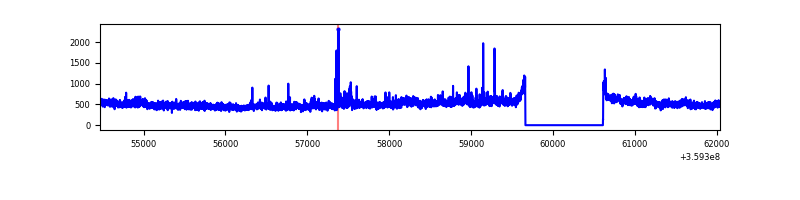 |
Top three noisy pixels from each quadrant. If the there are fewer than three noisy pixels in the level2.evt file, extra rows are filled as -1
| Pixel properties | Quadrant properties | ||||||
|---|---|---|---|---|---|---|---|
| Quadrant | DetID | PixID | Counts | Sigma | Mean | Median | Sigma |
| A | 13 | 254 | 12845 | 73.69 | 814 | 799 | 163.5 |
| A | 8 | 192 | 11265 | 64.02 | 814 | 799 | 163.5 |
| A | 3 | 137 | 8037 | 44.28 | 814 | 799 | 163.5 |
| B | 6 | 159 | 1793707 | 11617.44 | 796 | 772 | 154.3 |
| B | 4 | 171 | 159693 | 1029.74 | 796 | 772 | 154.3 |
| B | 6 | 36 | 77000 | 493.92 | 796 | 772 | 154.3 |
| C | 14 | 238 | 125526 | 673.72 | 785 | 789 | 185.1 |
| C | 10 | 22 | 81098 | 433.76 | 785 | 789 | 185.1 |
| C | 3 | 233 | 51540 | 274.11 | 785 | 789 | 185.1 |
| D | 8 | 195 | 310963 | 1625.06 | 799 | 778 | 190.9 |
| D | 13 | 104 | 50441 | 260.19 | 799 | 778 | 190.9 |
| D | 2 | 234 | 30524 | 155.84 | 799 | 778 | 190.9 |
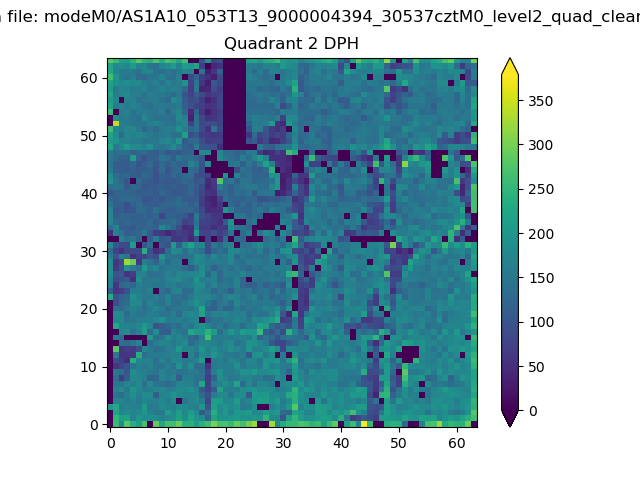
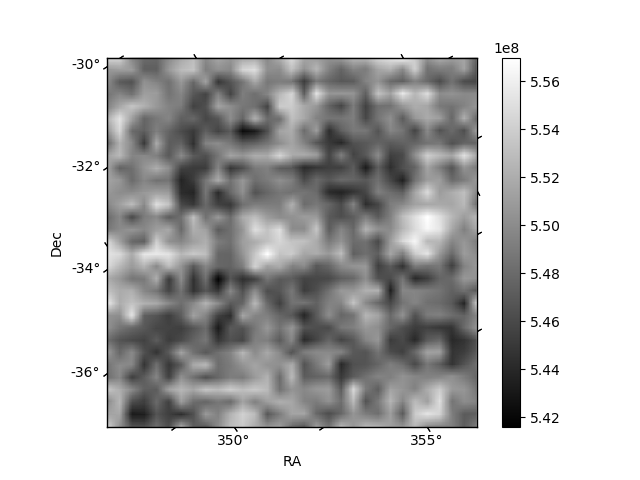
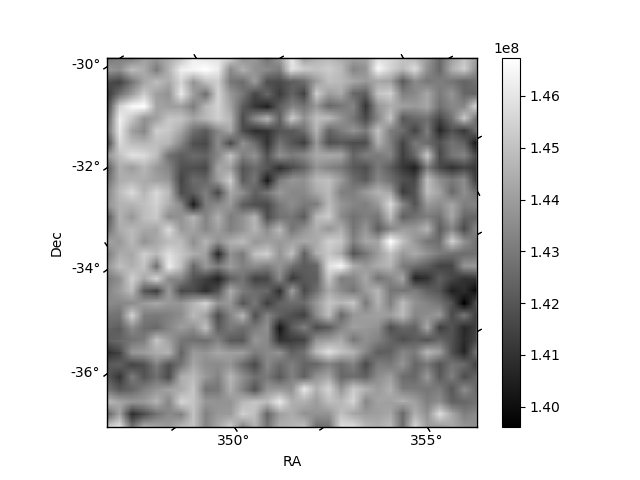
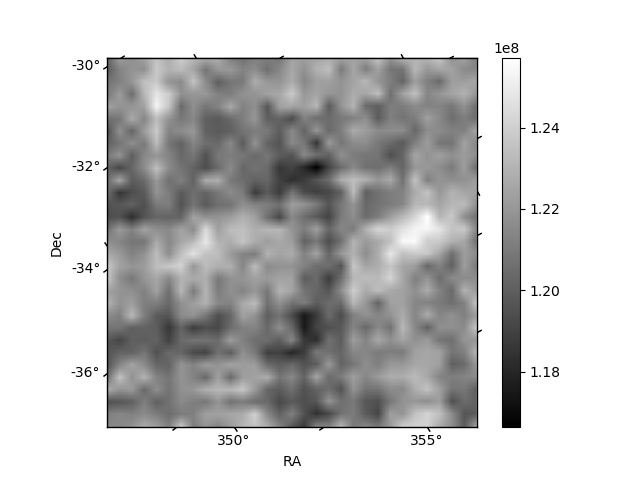
Histogram calculated using DETX and DETY for each event in the final _common_clean file
| Quadrant A | 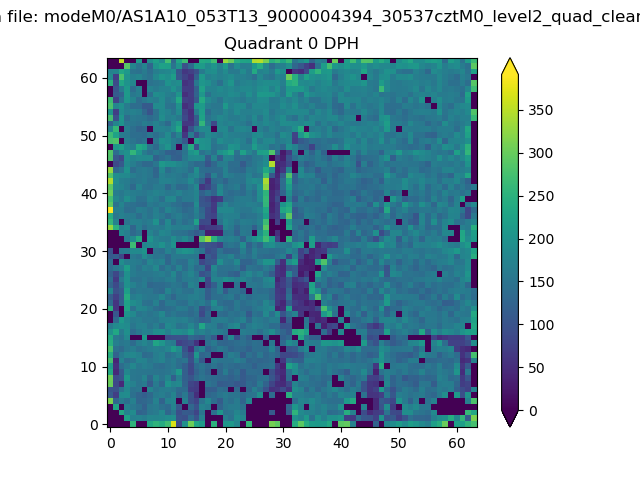 |
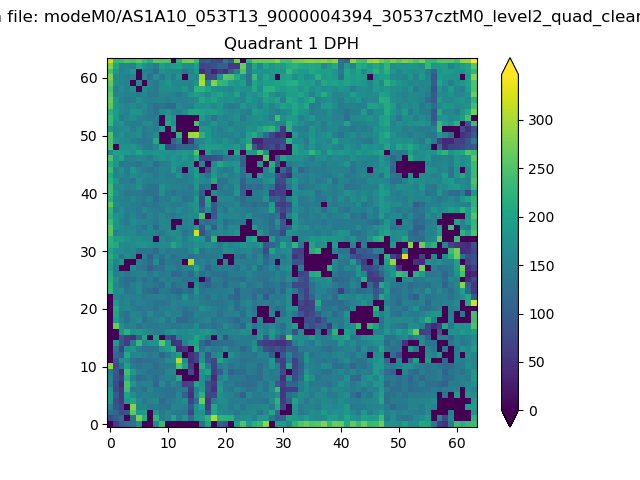 |
Quadrant B |
|---|---|---|---|
| Quadrant D | 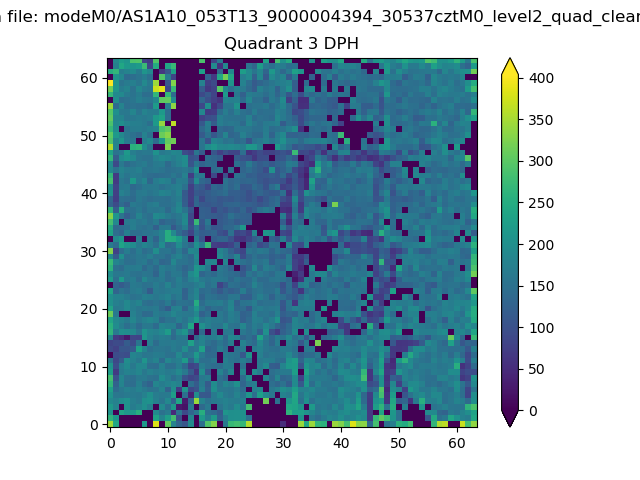 |
 |
Quadrant C |
| Plot type | Count rate plots | Images |
|---|---|---|
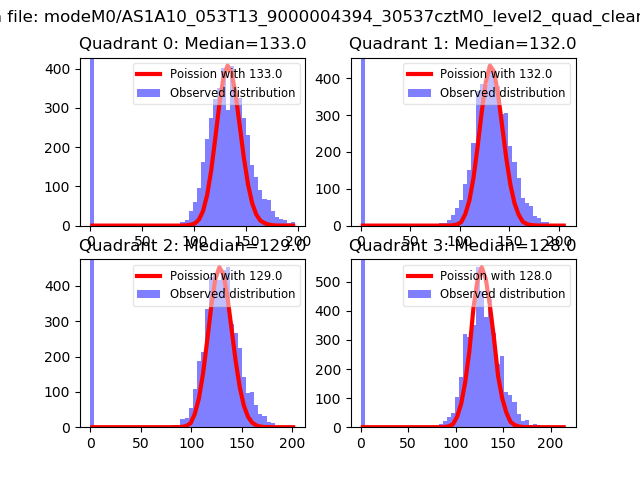
| Comparison with Poisson distribution Blue bars denote a histogram of data divided into 1 sec bins. Red curve is a Poisson curve with rate = median count rate of data. |
 |
 |
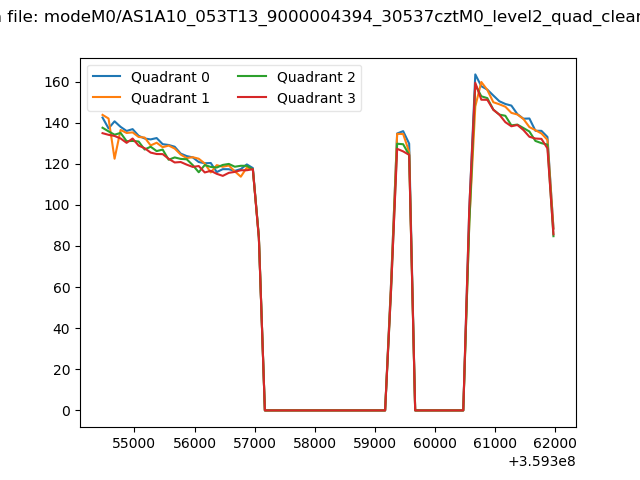
| Quadrant-wise count rates Data is divided into 100 sec bins |
 |
|
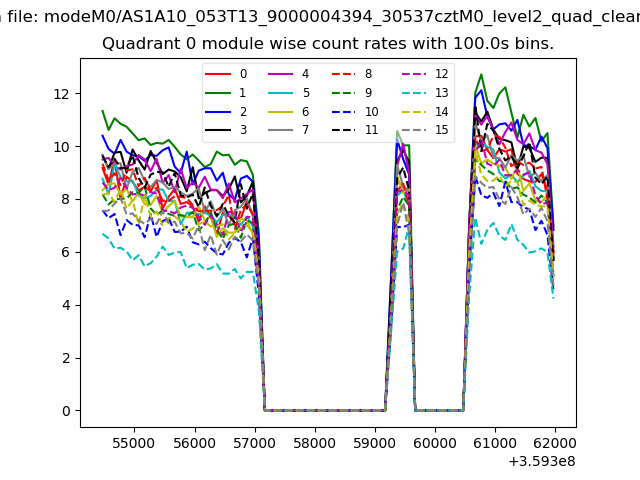
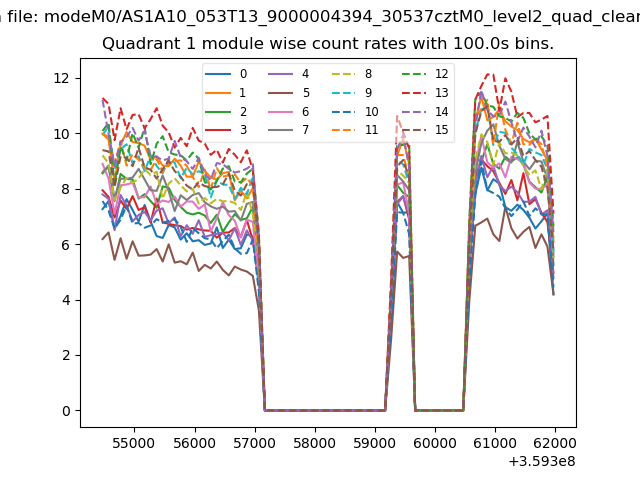
| Module-wise count rates for Quadrant A Data is divided into 100 sec bins |
 |
 |
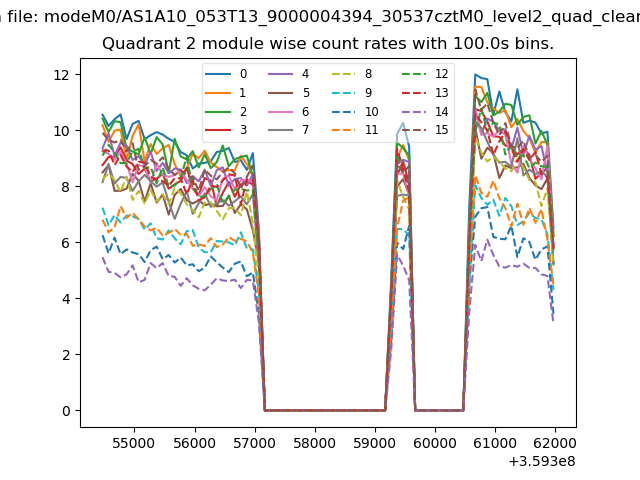
| Module-wise count rates for Quadrant B Data is divided into 100 sec bins |
 |
 |
| Module-wise count rates for Quadrant C Data is divided into 100 sec bins |
 |
 |
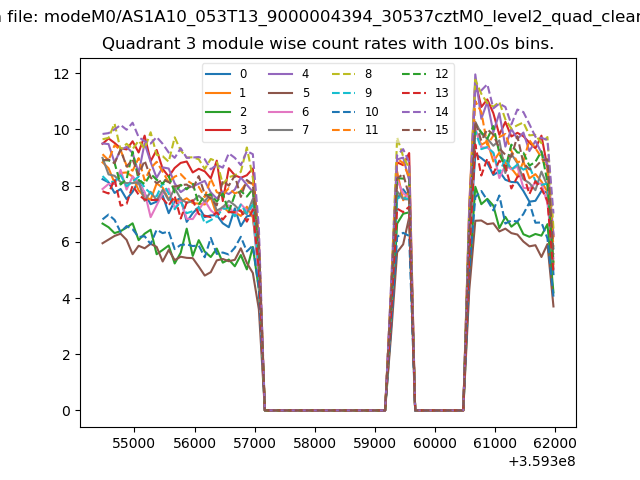
| Module-wise count rates for Quadrant D Data is divided into 100 sec bins |
 |
 |
| Parameter | Plot |
|---|---|
| CZT HV Monitor | 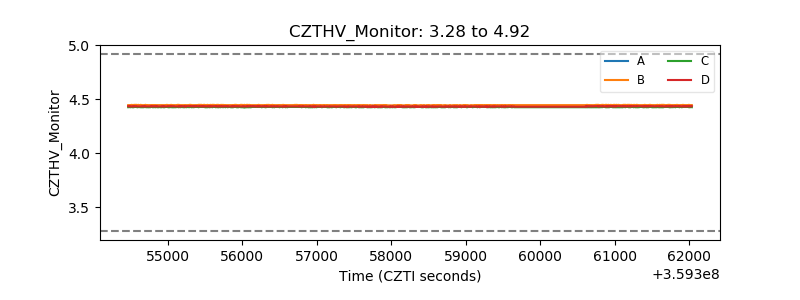 |
| D_VDD | 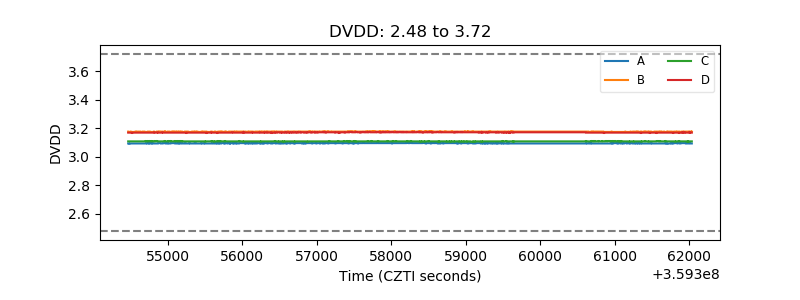 |
| Temperature 1 | 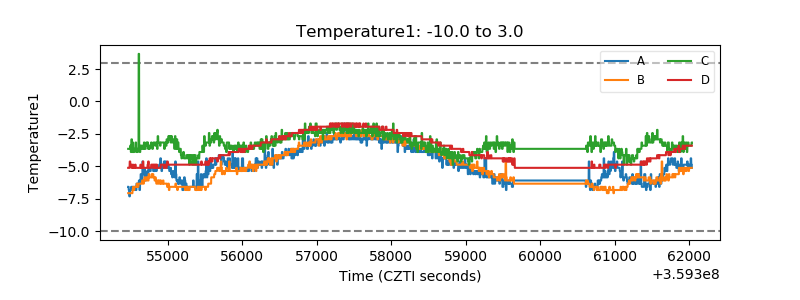 |
| Veto HV Monitor | 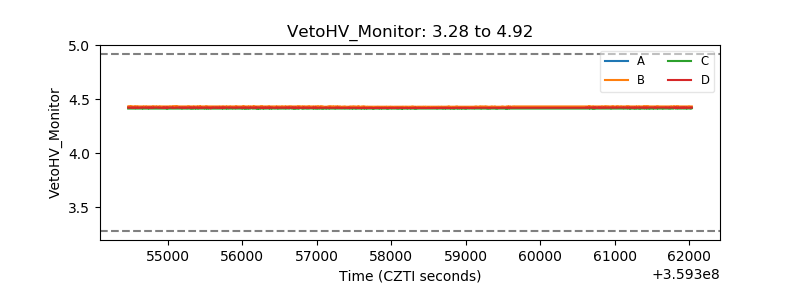 |
| Veto LLD | 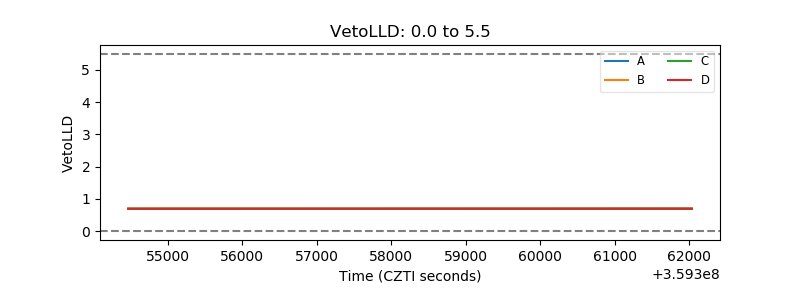 |
| Alpha Counter | 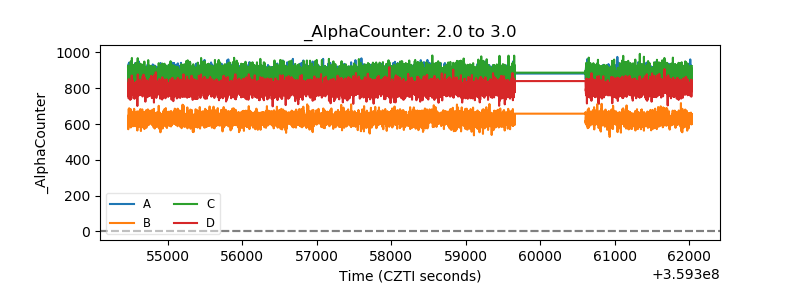 |
| _CPM_Rate | 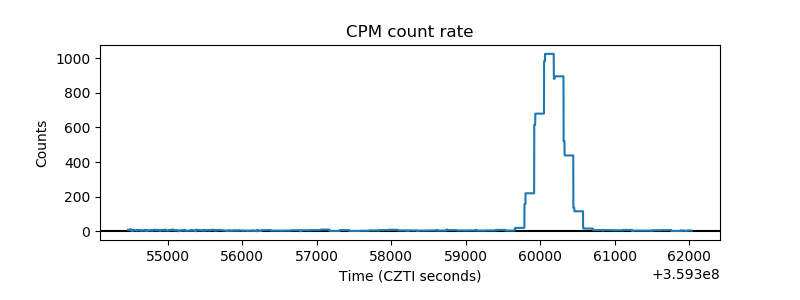 |
| CZT Counter | 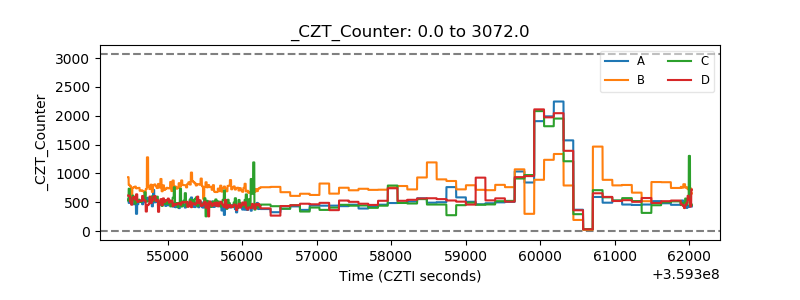 |
| +2.5 Volts monitor | 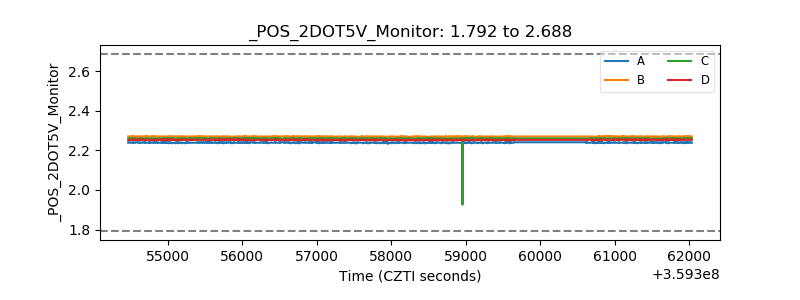 |
| +5 Volts monitor | 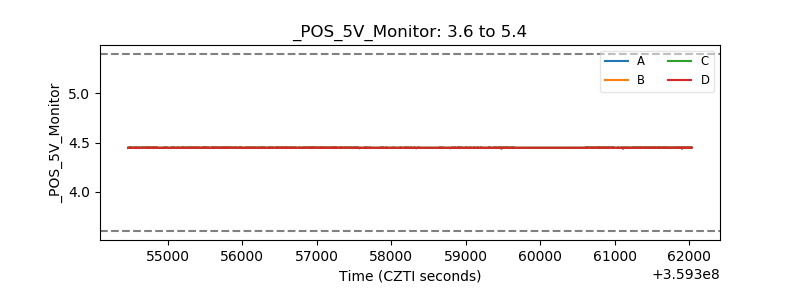 |
| _ROLL_ROT | 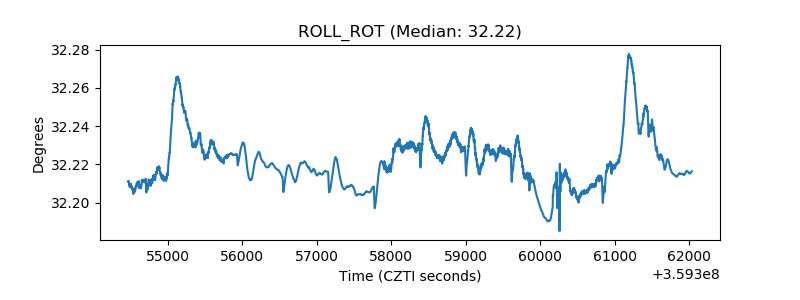 |
| _Roll_DEC | 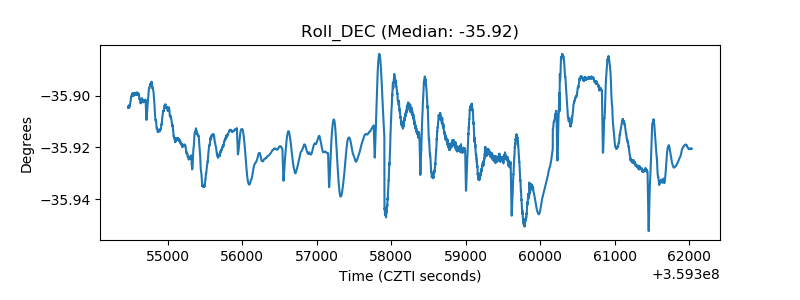 |
| _Roll_RA | 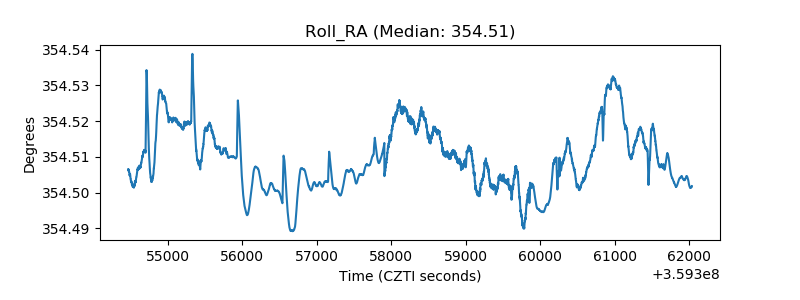 |
| Veto Counter | 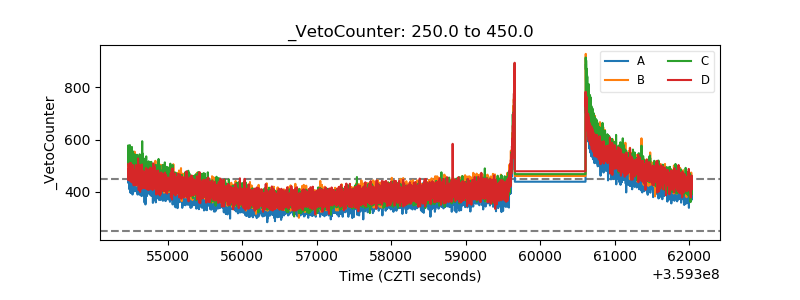 |