| Param | Original file | Final file |
|---|---|---|
| Filename | modeM0/AS1A10_053T13_9000004394_30539cztM0_level2.evt | modeM0/AS1A10_053T13_9000004394_30539cztM0_level2_quad_clean.evt |
| Size (bytes) | 557,827,200 | 101,295,360 |
| Size | 532.0 MB | 96.6 MB |
| Events in quadrant A | 3,410,085 | 667,870 |
| Events in quadrant B | 5,421,603 | 660,604 |
| Events in quadrant C | 3,995,818 | 627,891 |
| Events in quadrant D | 3,607,968 | 639,684 |
| Mode M0 | |||
|---|---|---|---|
| Quadrant | BADHDUFLAG | Total packets | Discarded packets |
| A | 0 | 14255 | 2 |
| B | 0 | 21002 | 2 |
| C | 0 | 16058 | 2 |
| D | 0 | 14754 | 2 |
| Mode SS | |||
|---|---|---|---|
| Quadrant | BADHDUFLAG | Total packets | Discarded packets |
| A | 0 | 138 | 0 |
| B | 0 | 138 | 0 |
| C | 0 | 138 | 0 |
| D | 0 | 138 | 0 |
| Mode M9 | |||
|---|---|---|---|
| Quadrant | BADHDUFLAG | Total packets | Discarded packets |
| A | 0 | 11 | 0 |
| B | 0 | 11 | 0 |
| C | 0 | 11 | 0 |
| D | 0 | 11 | 0 |
| Quadrant | Total seconds | Saturated seconds | Saturation percentage |
|---|---|---|---|
| A | 6764 | 34 | 0.502661% |
| B | 6765 | 160 | 2.365115% |
| C | 6765 | 284 | 4.198078% |
| D | 6765 | 21 | 0.310421% |
Noise dominated data is calculated using 1-second bins in cleaned event files. If a bin has >2000 counts, and if more than 50% of those come from <1% of pixels, then it is considered to be noise-dominated and hence unusable.
| Quadrant | # 1 sec bins | Bins with >0 counts | Bins with >2000 counts | High rate bins dominated by noise | Noise dominated (total time) | Noise dominated (detector-on time) | Marked lightcurve |
|---|---|---|---|---|---|---|---|
| A | 7869 | 6765 | 4 | 4 | 0.05% | 0.06% | 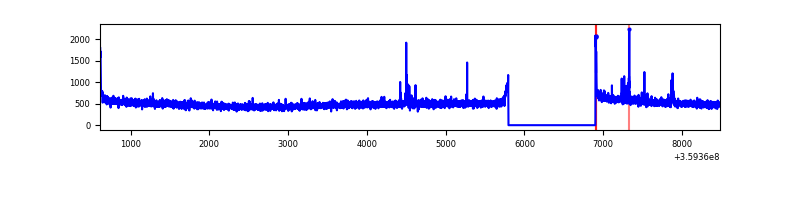 |
| B | 7870 | 6766 | 54 | 54 | 0.69% | 0.80% | 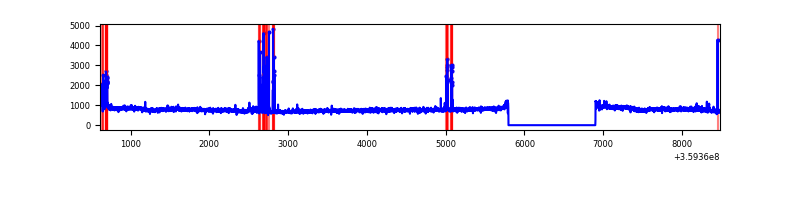 |
| C | 7870 | 6766 | 118 | 118 | 1.50% | 1.74% | 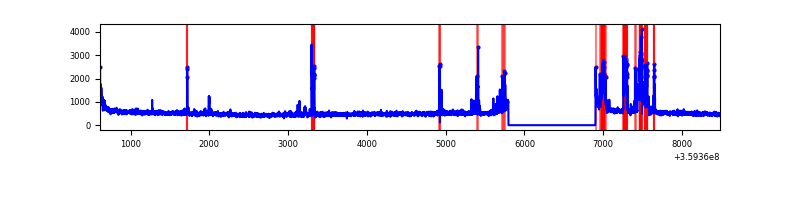 |
| D | 7870 | 6766 | 5 | 5 | 0.06% | 0.07% | 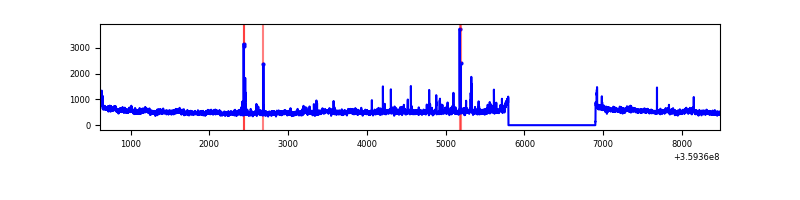 |
Top three noisy pixels from each quadrant. If the there are fewer than three noisy pixels in the level2.evt file, extra rows are filled as -1
| Pixel properties | Quadrant properties | ||||||
|---|---|---|---|---|---|---|---|
| Quadrant | DetID | PixID | Counts | Sigma | Mean | Median | Sigma |
| A | 12 | 96 | 36019 | 203.25 | 866 | 849 | 173.0 |
| A | 8 | 192 | 22205 | 123.42 | 866 | 849 | 173.0 |
| A | 13 | 254 | 12982 | 70.12 | 866 | 849 | 173.0 |
| B | 6 | 159 | 1843579 | 11456.54 | 844 | 823 | 160.8 |
| B | 4 | 171 | 138347 | 855.0 | 844 | 823 | 160.8 |
| B | 6 | 36 | 66433 | 407.9 | 844 | 823 | 160.8 |
| C | 10 | 22 | 585830 | 3090.63 | 816 | 822 | 189.3 |
| C | 14 | 238 | 131244 | 689.03 | 816 | 822 | 189.3 |
| C | 0 | 10 | 57701 | 300.49 | 816 | 822 | 189.3 |
| D | 8 | 195 | 289324 | 1453.92 | 845 | 825 | 198.4 |
| D | 13 | 104 | 37263 | 183.63 | 845 | 825 | 198.4 |
| D | 2 | 250 | 35817 | 176.35 | 845 | 825 | 198.4 |
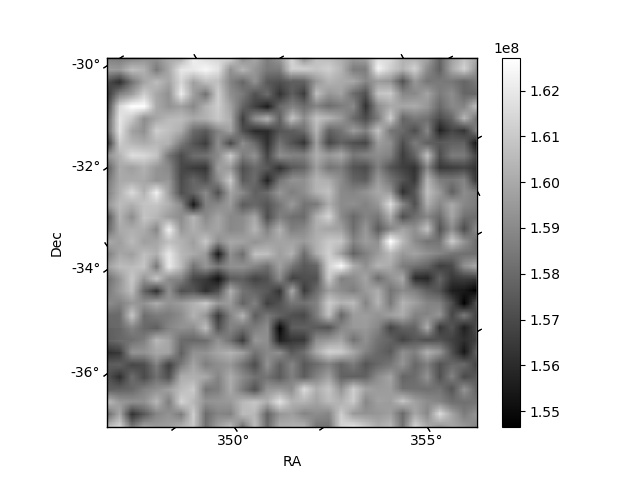
Histogram calculated using DETX and DETY for each event in the final _common_clean file
| Quadrant A | 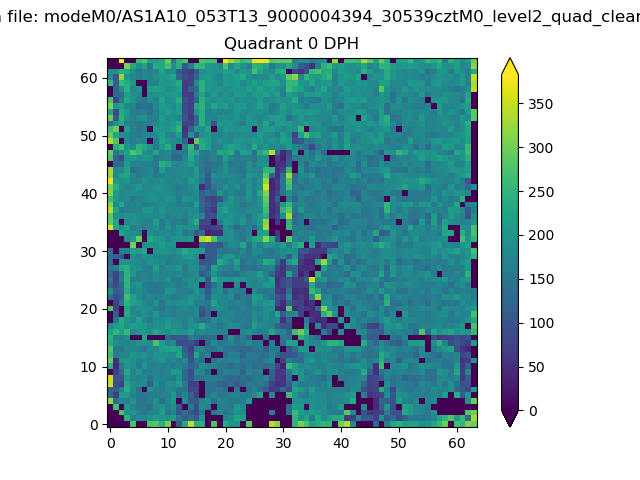 |
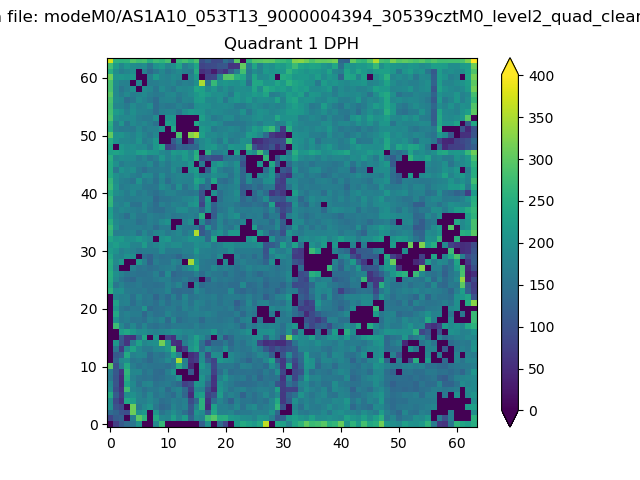 |
Quadrant B |
|---|---|---|---|
| Quadrant D | 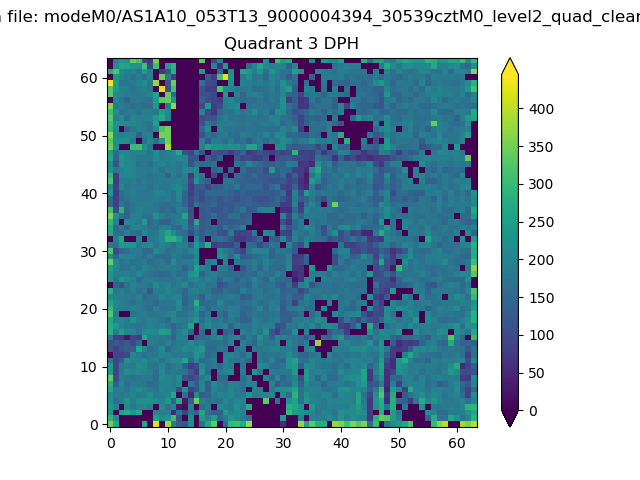 |
 |
Quadrant C |
| Plot type | Count rate plots | Images |
|---|---|---|
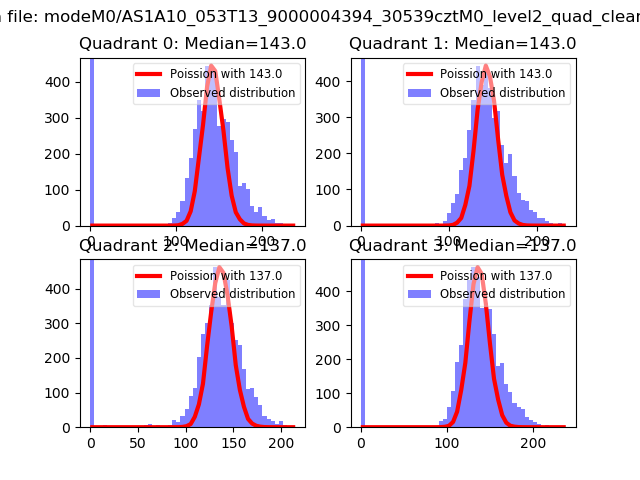
| Comparison with Poisson distribution Blue bars denote a histogram of data divided into 1 sec bins. Red curve is a Poisson curve with rate = median count rate of data. |
 |
 |
| Quadrant-wise count rates Data is divided into 100 sec bins |
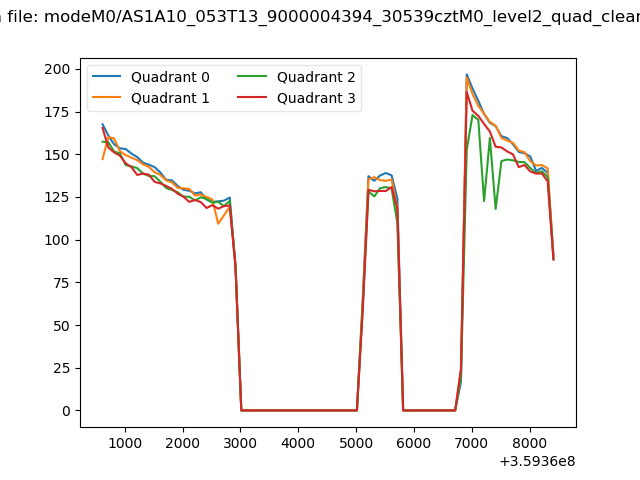 |
|
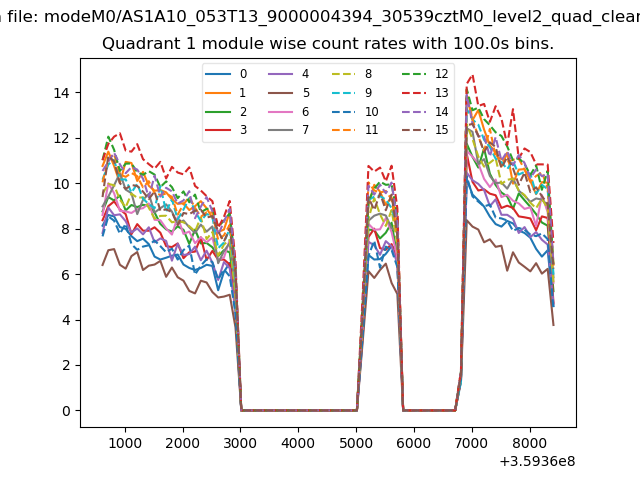
| Module-wise count rates for Quadrant A Data is divided into 100 sec bins |
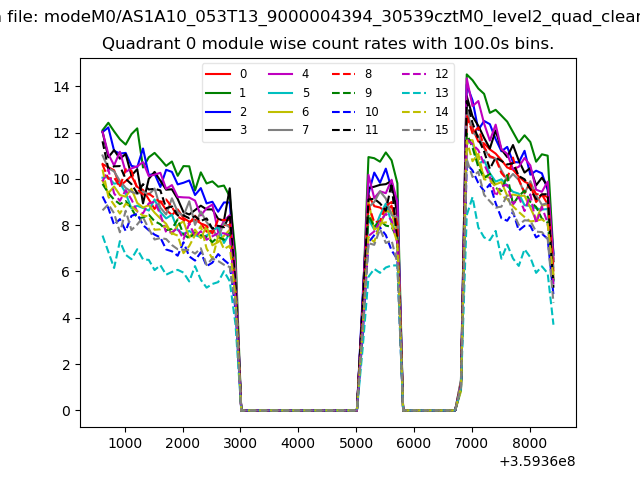 |
 |
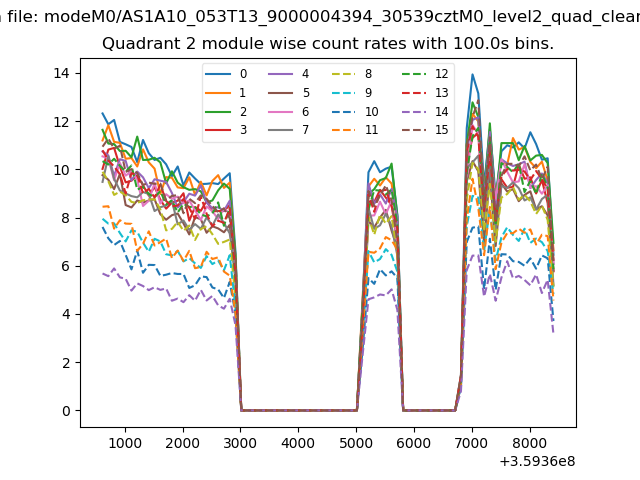
| Module-wise count rates for Quadrant B Data is divided into 100 sec bins |
 |
 |
| Module-wise count rates for Quadrant C Data is divided into 100 sec bins |
 |
 |
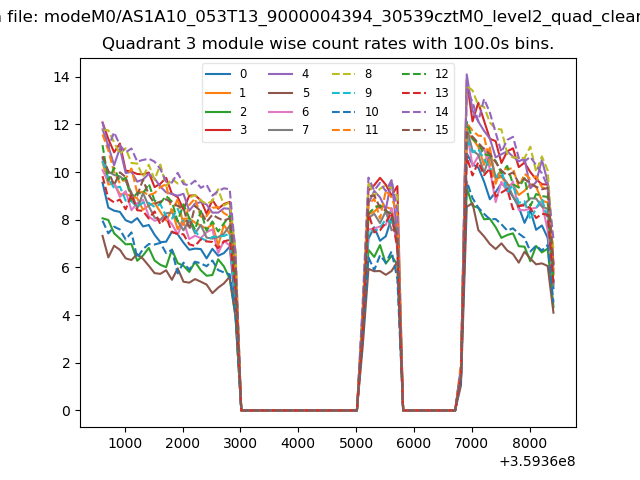
| Module-wise count rates for Quadrant D Data is divided into 100 sec bins |
 |
 |
| Parameter | Plot |
|---|---|
| CZT HV Monitor | 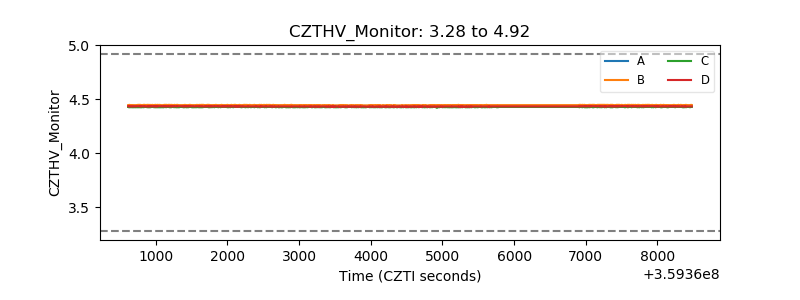 |
| D_VDD | 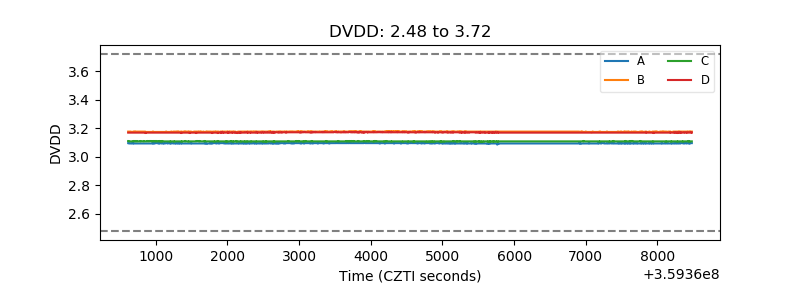 |
| Temperature 1 |  |
| Veto HV Monitor |  |
| Veto LLD |  |
| Alpha Counter | 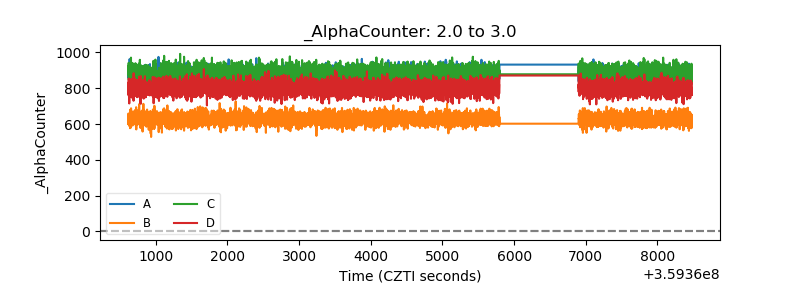 |
| _CPM_Rate | 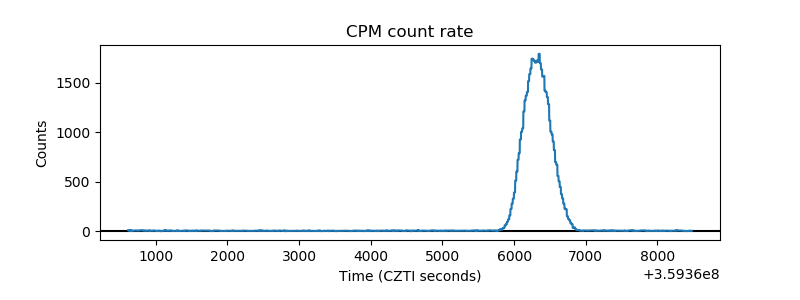 |
| CZT Counter | 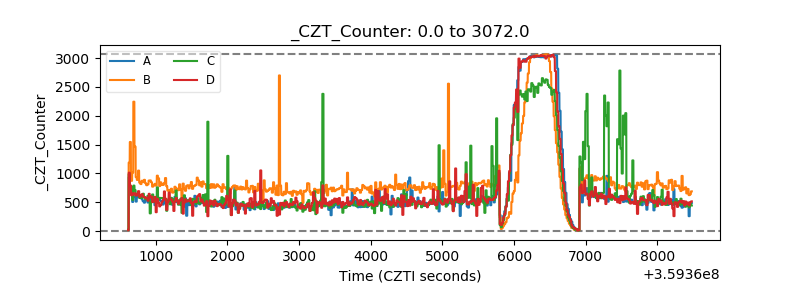 |
| +2.5 Volts monitor |  |
| +5 Volts monitor | 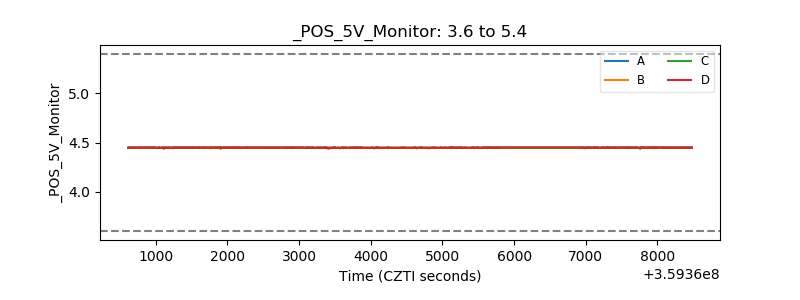 |
| _ROLL_ROT | 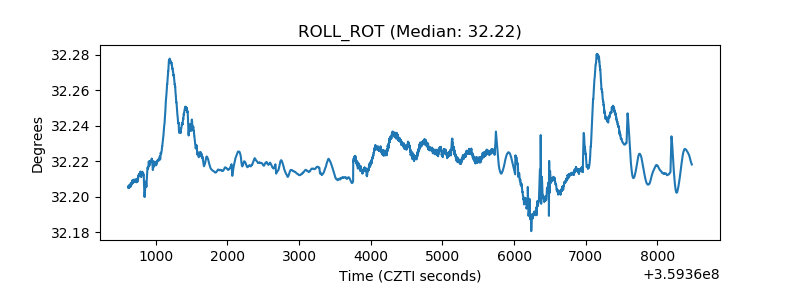 |
| _Roll_DEC | 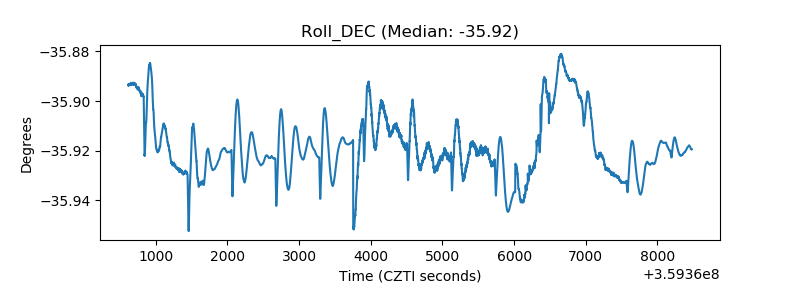 |
| _Roll_RA | 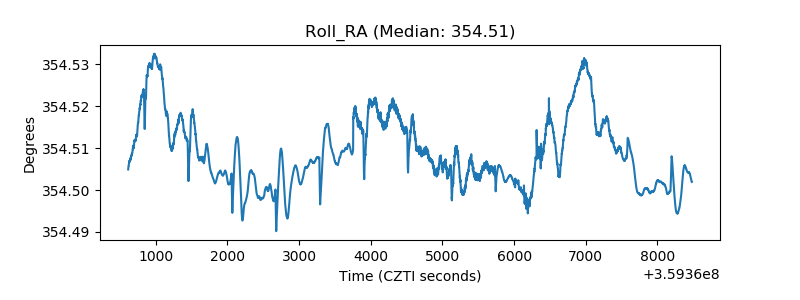 |
| Veto Counter | 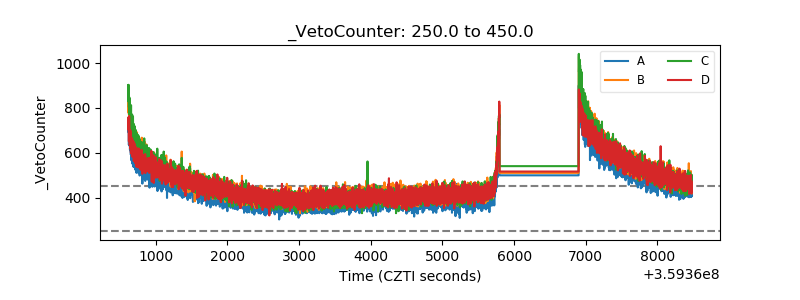 |