| Param | Original file | Final file |
|---|---|---|
| Filename | modeM0/AS1A10_053T13_9000004394_30540cztM0_level2.evt | modeM0/AS1A10_053T13_9000004394_30540cztM0_level2_quad_clean.evt |
| Size (bytes) | 497,255,040 | 90,492,480 |
| Size | 474.2 MB | 86.3 MB |
| Events in quadrant A | 3,128,923 | 598,836 |
| Events in quadrant B | 4,780,436 | 594,650 |
| Events in quadrant C | 3,467,004 | 561,015 |
| Events in quadrant D | 3,278,240 | 568,676 |
| Mode M0 | |||
|---|---|---|---|
| Quadrant | BADHDUFLAG | Total packets | Discarded packets |
| A | 0 | 12867 | 1 |
| B | 0 | 18460 | 1 |
| C | 0 | 13913 | 1 |
| D | 0 | 13257 | 1 |
| Mode SS | |||
|---|---|---|---|
| Quadrant | BADHDUFLAG | Total packets | Discarded packets |
| A | 0 | 124 | 0 |
| B | 0 | 124 | 0 |
| C | 0 | 124 | 0 |
| D | 0 | 124 | 0 |
| Mode M9 | |||
|---|---|---|---|
| Quadrant | BADHDUFLAG | Total packets | Discarded packets |
| A | 0 | 11 | 0 |
| B | 0 | 11 | 0 |
| C | 0 | 11 | 0 |
| D | 0 | 11 | 0 |
| Quadrant | Total seconds | Saturated seconds | Saturation percentage |
|---|---|---|---|
| A | 5964 | 65 | 1.089873% |
| B | 5964 | 107 | 1.794098% |
| C | 5964 | 179 | 3.001341% |
| D | 5964 | 48 | 0.804829% |
Noise dominated data is calculated using 1-second bins in cleaned event files. If a bin has >2000 counts, and if more than 50% of those come from <1% of pixels, then it is considered to be noise-dominated and hence unusable.
| Quadrant | # 1 sec bins | Bins with >0 counts | Bins with >2000 counts | High rate bins dominated by noise | Noise dominated (total time) | Noise dominated (detector-on time) | Marked lightcurve |
|---|---|---|---|---|---|---|---|
| A | 7139 | 5965 | 1 | 1 | 0.01% | 0.02% |  |
| B | 7139 | 5965 | 17 | 17 | 0.24% | 0.28% |  |
| C | 7139 | 5965 | 51 | 51 | 0.71% | 0.85% | 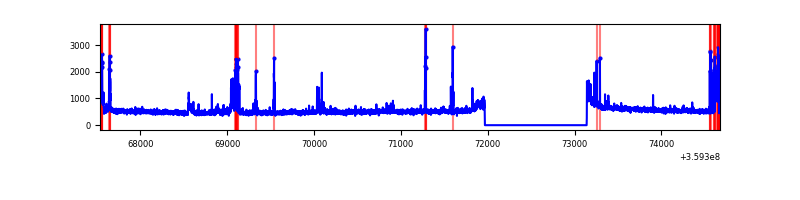 |
| D | 7139 | 5965 | 3 | 3 | 0.04% | 0.05% |  |
Top three noisy pixels from each quadrant. If the there are fewer than three noisy pixels in the level2.evt file, extra rows are filled as -1
| Pixel properties | Quadrant properties | ||||||
|---|---|---|---|---|---|---|---|
| Quadrant | DetID | PixID | Counts | Sigma | Mean | Median | Sigma |
| A | 12 | 96 | 29607 | 181.31 | 800 | 785 | 159.0 |
| A | 8 | 192 | 11802 | 69.31 | 800 | 785 | 159.0 |
| A | 13 | 254 | 11386 | 66.69 | 800 | 785 | 159.0 |
| B | 6 | 159 | 1618760 | 11101.38 | 774 | 757 | 145.7 |
| B | 4 | 171 | 62604 | 424.34 | 774 | 757 | 145.7 |
| B | 0 | 229 | 26126 | 174.06 | 774 | 757 | 145.7 |
| C | 10 | 22 | 377443 | 2166.81 | 746 | 753 | 173.8 |
| C | 14 | 238 | 126975 | 726.06 | 746 | 753 | 173.8 |
| C | 0 | 10 | 20622 | 114.29 | 746 | 753 | 173.8 |
| D | 8 | 195 | 231793 | 1267.77 | 777 | 761 | 182.2 |
| D | 13 | 104 | 30698 | 164.28 | 777 | 761 | 182.2 |
| D | 2 | 250 | 26703 | 142.36 | 777 | 761 | 182.2 |
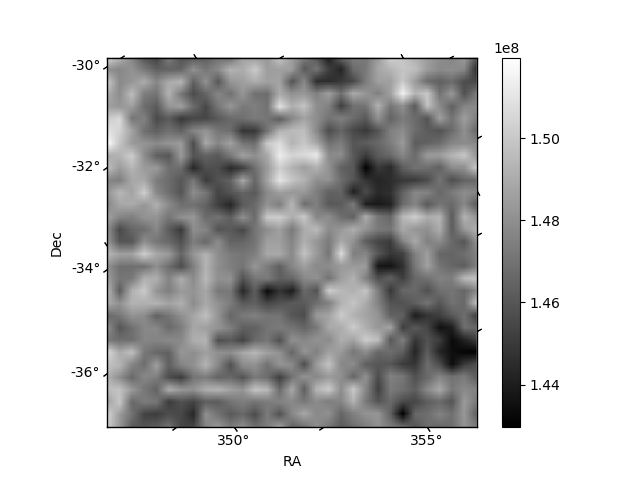
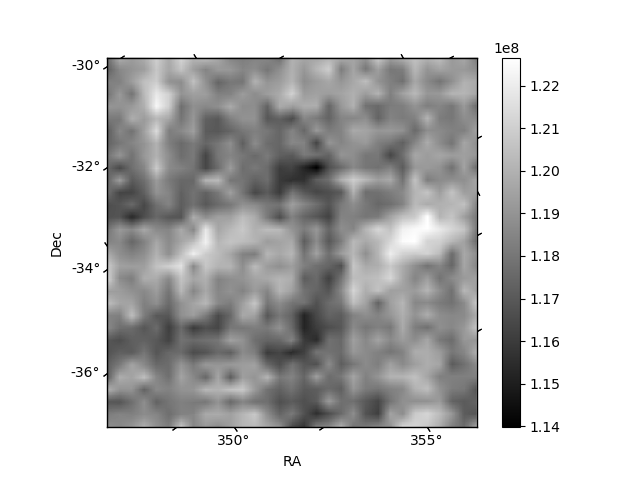
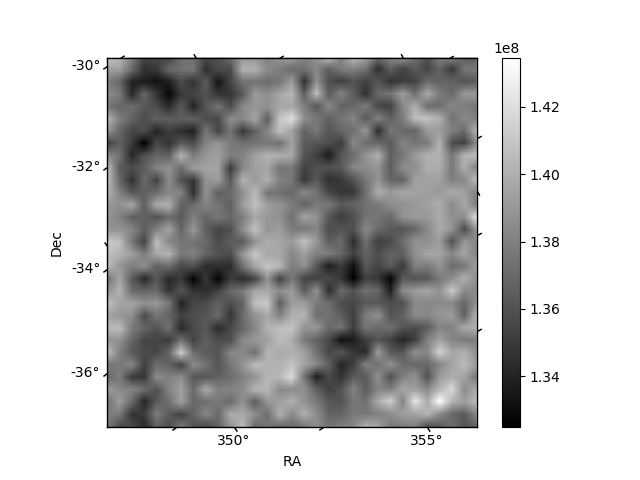
Histogram calculated using DETX and DETY for each event in the final _common_clean file
| Quadrant A | 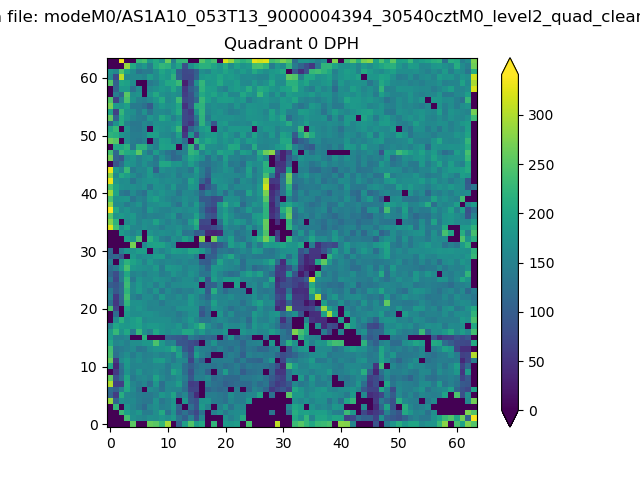 |
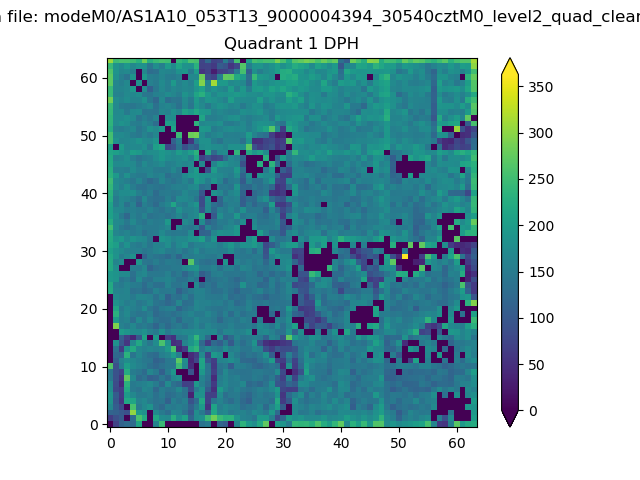 |
Quadrant B |
|---|---|---|---|
| Quadrant D | 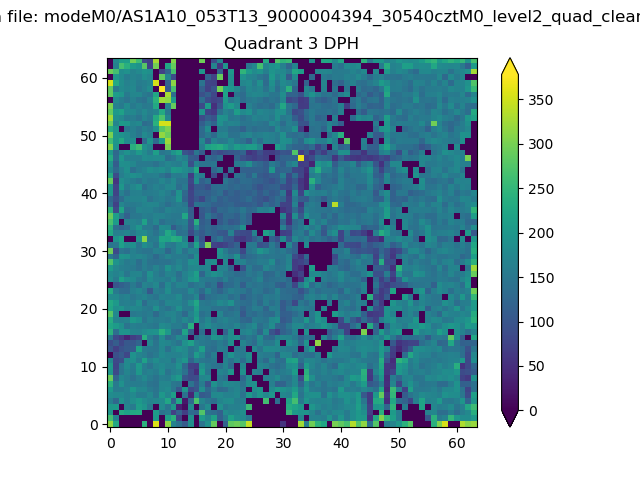 |
 |
Quadrant C |
| Plot type | Count rate plots | Images |
|---|---|---|
| Comparison with Poisson distribution Blue bars denote a histogram of data divided into 1 sec bins. Red curve is a Poisson curve with rate = median count rate of data. |
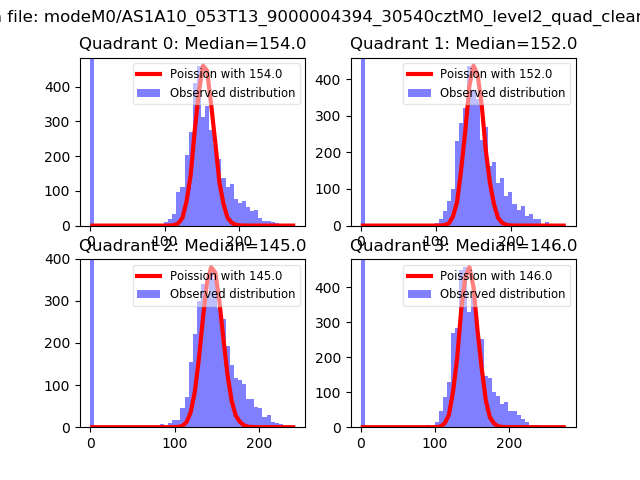 |
 |
| Quadrant-wise count rates Data is divided into 100 sec bins |
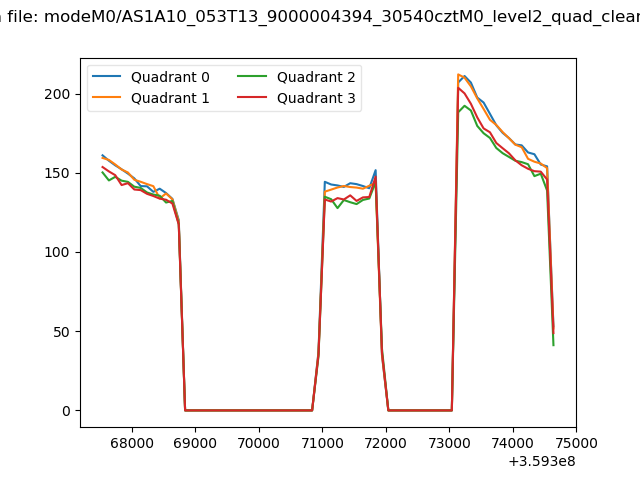 |
|
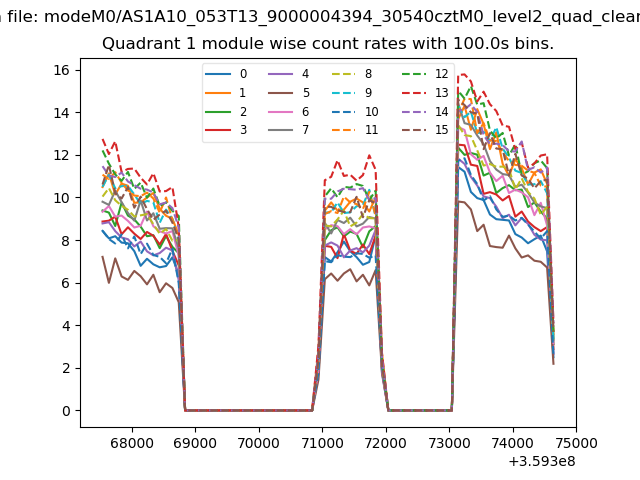
| Module-wise count rates for Quadrant A Data is divided into 100 sec bins |
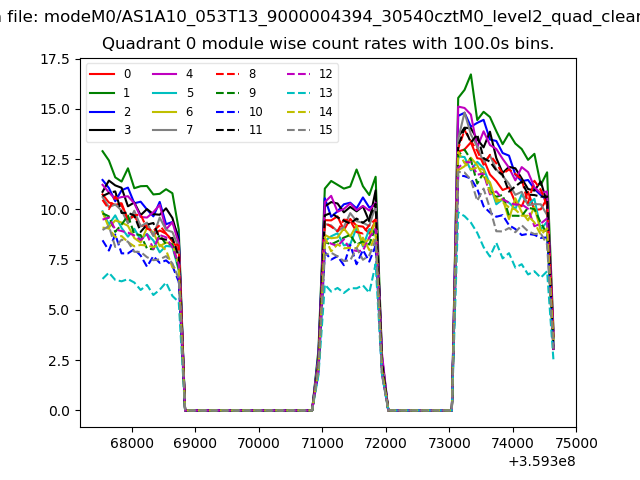 |
 |
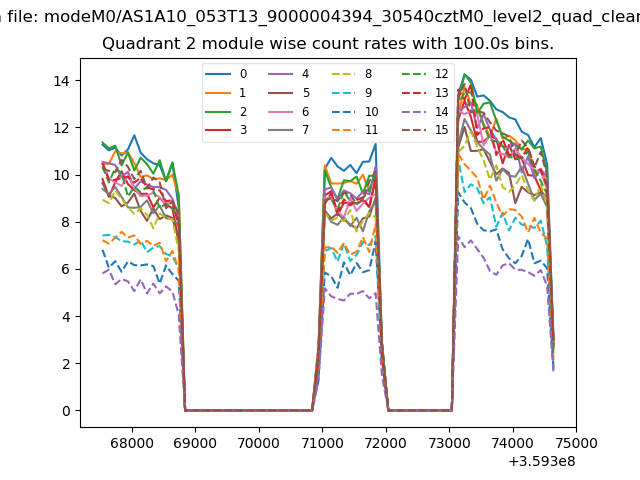
| Module-wise count rates for Quadrant B Data is divided into 100 sec bins |
 |
 |
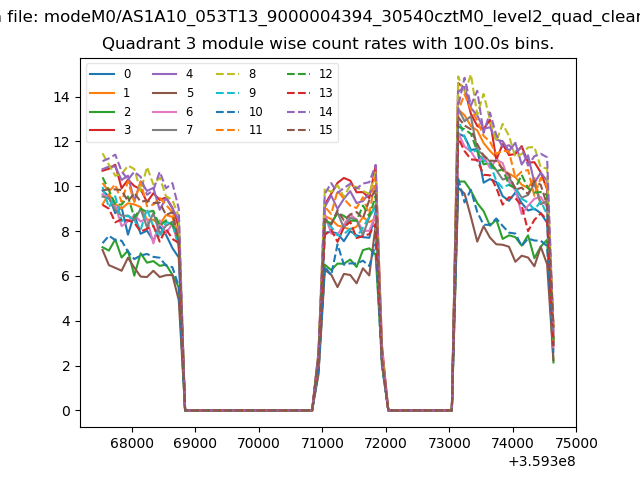
| Module-wise count rates for Quadrant C Data is divided into 100 sec bins |
 |
 |
| Module-wise count rates for Quadrant D Data is divided into 100 sec bins |
 |
 |
| Parameter | Plot |
|---|---|
| CZT HV Monitor | 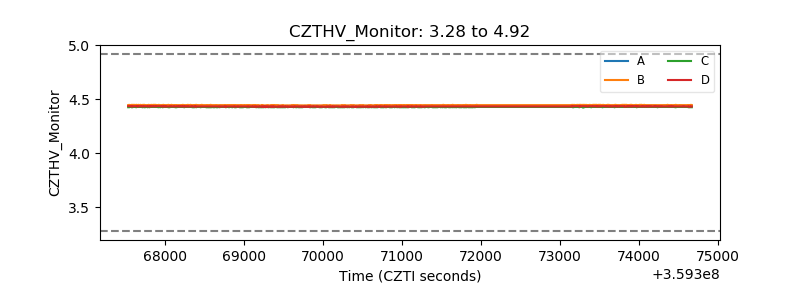 |
| D_VDD |  |
| Temperature 1 | 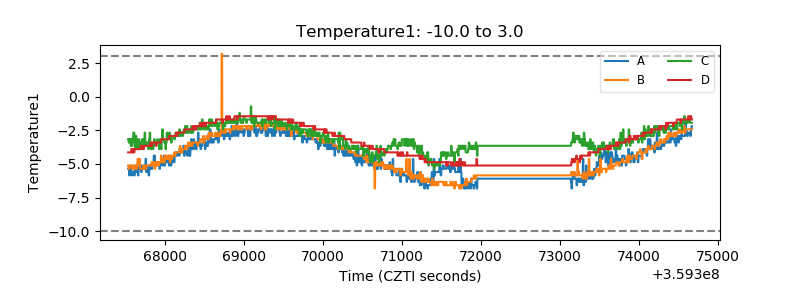 |
| Veto HV Monitor |  |
| Veto LLD | 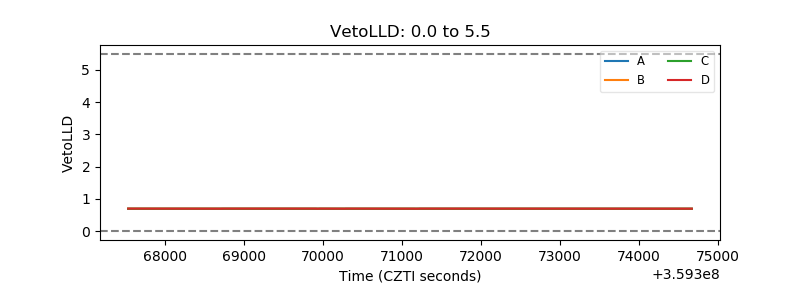 |
| Alpha Counter | 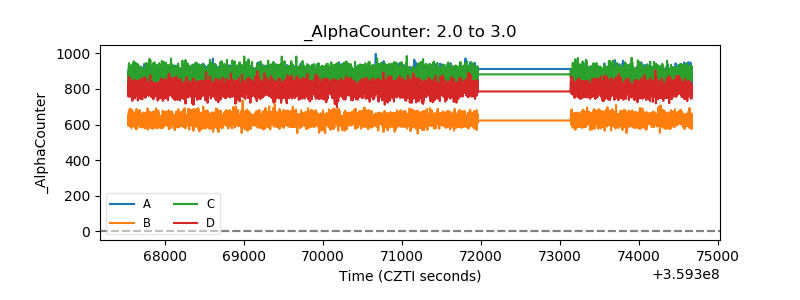 |
| _CPM_Rate | 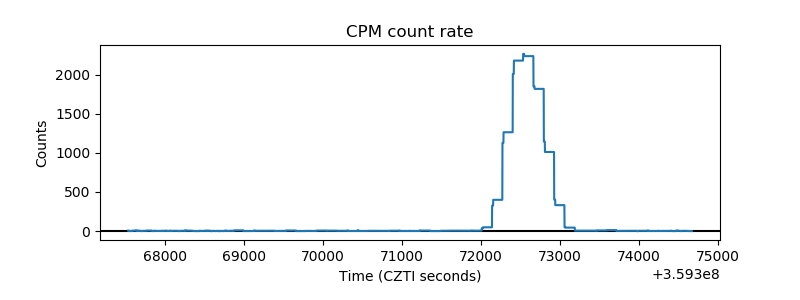 |
| CZT Counter |  |
| +2.5 Volts monitor | 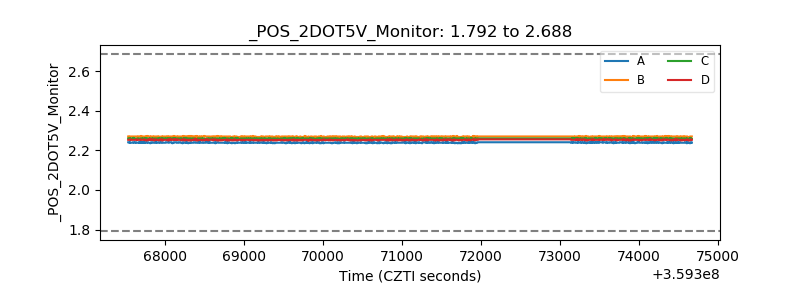 |
| +5 Volts monitor | 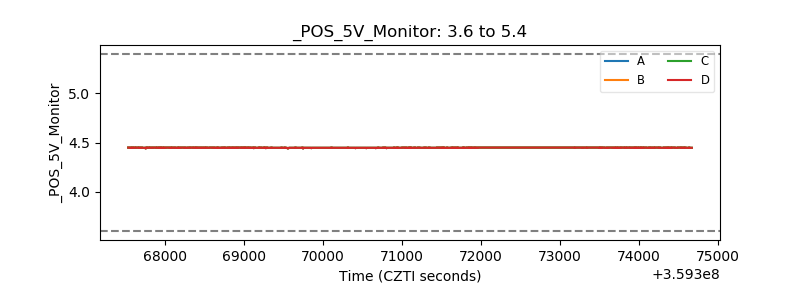 |
| _ROLL_ROT | 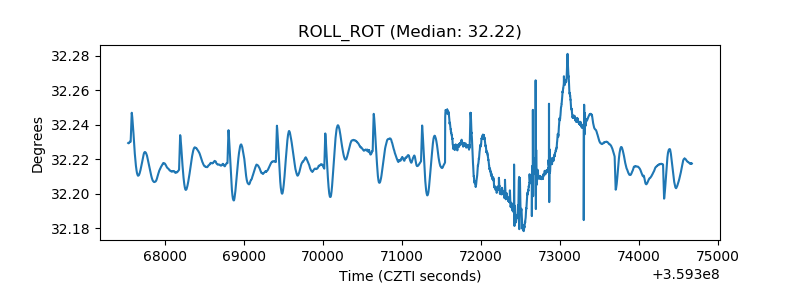 |
| _Roll_DEC | 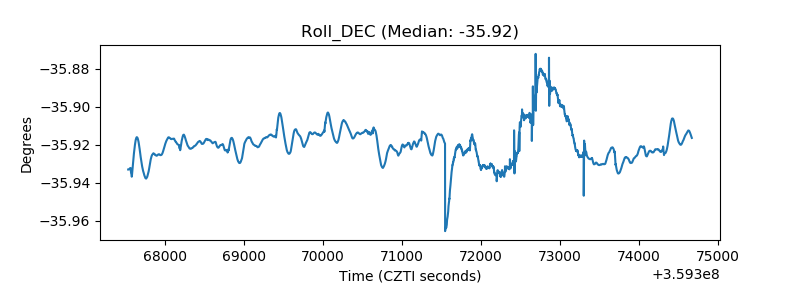 |
| _Roll_RA |  |
| Veto Counter | 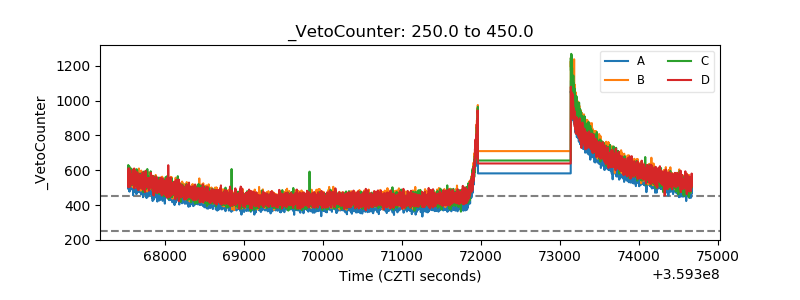 |