| Param | Original file | Final file |
|---|---|---|
| Filename | modeM0/AS1A10_053T13_9000004394_30541cztM0_level2.evt | modeM0/AS1A10_053T13_9000004394_30541cztM0_level2_quad_clean.evt |
| Size (bytes) | 349,914,240 | 48,363,840 |
| Size | 333.7 MB | 46.1 MB |
| Events in quadrant A | 2,101,784 | 305,786 |
| Events in quadrant B | 3,262,283 | 301,860 |
| Events in quadrant C | 2,722,284 | 281,485 |
| Events in quadrant D | 2,232,460 | 286,557 |
| Mode M0 | |||
|---|---|---|---|
| Quadrant | BADHDUFLAG | Total packets | Discarded packets |
| A | 0 | 8475 | 0 |
| B | 0 | 12438 | 0 |
| C | 0 | 10502 | 0 |
| D | 0 | 8903 | 0 |
| Mode SS | |||
|---|---|---|---|
| Quadrant | BADHDUFLAG | Total packets | Discarded packets |
| A | 0 | 82 | 0 |
| B | 0 | 82 | 0 |
| C | 0 | 82 | 0 |
| D | 0 | 82 | 0 |
| Quadrant | Total seconds | Saturated seconds | Saturation percentage |
|---|---|---|---|
| A | 4090 | 4 | 0.097800% |
| B | 4091 | 21 | 0.513322% |
| C | 4091 | 181 | 4.424346% |
| D | 4091 | 6 | 0.146663% |
Noise dominated data is calculated using 1-second bins in cleaned event files. If a bin has >2000 counts, and if more than 50% of those come from <1% of pixels, then it is considered to be noise-dominated and hence unusable.
| Quadrant | # 1 sec bins | Bins with >0 counts | Bins with >2000 counts | High rate bins dominated by noise | Noise dominated (total time) | Noise dominated (detector-on time) | Marked lightcurve |
|---|---|---|---|---|---|---|---|
| A | 4090 | 4090 | 0 | 0 | 0.00% | 0.00% | 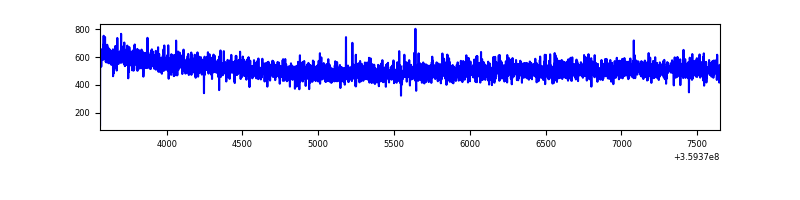 |
| B | 4091 | 4091 | 6 | 6 | 0.15% | 0.15% | 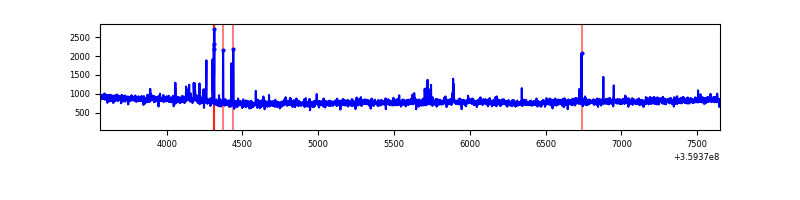 |
| C | 4091 | 4091 | 97 | 97 | 2.37% | 2.37% | 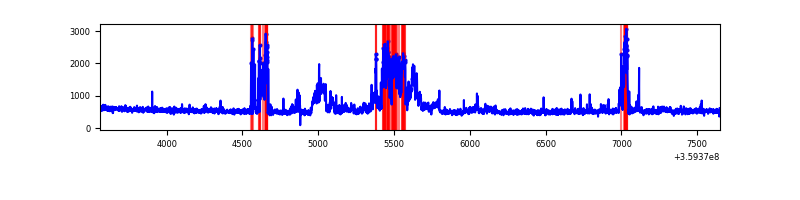 |
| D | 4091 | 4091 | 6 | 6 | 0.15% | 0.15% | 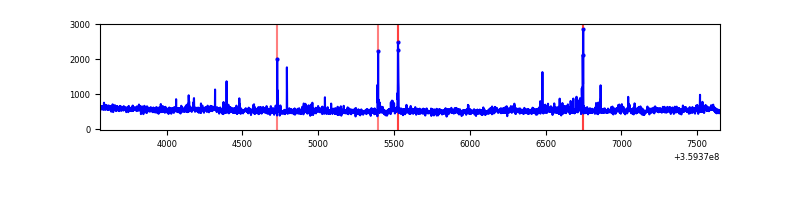 |
Top three noisy pixels from each quadrant. If the there are fewer than three noisy pixels in the level2.evt file, extra rows are filled as -1
| Pixel properties | Quadrant properties | ||||||
|---|---|---|---|---|---|---|---|
| Quadrant | DetID | PixID | Counts | Sigma | Mean | Median | Sigma |
| A | 13 | 254 | 7433 | 62.92 | 544 | 535 | 109.6 |
| A | 3 | 137 | 5171 | 42.28 | 544 | 535 | 109.6 |
| A | 0 | 226 | 4572 | 36.82 | 544 | 535 | 109.6 |
| B | 6 | 159 | 1125788 | 11251.49 | 528 | 516 | 100.0 |
| B | 4 | 171 | 23013 | 224.95 | 528 | 516 | 100.0 |
| B | 6 | 36 | 16661 | 161.43 | 528 | 516 | 100.0 |
| C | 10 | 22 | 612000 | 5254.11 | 498 | 501 | 116.4 |
| C | 14 | 238 | 95778 | 818.64 | 498 | 501 | 116.4 |
| C | 3 | 233 | 43528 | 369.7 | 498 | 501 | 116.4 |
| D | 8 | 195 | 161714 | 1290.32 | 523 | 511 | 124.9 |
| D | 2 | 250 | 50204 | 397.76 | 523 | 511 | 124.9 |
| D | 2 | 234 | 19934 | 155.47 | 523 | 511 | 124.9 |
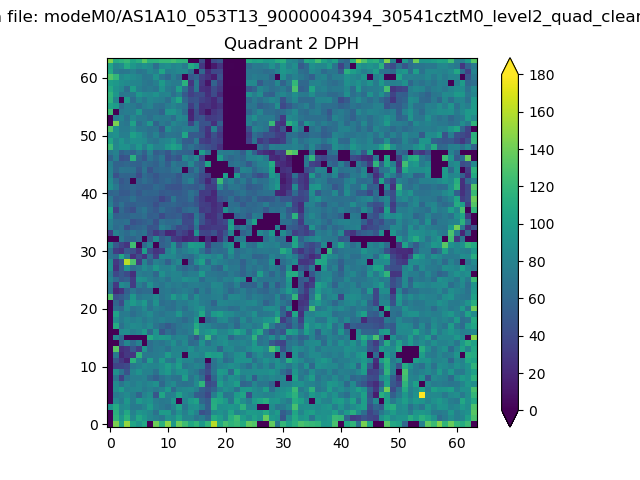
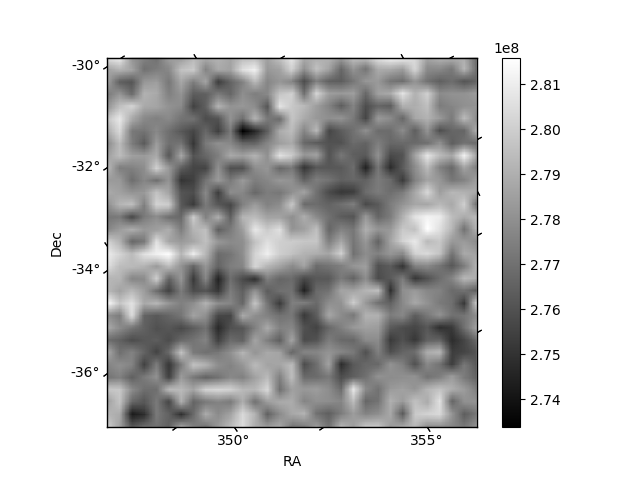
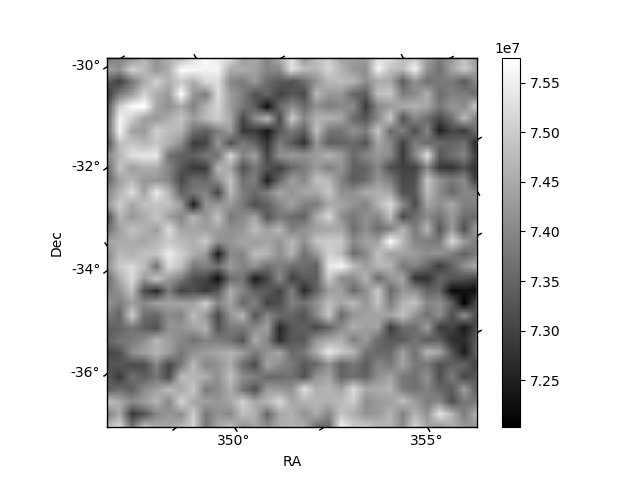
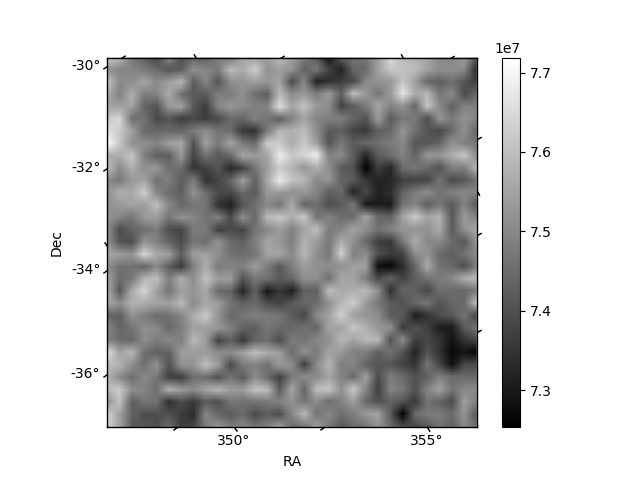
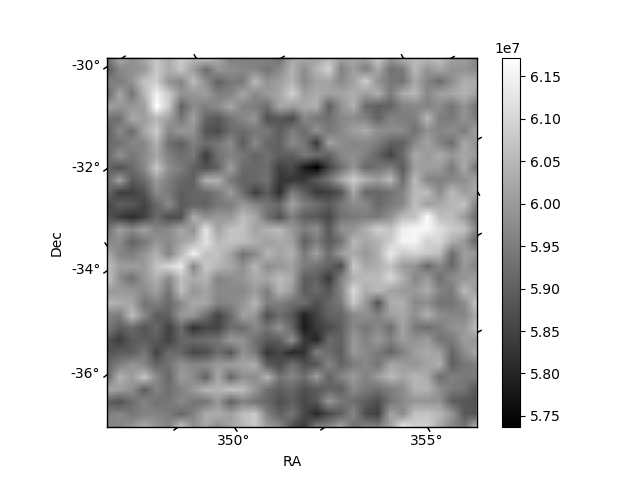
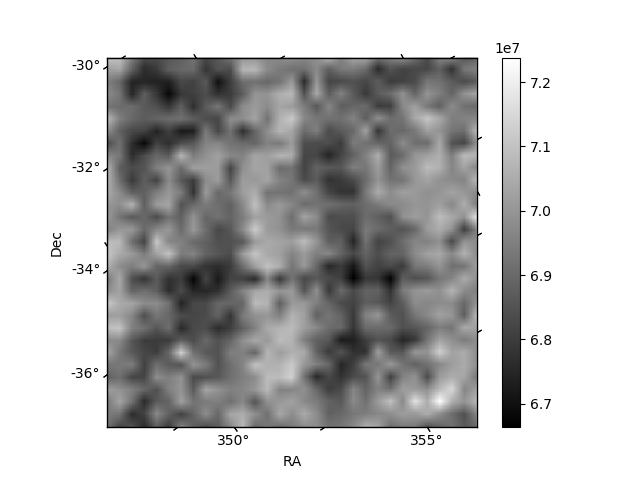
Histogram calculated using DETX and DETY for each event in the final _common_clean file
| Quadrant A | 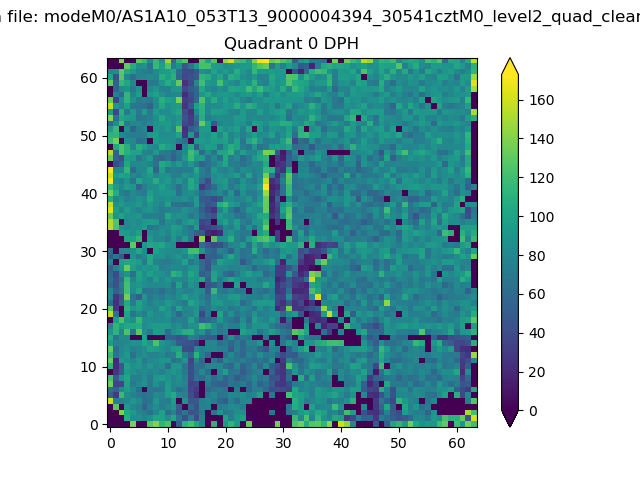 |
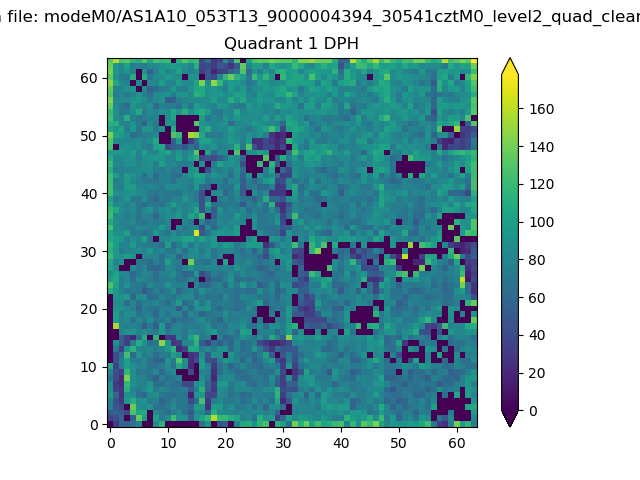 |
Quadrant B |
|---|---|---|---|
| Quadrant D | 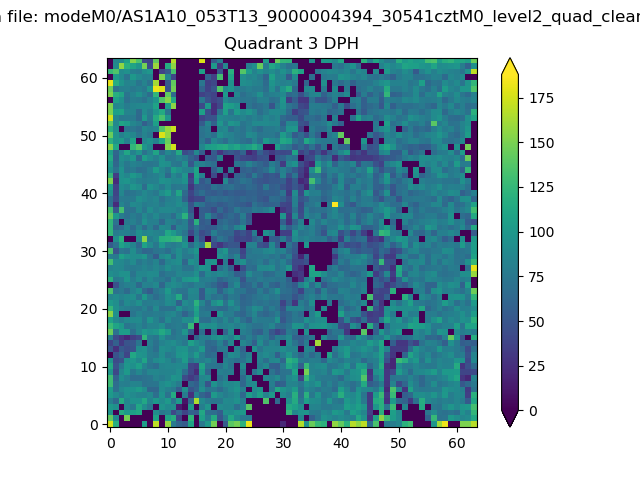 |
 |
Quadrant C |
| Plot type | Count rate plots | Images |
|---|---|---|
| Comparison with Poisson distribution Blue bars denote a histogram of data divided into 1 sec bins. Red curve is a Poisson curve with rate = median count rate of data. |
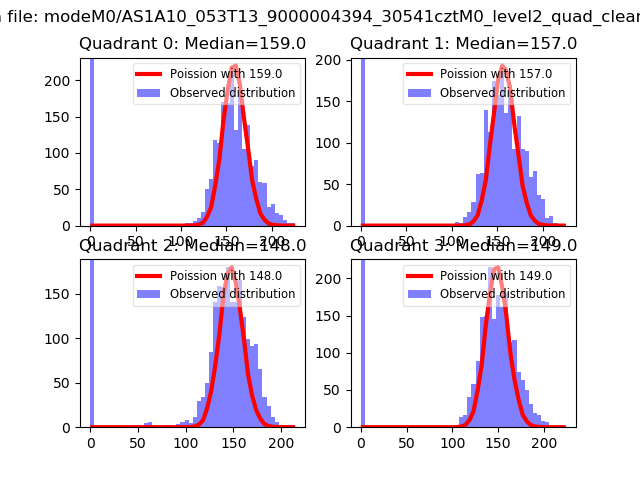 |
 |
| Quadrant-wise count rates Data is divided into 100 sec bins |
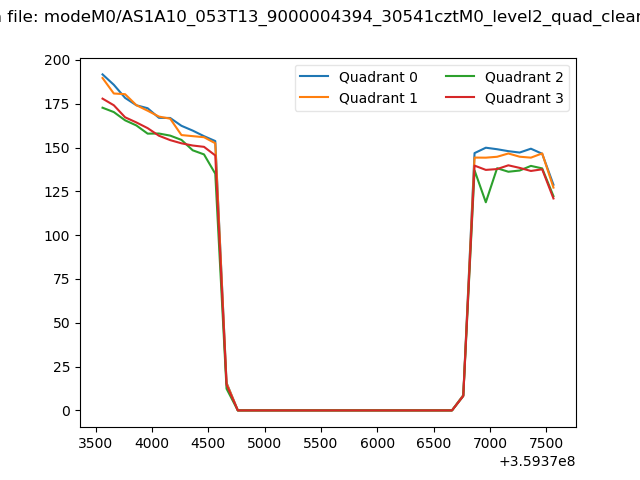 |
|
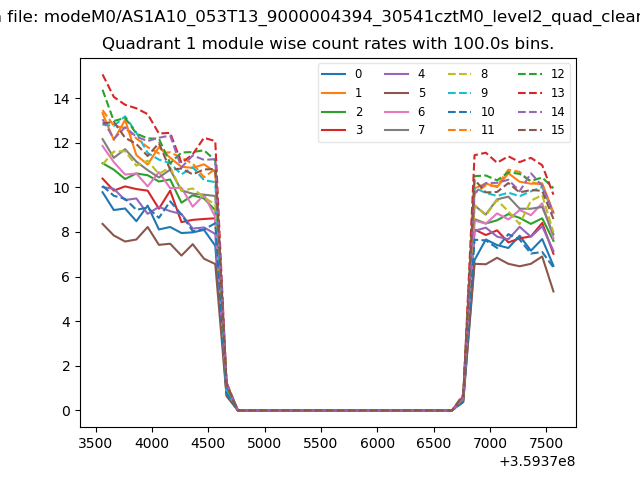
| Module-wise count rates for Quadrant A Data is divided into 100 sec bins |
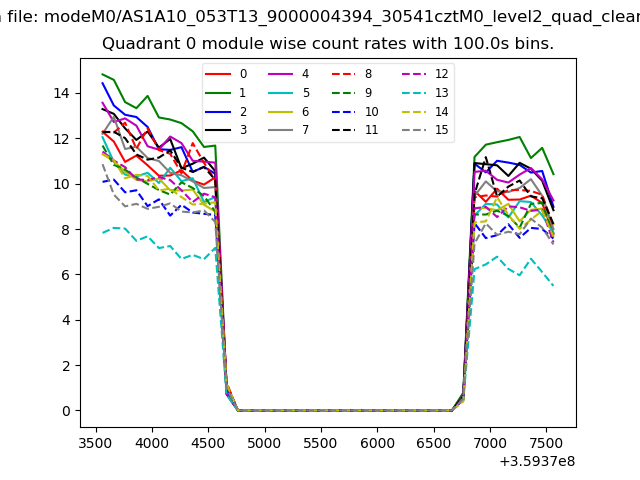 |
 |
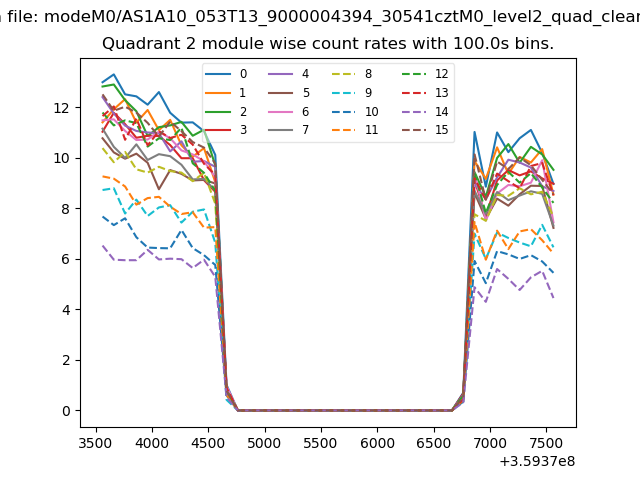
| Module-wise count rates for Quadrant B Data is divided into 100 sec bins |
 |
 |
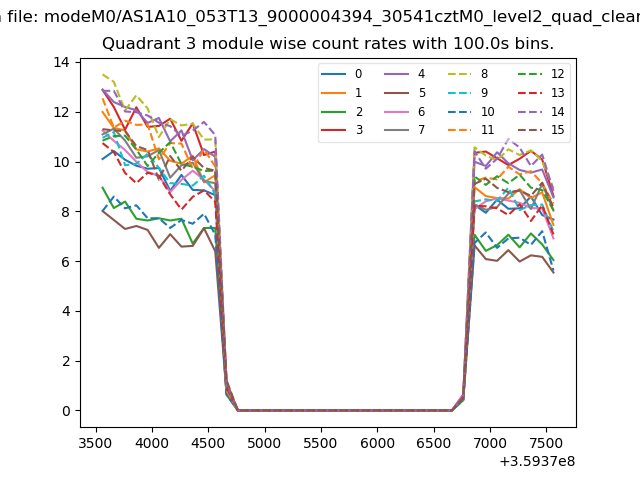
| Module-wise count rates for Quadrant C Data is divided into 100 sec bins |
 |
 |
| Module-wise count rates for Quadrant D Data is divided into 100 sec bins |
 |
 |
| Parameter | Plot |
|---|---|
| CZT HV Monitor | 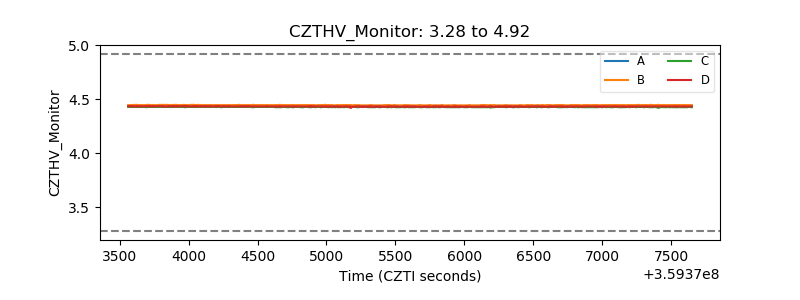 |
| D_VDD | 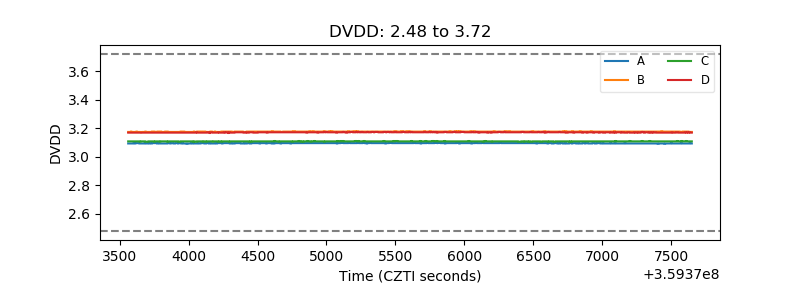 |
| Temperature 1 | 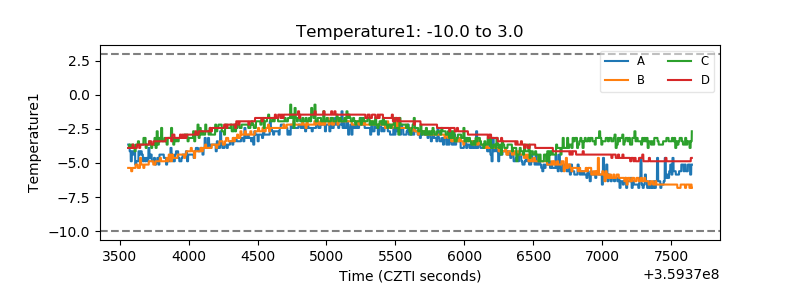 |
| Veto HV Monitor | 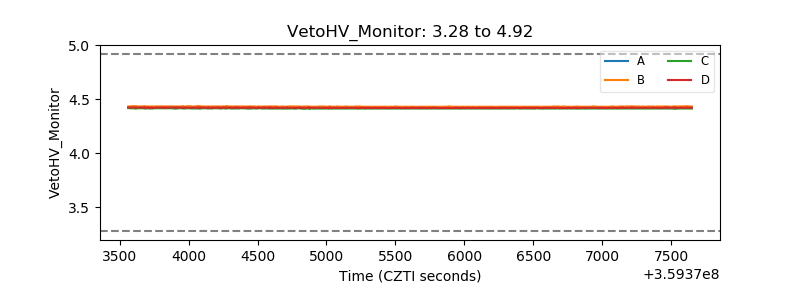 |
| Veto LLD |  |
| Alpha Counter | 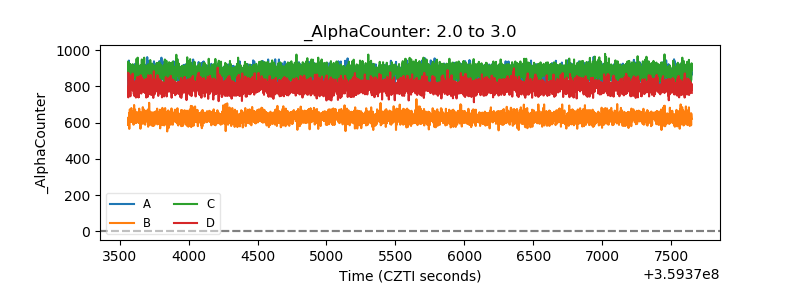 |
| _CPM_Rate | 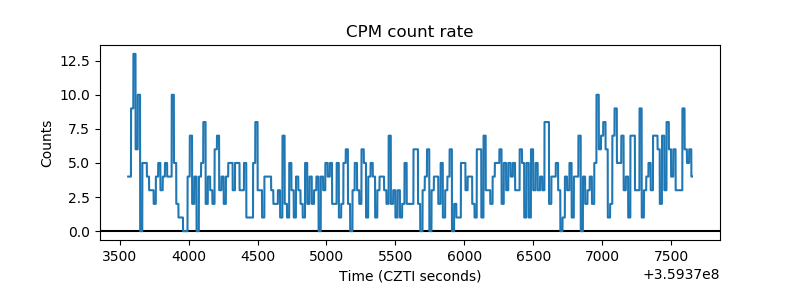 |
| CZT Counter | 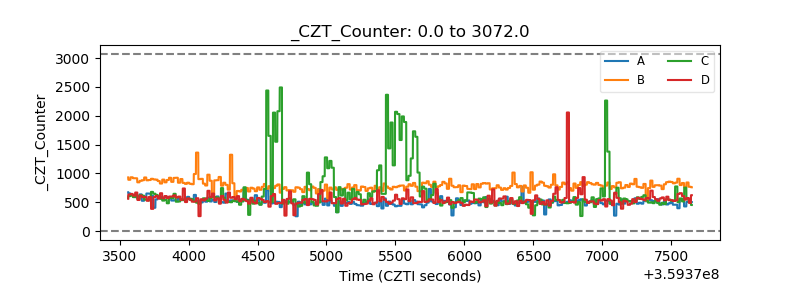 |
| +2.5 Volts monitor |  |
| +5 Volts monitor |  |
| _ROLL_ROT | 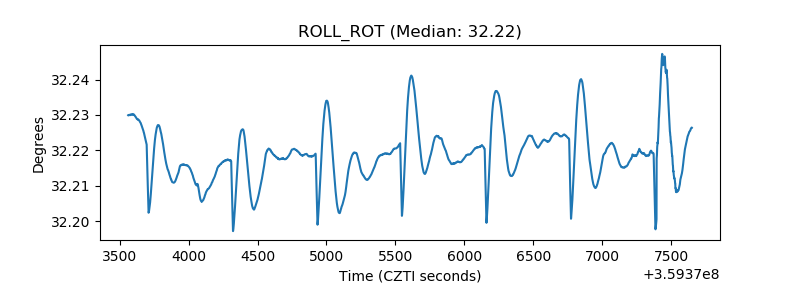 |
| _Roll_DEC | 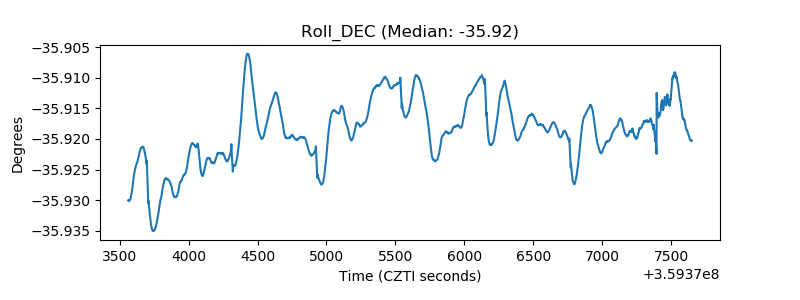 |
| _Roll_RA | 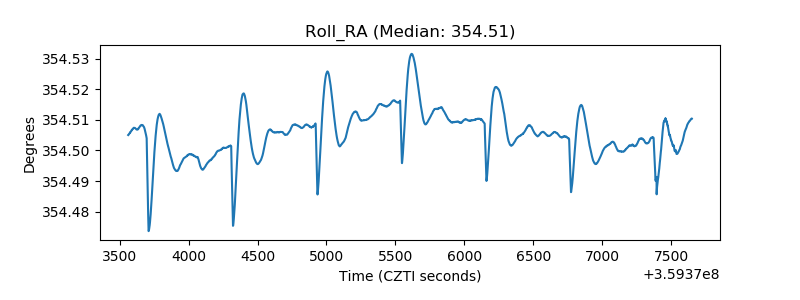 |
| Veto Counter | 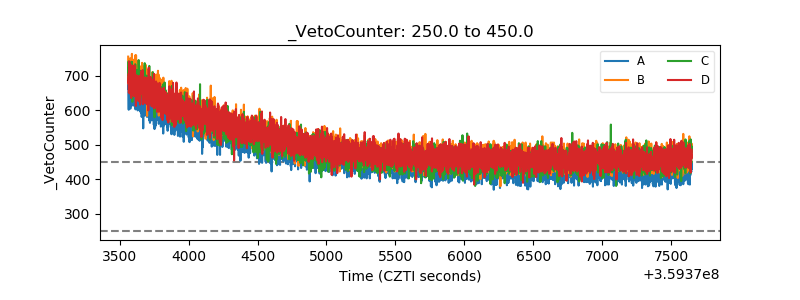 |