| Param | Original file | Final file |
|---|---|---|
| Filename | modeM0/AS1A10_053T14_9000004390cztM0_level2.fits | modeM0/AS1A10_053T14_9000004390cztM0_level2_quad_clean.evt |
| Size (bytes) | 292,199,040 | 123,661,440 |
| Size | 278.7 MB | 117.9 MB |
| Events in quadrant A | 1,891,122 | 503,550 |
| Events in quadrant B | 1,753,692 | 484,986 |
| Events in quadrant C | 1,738,116 | 461,511 |
| Events in quadrant D | 1,613,958 | 439,898 |
| Mode M9 | |||
|---|---|---|---|
| Quadrant | BADHDUFLAG | Total packets | Discarded packets |
| A | 0 | 60 | 0 |
| B | 0 | 60 | 0 |
| C | 0 | 60 | 0 |
| D | 0 | 60 | 0 |
| Mode M0 | |||
|---|---|---|---|
| Quadrant | BADHDUFLAG | Total packets | Discarded packets |
| A | 0 | 59927 | 0 |
| B | 0 | 86066 | 0 |
| C | 0 | 69284 | 0 |
| D | 0 | 66018 | 0 |
| Mode SS | |||
|---|---|---|---|
| Quadrant | BADHDUFLAG | Total packets | Discarded packets |
| A | 0 | 548 | 0 |
| B | 0 | 548 | 0 |
| C | 0 | 548 | 0 |
| D | 0 | 548 | 0 |
| Quadrant | Total seconds | Saturated seconds | Saturation percentage |
|---|---|---|---|
| A | 26935 | 626 | 2.324114% |
| B | 26935 | 1001 | 3.716354% |
| C | 26935 | 1380 | 5.123445% |
| D | 26935 | 479 | 1.778355% |
Noise dominated data is calculated using 1-second bins in cleaned event files. If a bin has >2000 counts, and if more than 50% of those come from <1% of pixels, then it is considered to be noise-dominated and hence unusable.
| Quadrant | # 1 sec bins | Bins with >0 counts | Bins with >2000 counts | High rate bins dominated by noise | Noise dominated (total time) | Noise dominated (detector-on time) | Marked lightcurve |
|---|---|---|---|---|---|---|---|
| A | 32885 | 26888 | 0 | 0 | 0.00% | 0.00% |  |
| B | 32885 | 26935 | 0 | 0 | 0.00% | 0.00% |  |
| C | 32885 | 26933 | 0 | 0 | 0.00% | 0.00% |  |
| D | 32885 | 26935 | 0 | 0 | 0.00% | 0.00% |  |
Top three noisy pixels from each quadrant. If the there are fewer than three noisy pixels in the level2.evt file, extra rows are filled as -1
| Pixel properties | Quadrant properties | ||||||
|---|---|---|---|---|---|---|---|
| Quadrant | DetID | PixID | Counts | Sigma | Mean | Median | Sigma |
| A | 0 | 29 | 1785 | 11.11 | 494 | 468 | 118.5 |
| A | 7 | 110 | 1421 | 8.04 | 494 | 468 | 118.5 |
| A | 0 | 30 | 1413 | 7.97 | 494 | 468 | 118.5 |
| B | 2 | 9 | 1329 | 9.48 | 464 | 446 | 93.1 |
| B | 5 | 128 | 1162 | 7.68 | 464 | 446 | 93.1 |
| B | 14 | 254 | 1152 | 7.58 | 464 | 446 | 93.1 |
| C | 1 | 80 | 1334 | 7.72 | 459 | 431 | 117.0 |
| C | 1 | 81 | 1323 | 7.62 | 459 | 431 | 117.0 |
| C | 9 | 209 | 1212 | 6.68 | 459 | 431 | 117.0 |
| D | 15 | 46 | 1218 | 6.53 | 460 | 423 | 121.7 |
| D | 6 | 231 | 1158 | 6.04 | 460 | 423 | 121.7 |
| D | 12 | 6 | 1149 | 5.97 | 460 | 423 | 121.7 |
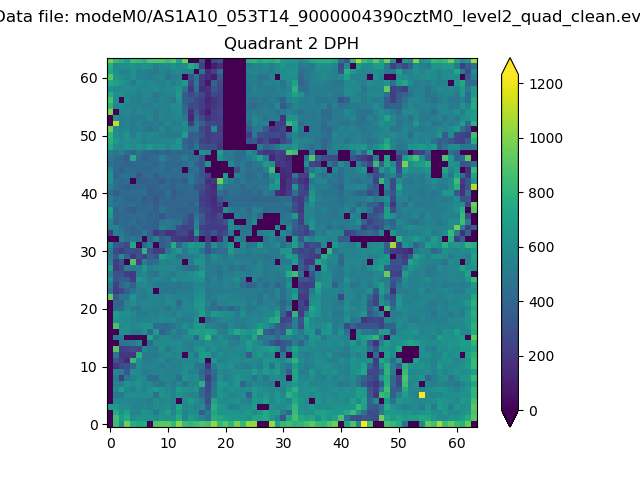
Histogram calculated using DETX and DETY for each event in the final _common_clean file
| Quadrant A |  |
 |
Quadrant B |
|---|---|---|---|
| Quadrant D |  |
 |
Quadrant C |
| Plot type | Count rate plots | Images |
|---|---|---|
| Comparison with Poisson distribution Blue bars denote a histogram of data divided into 1 sec bins. Red curve is a Poisson curve with rate = median count rate of data. |
 |
 |
| Quadrant-wise count rates Data is divided into 100 sec bins |
 |
|
| Module-wise count rates for Quadrant A Data is divided into 100 sec bins |
 |
 |
| Module-wise count rates for Quadrant B Data is divided into 100 sec bins |
 |
 |
| Module-wise count rates for Quadrant C Data is divided into 100 sec bins |
 |
 |
| Module-wise count rates for Quadrant D Data is divided into 100 sec bins |
 |
 |
| Parameter | Plot |
|---|---|
| CZT HV Monitor |  |
| D_VDD |  |
| Temperature 1 |  |
| Veto HV Monitor |  |
| Veto LLD |  |
| Alpha Counter |  |
| _CPM_Rate |  |
| CZT Counter |  |
| +2.5 Volts monitor |  |
| +5 Volts monitor |  |
| _ROLL_ROT | 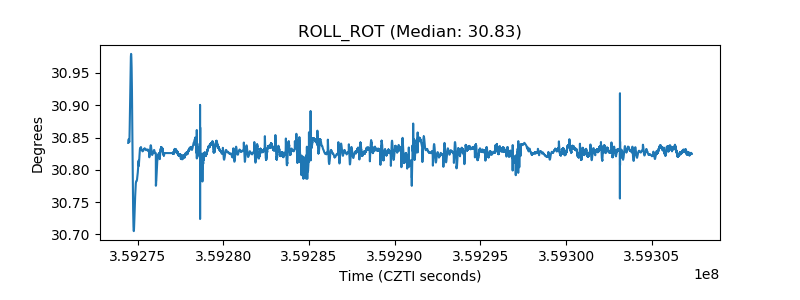 |
| _Roll_DEC |  |
| _Roll_RA |  |
| Veto Counter |  |