| Param | Original file | Final file |
|---|---|---|
| Filename | modeM0/AS1A10_053T14_9000004390_30523cztM0_level2.evt | modeM0/AS1A10_053T14_9000004390_30523cztM0_level2_quad_clean.evt |
| Size (bytes) | 432,388,800 | 66,309,120 |
| Size | 412.4 MB | 63.2 MB |
| Events in quadrant A | 3,171,971 | 420,006 |
| Events in quadrant B | 4,102,488 | 416,279 |
| Events in quadrant C | 2,620,846 | 403,143 |
| Events in quadrant D | 2,847,258 | 404,636 |
| Mode M9 | |||
|---|---|---|---|
| Quadrant | BADHDUFLAG | Total packets | Discarded packets |
| A | 0 | 10 | 0 |
| B | 0 | 10 | 0 |
| C | 0 | 10 | 0 |
| D | 0 | 10 | 0 |
| Mode M0 | |||
|---|---|---|---|
| Quadrant | BADHDUFLAG | Total packets | Discarded packets |
| A | 0 | 12667 | 1 |
| B | 0 | 15908 | 1 |
| C | 0 | 11044 | 2 |
| D | 0 | 11589 | 1 |
| Mode SS | |||
|---|---|---|---|
| Quadrant | BADHDUFLAG | Total packets | Discarded packets |
| A | 0 | 108 | 0 |
| B | 0 | 108 | 0 |
| C | 0 | 108 | 0 |
| D | 0 | 108 | 0 |
| Quadrant | Total seconds | Saturated seconds | Saturation percentage |
|---|---|---|---|
| A | 5184 | 306 | 5.902778% |
| B | 5184 | 95 | 1.832562% |
| C | 5183 | 82 | 1.582095% |
| D | 5183 | 48 | 0.926105% |
Noise dominated data is calculated using 1-second bins in cleaned event files. If a bin has >2000 counts, and if more than 50% of those come from <1% of pixels, then it is considered to be noise-dominated and hence unusable.
| Quadrant | # 1 sec bins | Bins with >0 counts | Bins with >2000 counts | High rate bins dominated by noise | Noise dominated (total time) | Noise dominated (detector-on time) | Marked lightcurve |
|---|---|---|---|---|---|---|---|
| A | 6204 | 5185 | 211 | 211 | 3.40% | 4.07% | 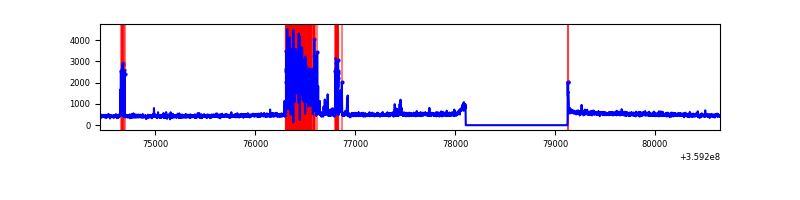 |
| B | 6204 | 5185 | 1 | 1 | 0.02% | 0.02% | 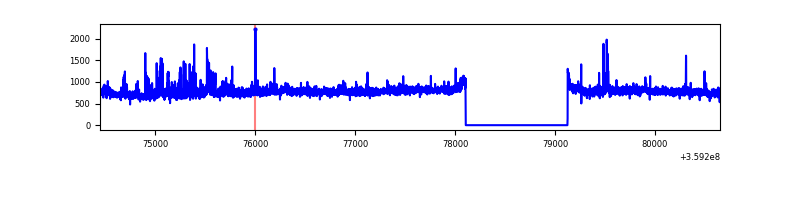 |
| C | 6203 | 5184 | 5 | 5 | 0.08% | 0.10% | 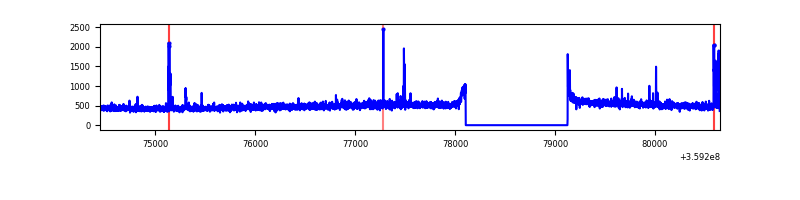 |
| D | 6203 | 5184 | 12 | 12 | 0.19% | 0.23% | 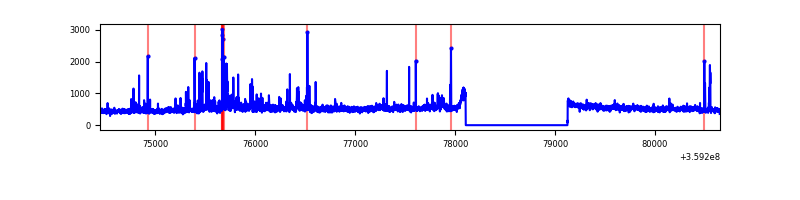 |
Top three noisy pixels from each quadrant. If the there are fewer than three noisy pixels in the level2.evt file, extra rows are filled as -1
| Pixel properties | Quadrant properties | ||||||
|---|---|---|---|---|---|---|---|
| Quadrant | DetID | PixID | Counts | Sigma | Mean | Median | Sigma |
| A | 12 | 96 | 735319 | 5769.8 | 628 | 615 | 127.3 |
| A | 8 | 192 | 12212 | 91.07 | 628 | 615 | 127.3 |
| A | 13 | 254 | 8545 | 62.28 | 628 | 615 | 127.3 |
| B | 6 | 159 | 1391516 | 11264.22 | 635 | 620 | 123.5 |
| B | 6 | 36 | 137354 | 1107.34 | 635 | 620 | 123.5 |
| B | 0 | 229 | 40832 | 325.66 | 635 | 620 | 123.5 |
| C | 14 | 238 | 101061 | 695.47 | 615 | 622 | 144.4 |
| C | 10 | 22 | 90157 | 619.97 | 615 | 622 | 144.4 |
| C | 3 | 233 | 15746 | 104.72 | 615 | 622 | 144.4 |
| D | 8 | 195 | 257261 | 1702.33 | 631 | 616 | 150.8 |
| D | 13 | 104 | 102870 | 678.25 | 631 | 616 | 150.8 |
| D | 13 | 249 | 55022 | 360.88 | 631 | 616 | 150.8 |
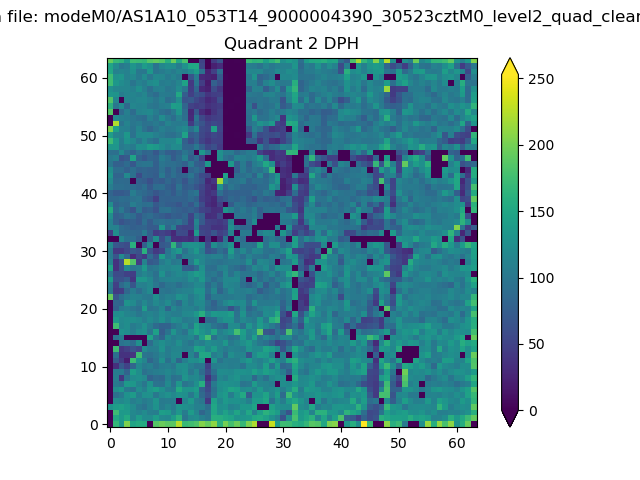
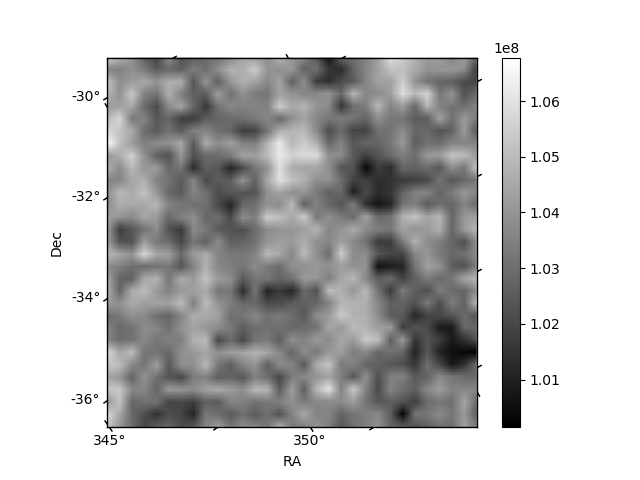
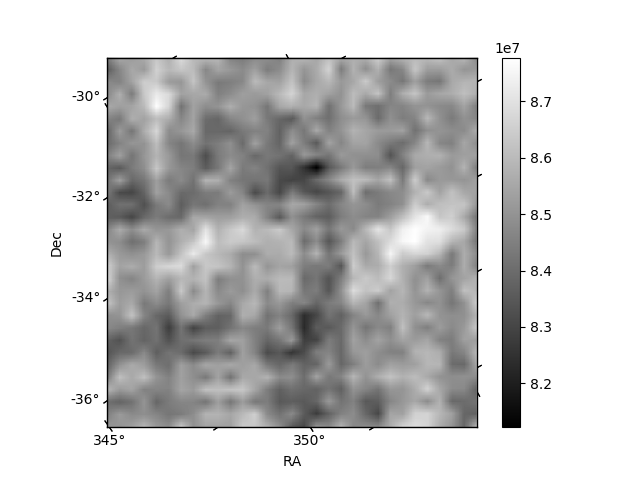
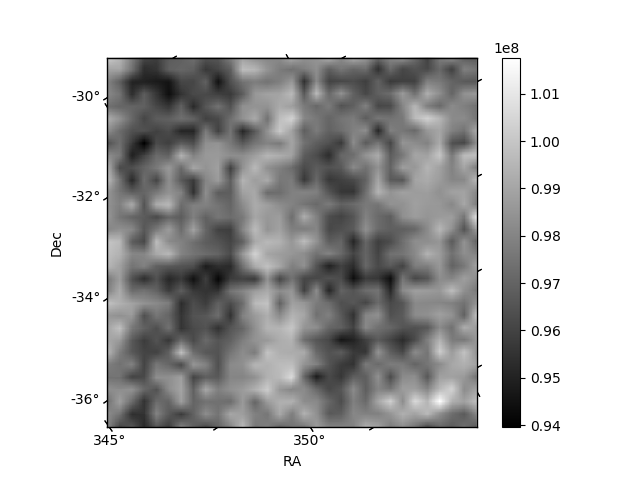
Histogram calculated using DETX and DETY for each event in the final _common_clean file
| Quadrant A | 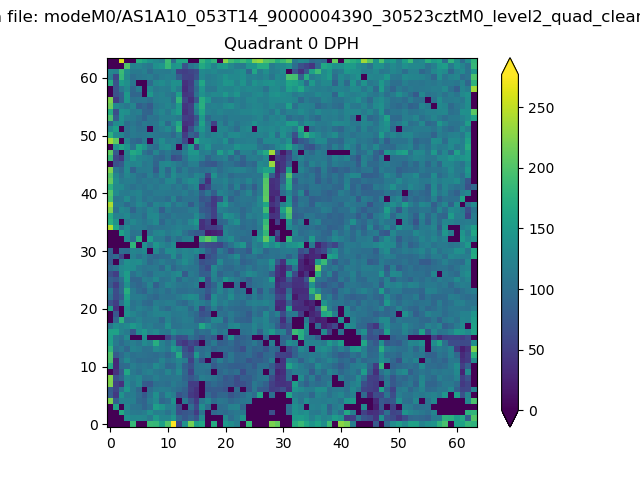 |
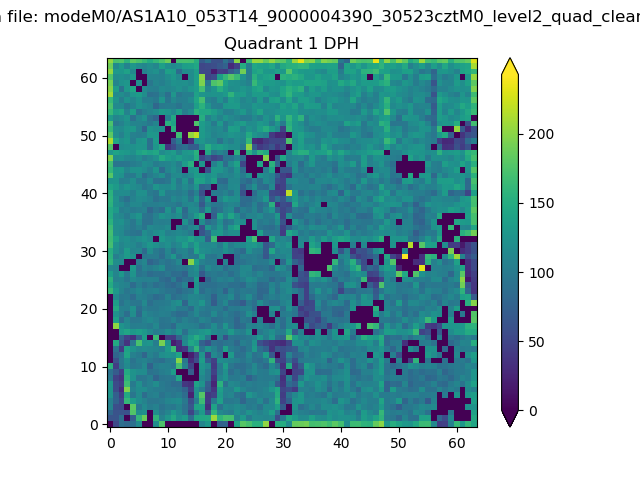 |
Quadrant B |
|---|---|---|---|
| Quadrant D | 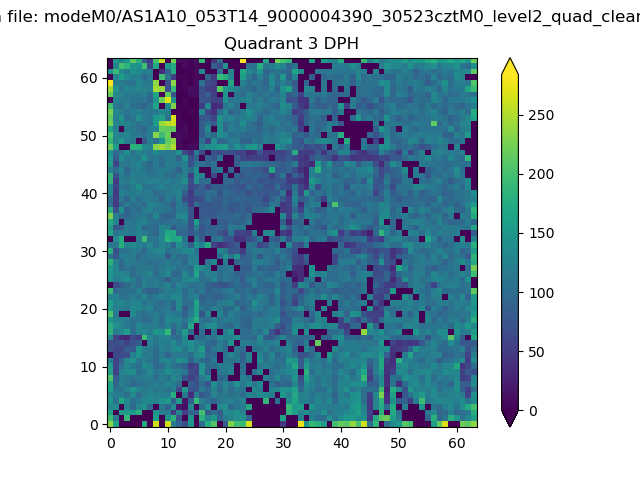 |
 |
Quadrant C |
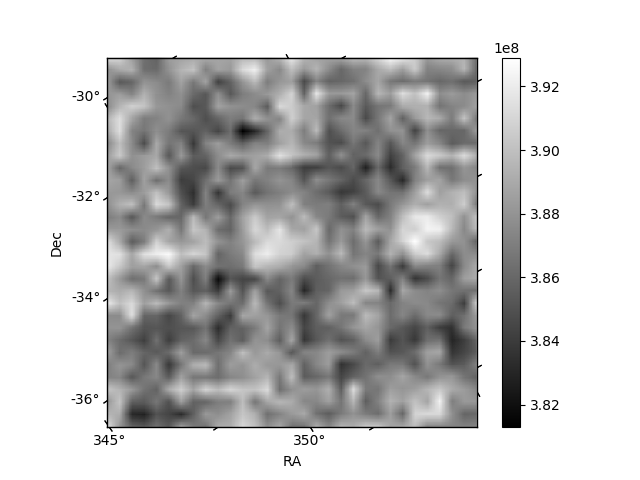
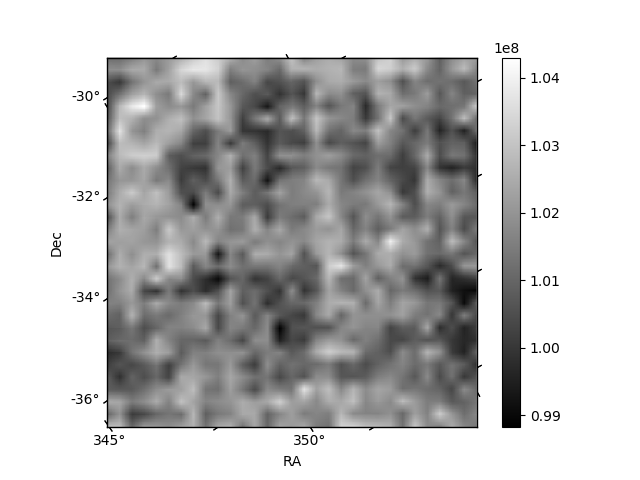
| Plot type | Count rate plots | Images |
|---|---|---|
| Comparison with Poisson distribution Blue bars denote a histogram of data divided into 1 sec bins. Red curve is a Poisson curve with rate = median count rate of data. |
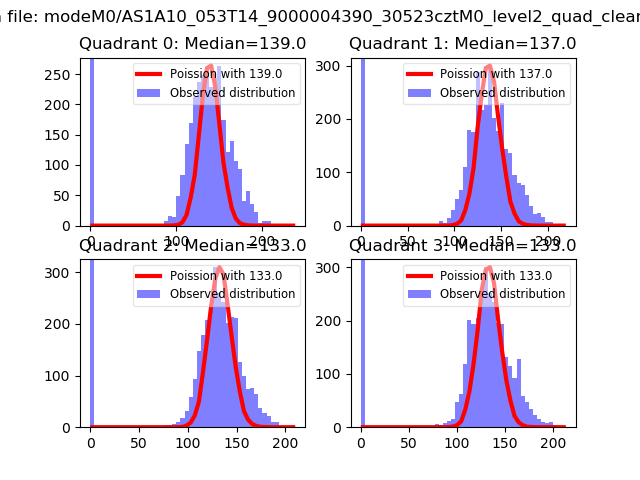 |
 |
| Quadrant-wise count rates Data is divided into 100 sec bins |
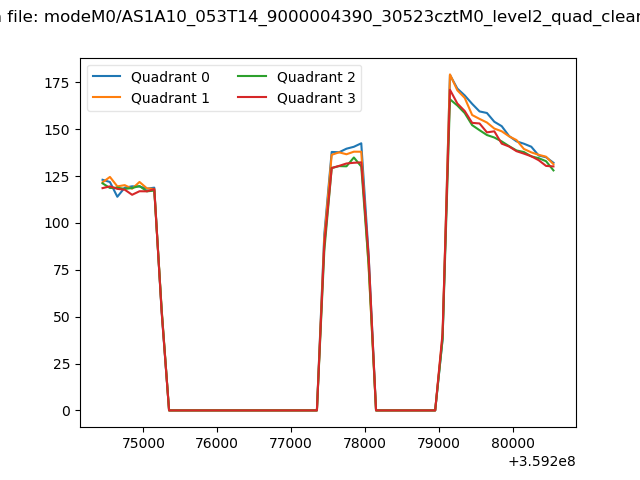 |
|
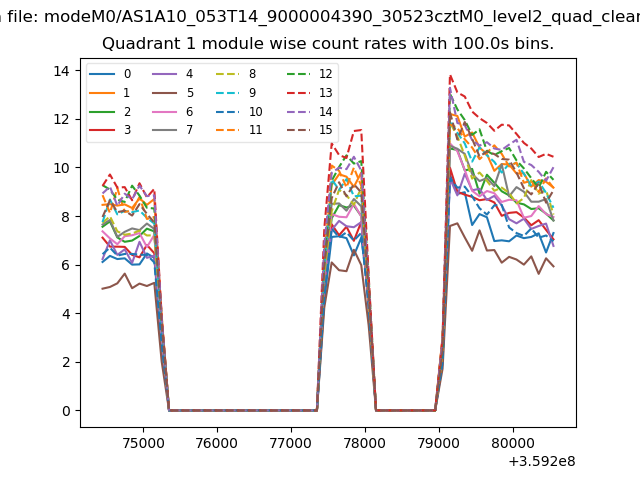
| Module-wise count rates for Quadrant A Data is divided into 100 sec bins |
 |
 |
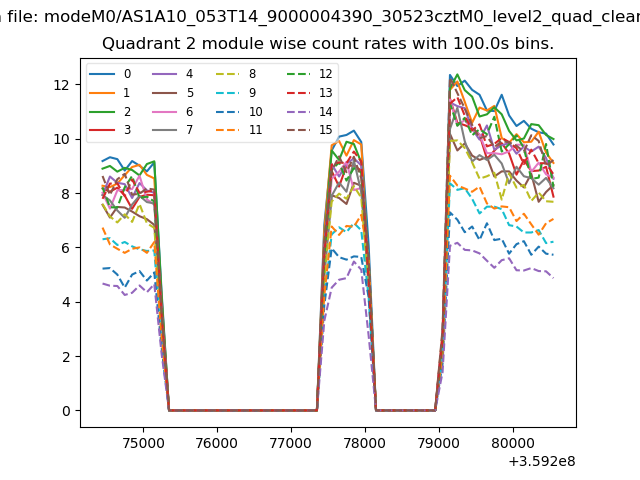
| Module-wise count rates for Quadrant B Data is divided into 100 sec bins |
 |
 |
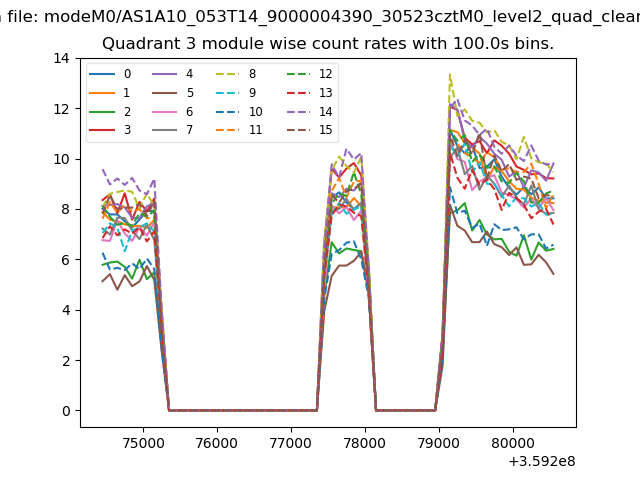
| Module-wise count rates for Quadrant C Data is divided into 100 sec bins |
 |
 |
| Module-wise count rates for Quadrant D Data is divided into 100 sec bins |
 |
 |
| Parameter | Plot |
|---|---|
| CZT HV Monitor | 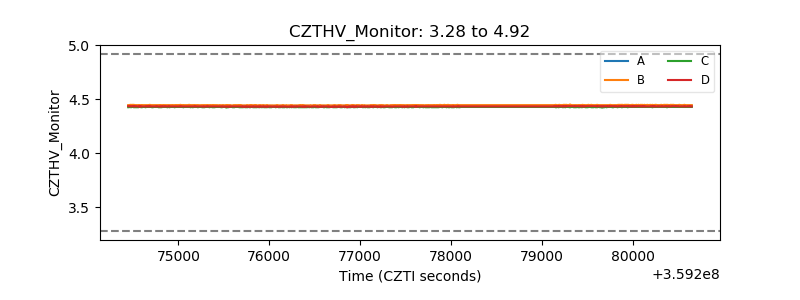 |
| D_VDD | 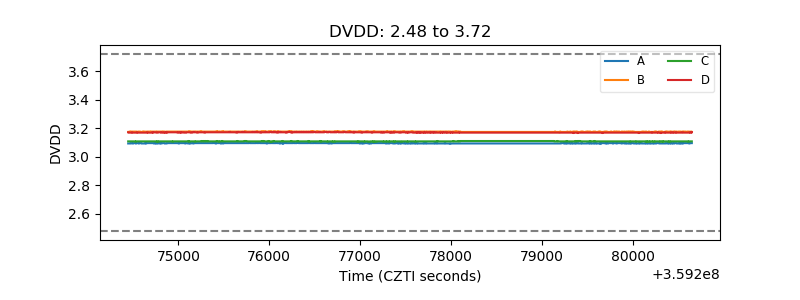 |
| Temperature 1 |  |
| Veto HV Monitor | 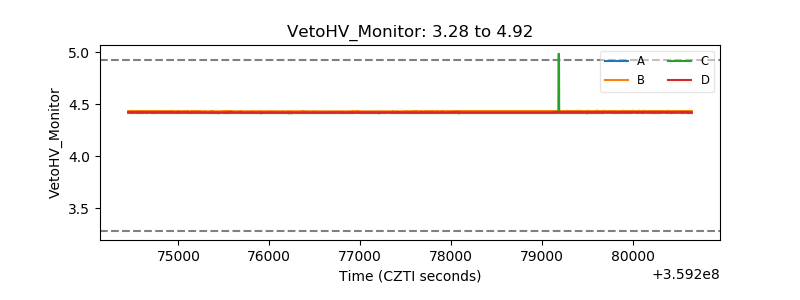 |
| Veto LLD | 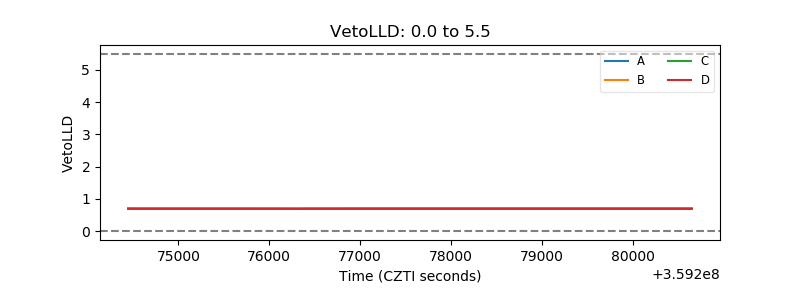 |
| Alpha Counter | 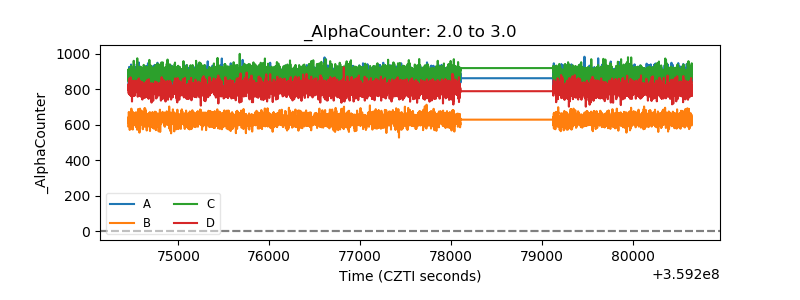 |
| _CPM_Rate | 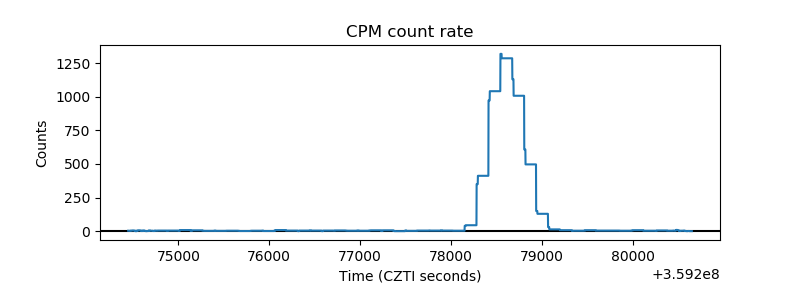 |
| CZT Counter | 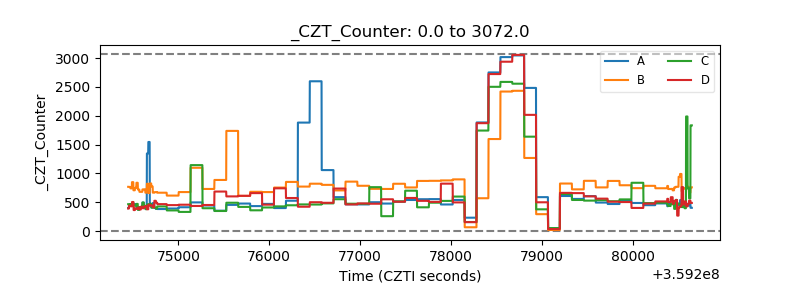 |
| +2.5 Volts monitor |  |
| +5 Volts monitor |  |
| _ROLL_ROT |  |
| _Roll_DEC |  |
| _Roll_RA | 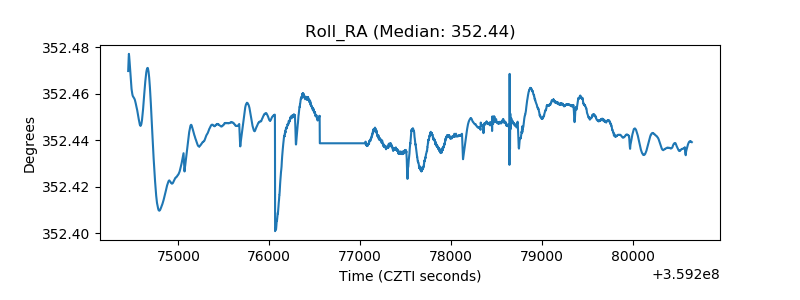 |
| Veto Counter | 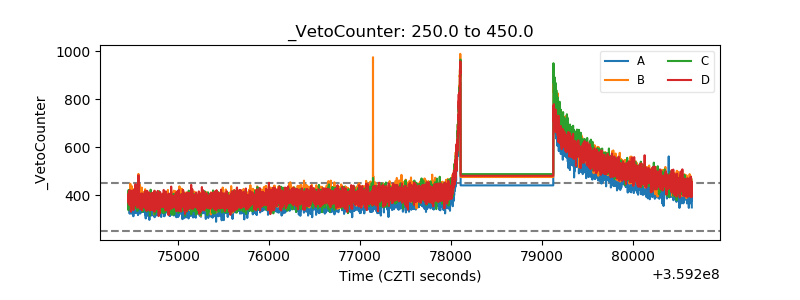 |