| Param | Original file | Final file |
|---|---|---|
| Filename | modeM0/AS1A10_053T14_9000004390_30525cztM0_level2.evt | modeM0/AS1A10_053T14_9000004390_30525cztM0_level2_quad_clean.evt |
| Size (bytes) | 487,814,400 | 87,096,960 |
| Size | 465.2 MB | 83.1 MB |
| Events in quadrant A | 3,016,710 | 571,016 |
| Events in quadrant B | 4,659,659 | 565,669 |
| Events in quadrant C | 3,180,210 | 539,861 |
| Events in quadrant D | 3,512,874 | 544,739 |
| Mode M9 | |||
|---|---|---|---|
| Quadrant | BADHDUFLAG | Total packets | Discarded packets |
| A | 0 | 12 | 0 |
| B | 0 | 12 | 0 |
| C | 0 | 12 | 0 |
| D | 0 | 12 | 0 |
| Mode M0 | |||
|---|---|---|---|
| Quadrant | BADHDUFLAG | Total packets | Discarded packets |
| A | 0 | 12620 | 1 |
| B | 0 | 18189 | 1 |
| C | 0 | 13159 | 1 |
| D | 0 | 13982 | 1 |
| Mode SS | |||
|---|---|---|---|
| Quadrant | BADHDUFLAG | Total packets | Discarded packets |
| A | 0 | 120 | 0 |
| B | 0 | 120 | 0 |
| C | 0 | 120 | 0 |
| D | 0 | 120 | 0 |
| Quadrant | Total seconds | Saturated seconds | Saturation percentage |
|---|---|---|---|
| A | 5965 | 58 | 0.972339% |
| B | 5965 | 100 | 1.676446% |
| C | 5965 | 144 | 2.414082% |
| D | 5965 | 108 | 1.810562% |
Noise dominated data is calculated using 1-second bins in cleaned event files. If a bin has >2000 counts, and if more than 50% of those come from <1% of pixels, then it is considered to be noise-dominated and hence unusable.
| Quadrant | # 1 sec bins | Bins with >0 counts | Bins with >2000 counts | High rate bins dominated by noise | Noise dominated (total time) | Noise dominated (detector-on time) | Marked lightcurve |
|---|---|---|---|---|---|---|---|
| A | 7080 | 5966 | 0 | 0 | 0.00% | 0.00% | 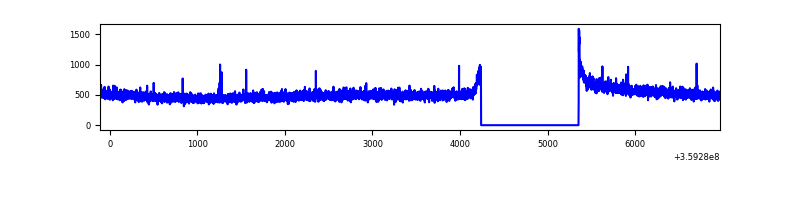 |
| B | 7080 | 5966 | 2 | 2 | 0.03% | 0.03% | 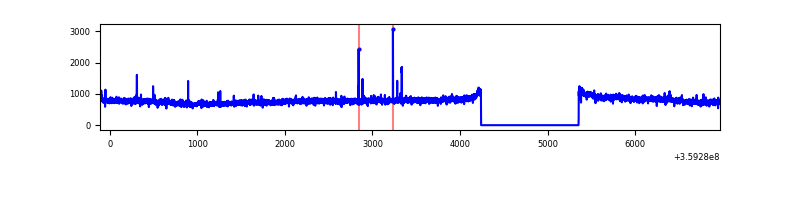 |
| C | 7080 | 5966 | 9 | 9 | 0.13% | 0.15% | 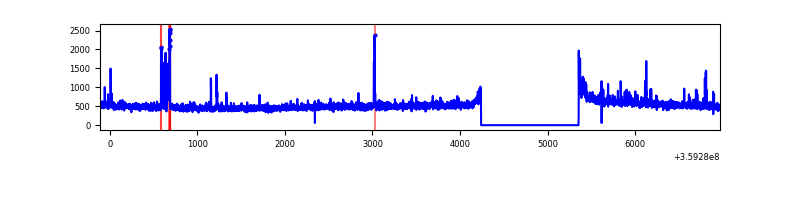 |
| D | 7080 | 5966 | 87 | 87 | 1.23% | 1.46% | 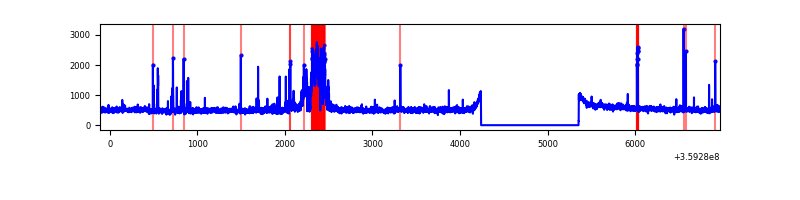 |
Top three noisy pixels from each quadrant. If the there are fewer than three noisy pixels in the level2.evt file, extra rows are filled as -1
| Pixel properties | Quadrant properties | ||||||
|---|---|---|---|---|---|---|---|
| Quadrant | DetID | PixID | Counts | Sigma | Mean | Median | Sigma |
| A | 13 | 254 | 10391 | 62.41 | 777 | 763 | 154.3 |
| A | 15 | 192 | 9691 | 57.87 | 777 | 763 | 154.3 |
| A | 8 | 192 | 9687 | 57.84 | 777 | 763 | 154.3 |
| B | 6 | 159 | 1641503 | 11504.9 | 754 | 735 | 142.6 |
| B | 4 | 171 | 17519 | 117.68 | 754 | 735 | 142.6 |
| B | 12 | 111 | 17129 | 114.95 | 754 | 735 | 142.6 |
| C | 10 | 22 | 136291 | 797.88 | 727 | 732 | 169.9 |
| C | 14 | 238 | 130633 | 764.57 | 727 | 732 | 169.9 |
| C | 3 | 233 | 27556 | 157.88 | 727 | 732 | 169.9 |
| D | 12 | 227 | 329174 | 1822.13 | 752 | 735 | 180.3 |
| D | 8 | 195 | 220292 | 1218.07 | 752 | 735 | 180.3 |
| D | 13 | 249 | 39032 | 212.47 | 752 | 735 | 180.3 |
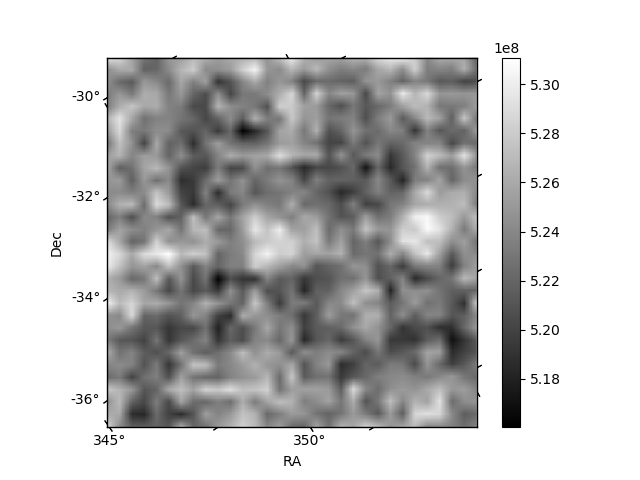
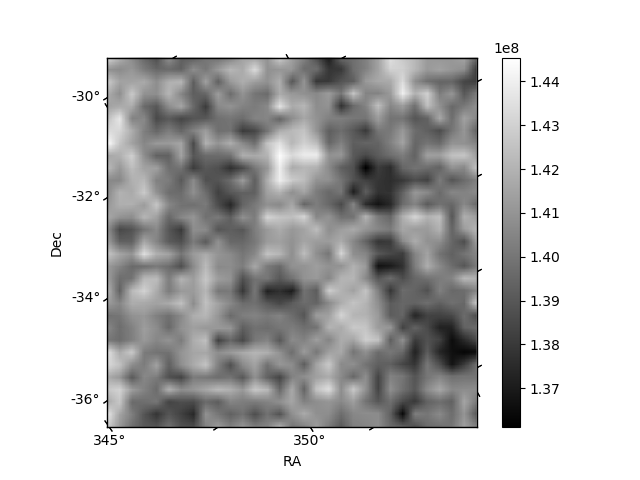
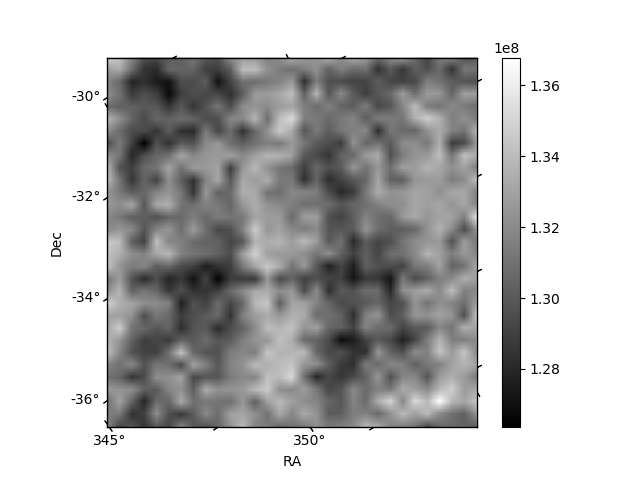
Histogram calculated using DETX and DETY for each event in the final _common_clean file
| Quadrant A | 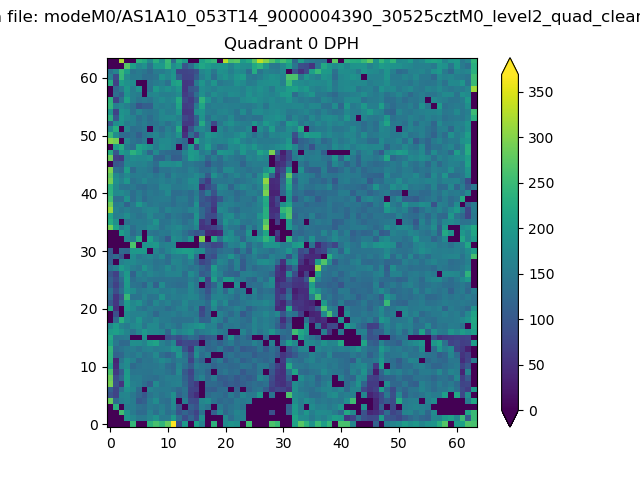 |
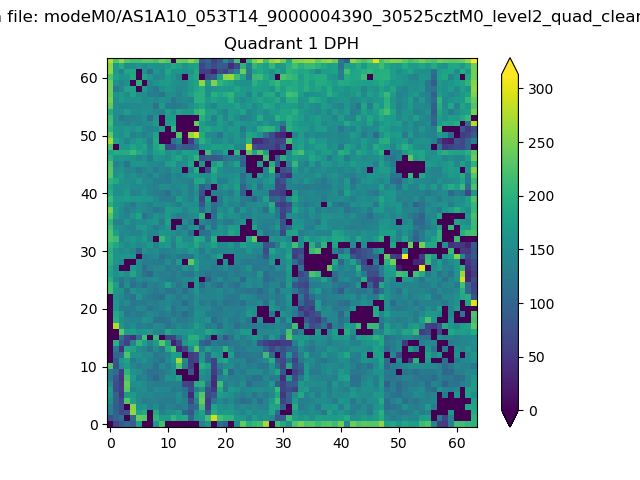 |
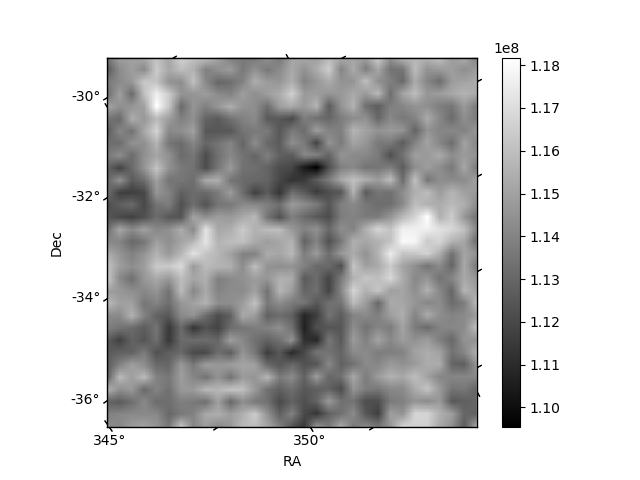
Quadrant B |
|---|---|---|---|
| Quadrant D | 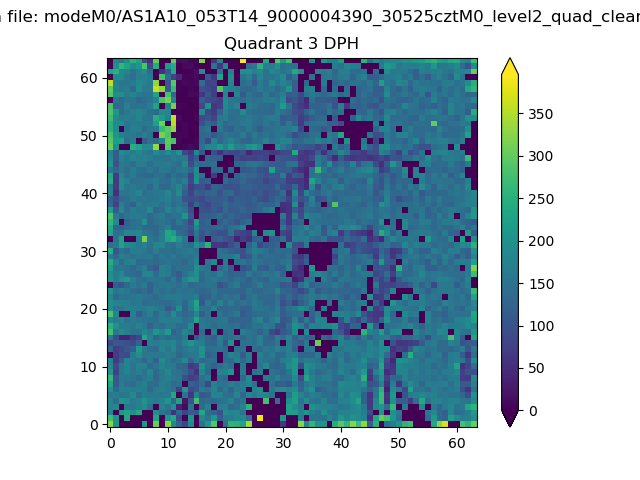 |
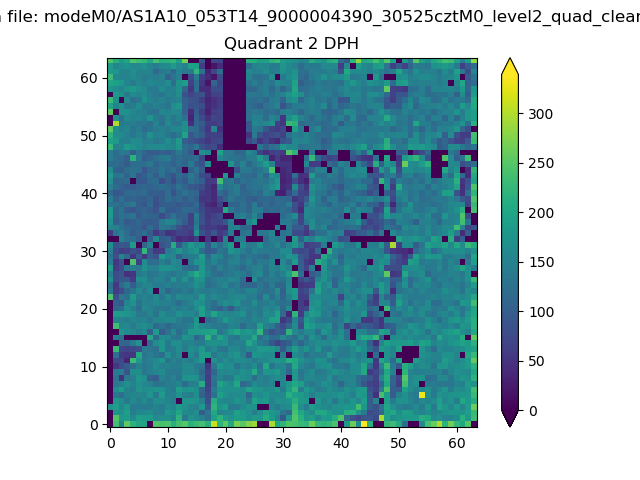 |
Quadrant C |
| Plot type | Count rate plots | Images |
|---|---|---|
| Comparison with Poisson distribution Blue bars denote a histogram of data divided into 1 sec bins. Red curve is a Poisson curve with rate = median count rate of data. |
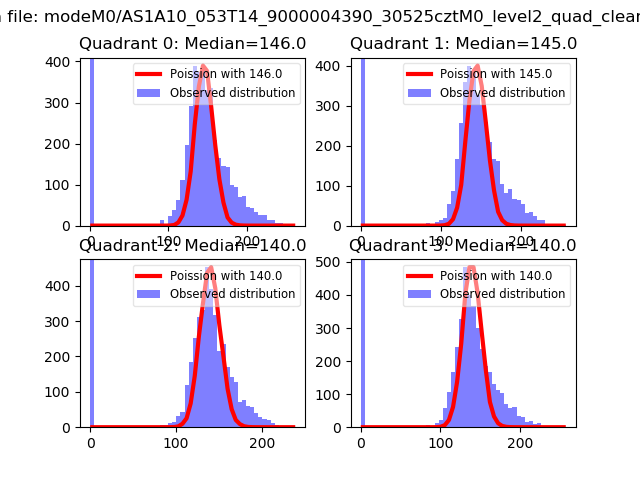 |
 |
| Quadrant-wise count rates Data is divided into 100 sec bins |
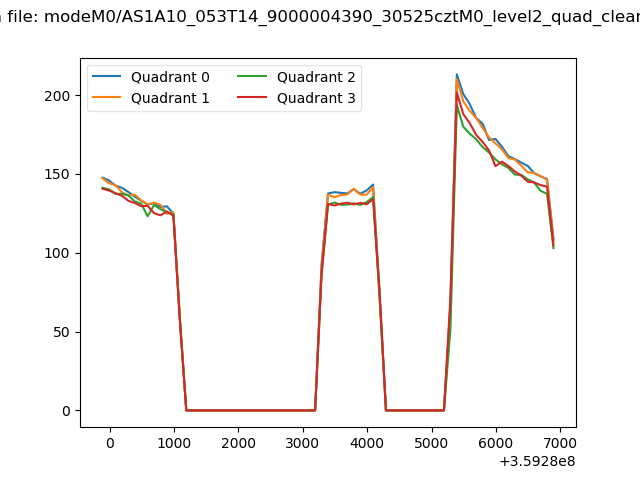 |
|
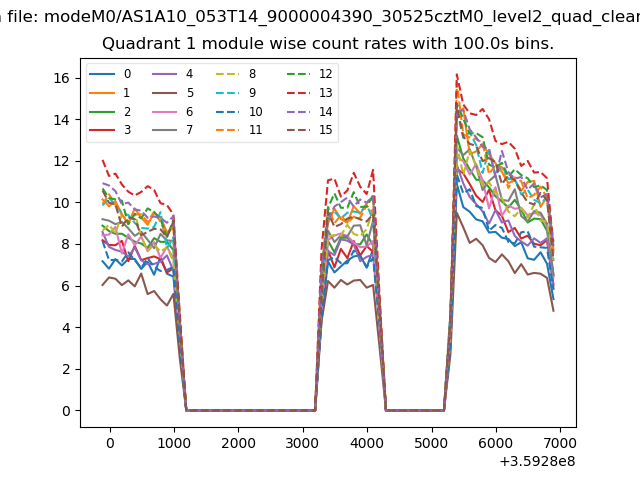
| Module-wise count rates for Quadrant A Data is divided into 100 sec bins |
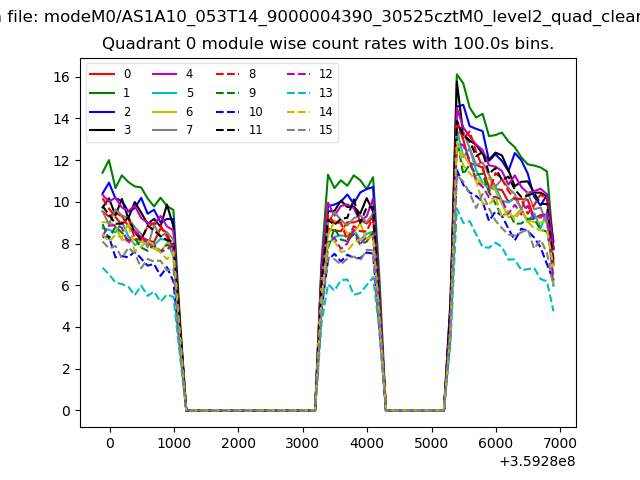 |
 |
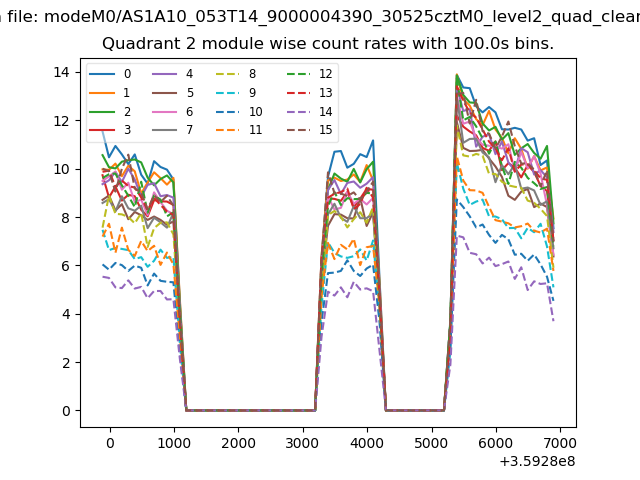
| Module-wise count rates for Quadrant B Data is divided into 100 sec bins |
 |
 |
| Module-wise count rates for Quadrant C Data is divided into 100 sec bins |
 |
 |
| Module-wise count rates for Quadrant D Data is divided into 100 sec bins |
 |
 |
| Parameter | Plot |
|---|---|
| CZT HV Monitor | 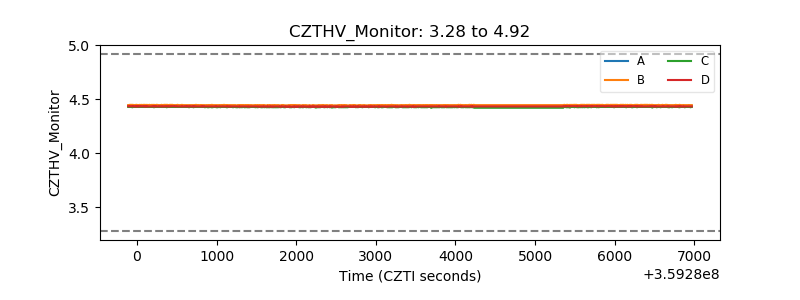 |
| D_VDD | 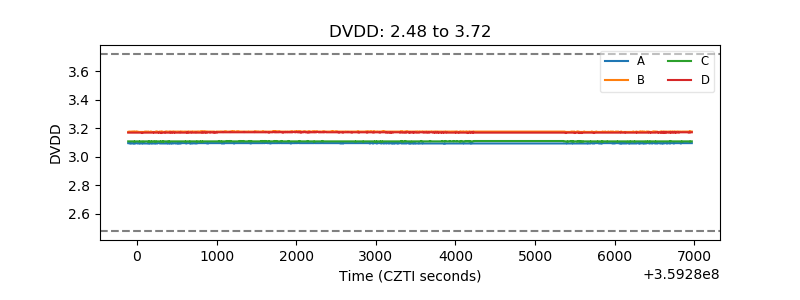 |
| Temperature 1 | 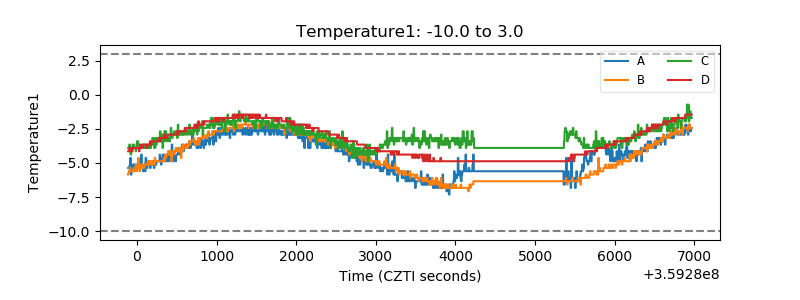 |
| Veto HV Monitor | 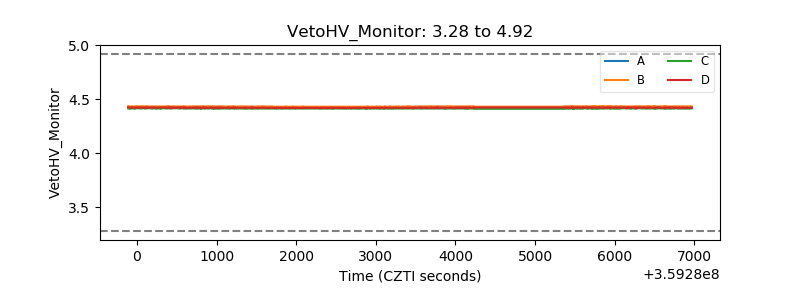 |
| Veto LLD | 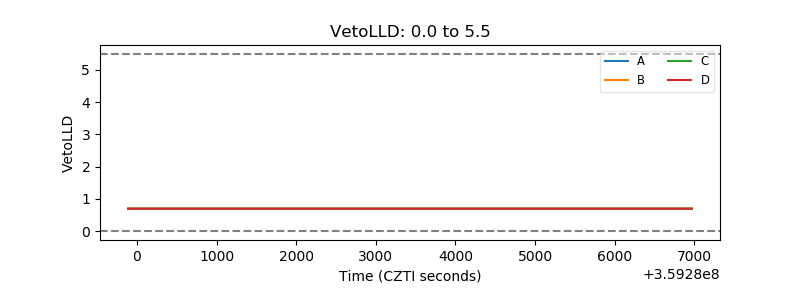 |
| Alpha Counter | 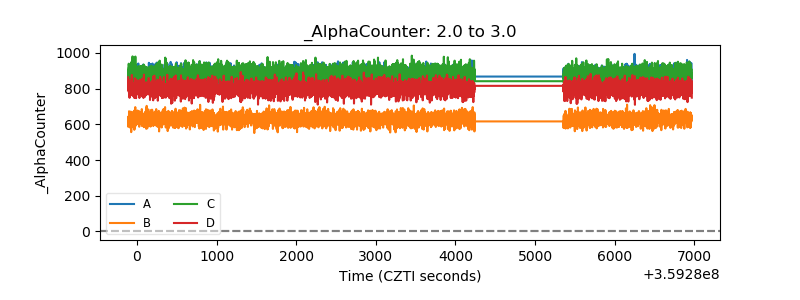 |
| _CPM_Rate | 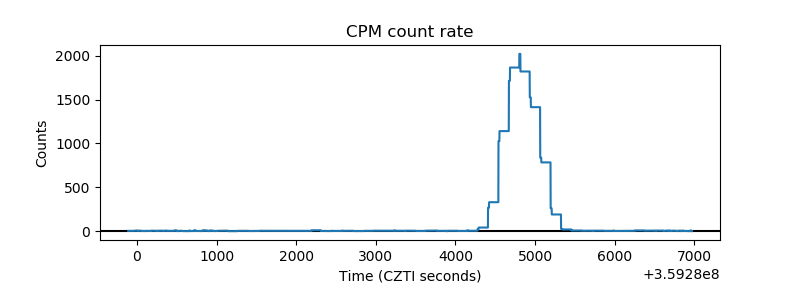 |
| CZT Counter | 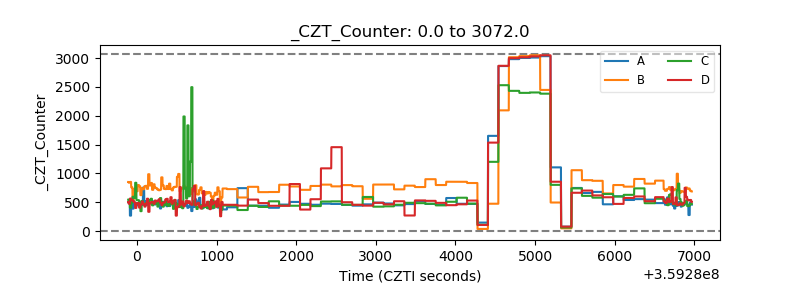 |
| +2.5 Volts monitor |  |
| +5 Volts monitor |  |
| _ROLL_ROT | 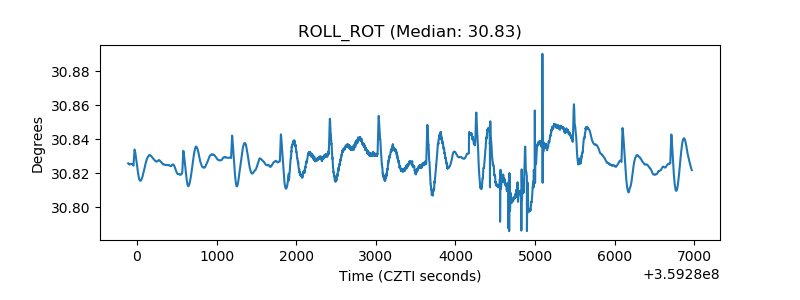 |
| _Roll_DEC | 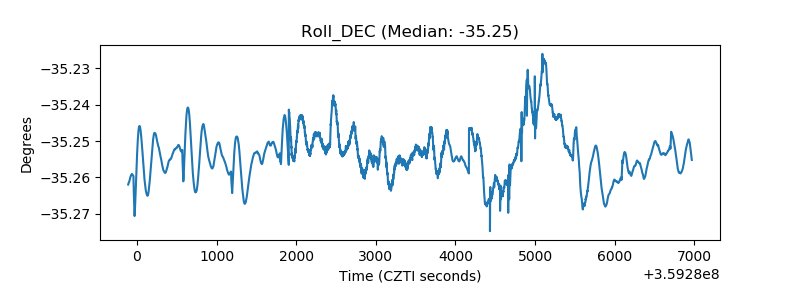 |
| _Roll_RA | 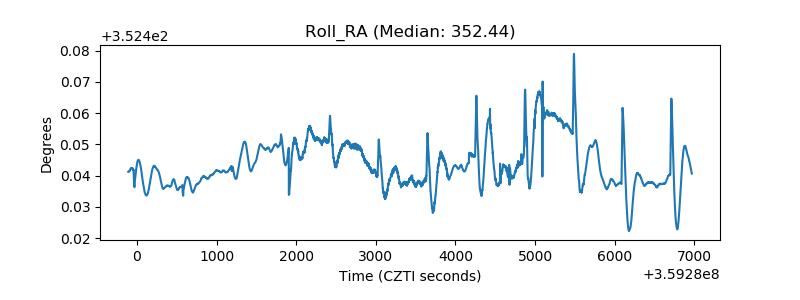 |
| Veto Counter | 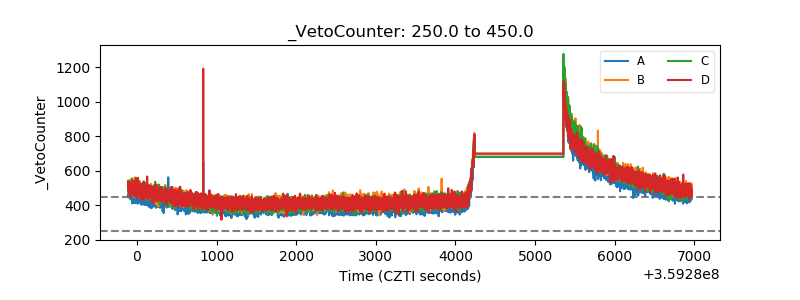 |