| Param | Original file | Final file |
|---|---|---|
| Filename | modeM0/AS1A10_053T14_9000004390_30526cztM0_level2.evt | modeM0/AS1A10_053T14_9000004390_30526cztM0_level2_quad_clean.evt |
| Size (bytes) | 532,667,520 | 86,420,160 |
| Size | 508.0 MB | 82.4 MB |
| Events in quadrant A | 3,177,632 | 571,346 |
| Events in quadrant B | 5,059,237 | 559,341 |
| Events in quadrant C | 3,864,899 | 531,814 |
| Events in quadrant D | 3,627,491 | 539,234 |
| Mode M9 | |||
|---|---|---|---|
| Quadrant | BADHDUFLAG | Total packets | Discarded packets |
| A | 0 | 12 | 0 |
| B | 0 | 12 | 0 |
| C | 0 | 12 | 0 |
| D | 0 | 12 | 0 |
| Mode M0 | |||
|---|---|---|---|
| Quadrant | BADHDUFLAG | Total packets | Discarded packets |
| A | 0 | 12953 | 1 |
| B | 0 | 19116 | 2 |
| C | 0 | 15351 | 1 |
| D | 0 | 14286 | 1 |
| Mode SS | |||
|---|---|---|---|
| Quadrant | BADHDUFLAG | Total packets | Discarded packets |
| A | 0 | 122 | 0 |
| B | 0 | 122 | 0 |
| C | 0 | 122 | 0 |
| D | 0 | 122 | 0 |
| Quadrant | Total seconds | Saturated seconds | Saturation percentage |
|---|---|---|---|
| A | 5940 | 74 | 1.245791% |
| B | 5940 | 207 | 3.484848% |
| C | 5940 | 387 | 6.515152% |
| D | 5940 | 91 | 1.531987% |
Noise dominated data is calculated using 1-second bins in cleaned event files. If a bin has >2000 counts, and if more than 50% of those come from <1% of pixels, then it is considered to be noise-dominated and hence unusable.
| Quadrant | # 1 sec bins | Bins with >0 counts | Bins with >2000 counts | High rate bins dominated by noise | Noise dominated (total time) | Noise dominated (detector-on time) | Marked lightcurve |
|---|---|---|---|---|---|---|---|
| A | 7160 | 5941 | 3 | 3 | 0.04% | 0.05% | 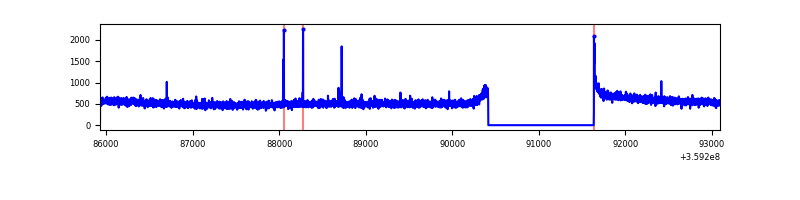 |
| B | 7160 | 5941 | 79 | 79 | 1.10% | 1.33% | 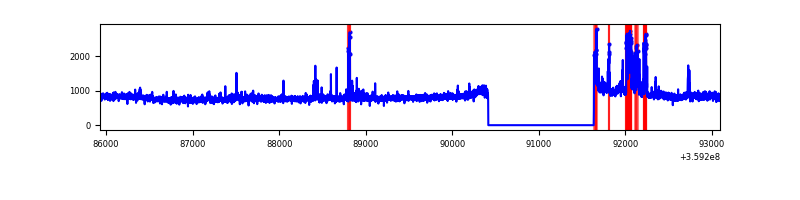 |
| C | 7160 | 5941 | 117 | 117 | 1.63% | 1.97% | 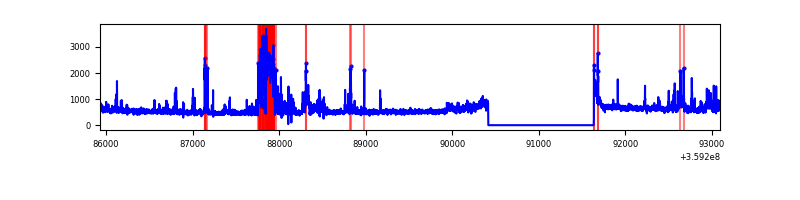 |
| D | 7160 | 5941 | 52 | 52 | 0.73% | 0.88% | 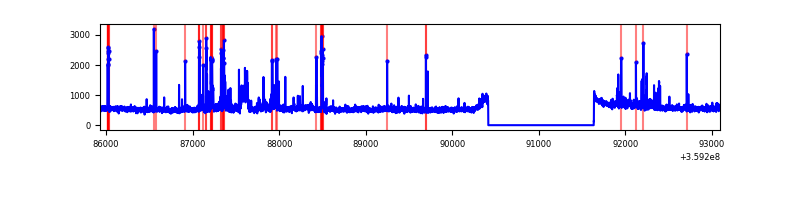 |
Top three noisy pixels from each quadrant. If the there are fewer than three noisy pixels in the level2.evt file, extra rows are filled as -1
| Pixel properties | Quadrant properties | ||||||
|---|---|---|---|---|---|---|---|
| Quadrant | DetID | PixID | Counts | Sigma | Mean | Median | Sigma |
| A | 13 | 170 | 19409 | 114.67 | 815 | 800 | 162.3 |
| A | 8 | 192 | 12199 | 70.24 | 815 | 800 | 162.3 |
| A | 13 | 254 | 10614 | 60.48 | 815 | 800 | 162.3 |
| B | 6 | 159 | 1615018 | 10972.14 | 784 | 770 | 147.1 |
| B | 6 | 36 | 268347 | 1818.74 | 784 | 770 | 147.1 |
| B | 0 | 229 | 46496 | 310.8 | 784 | 770 | 147.1 |
| C | 10 | 22 | 534405 | 3113.09 | 741 | 750 | 171.4 |
| C | 14 | 238 | 163834 | 951.35 | 741 | 750 | 171.4 |
| C | 3 | 233 | 139614 | 810.06 | 741 | 750 | 171.4 |
| D | 8 | 195 | 240204 | 1194.11 | 779 | 769 | 200.5 |
| D | 12 | 233 | 132298 | 655.96 | 779 | 769 | 200.5 |
| D | 1 | 52 | 105387 | 521.75 | 779 | 769 | 200.5 |
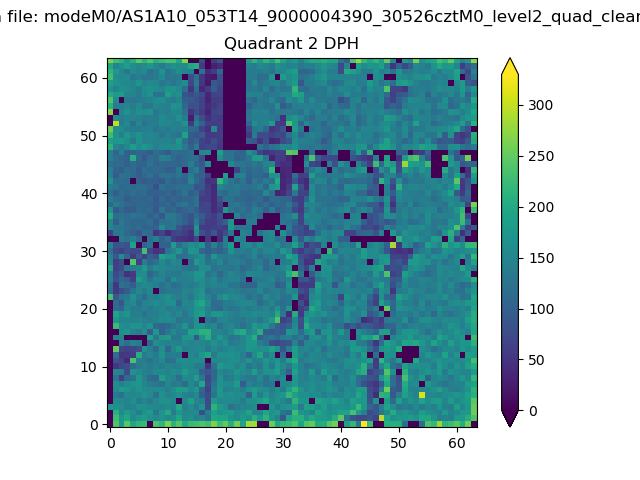
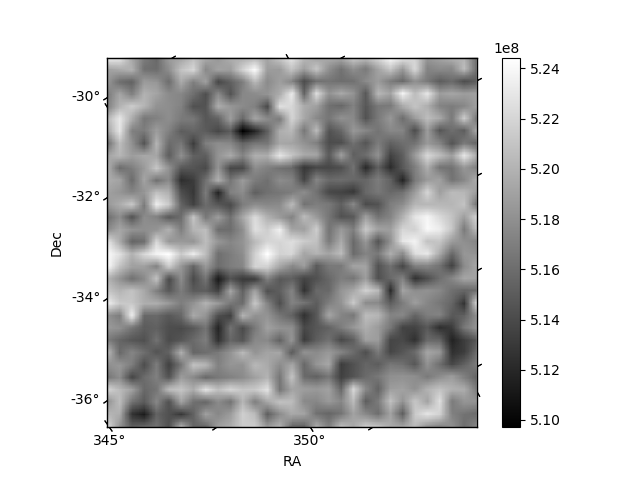
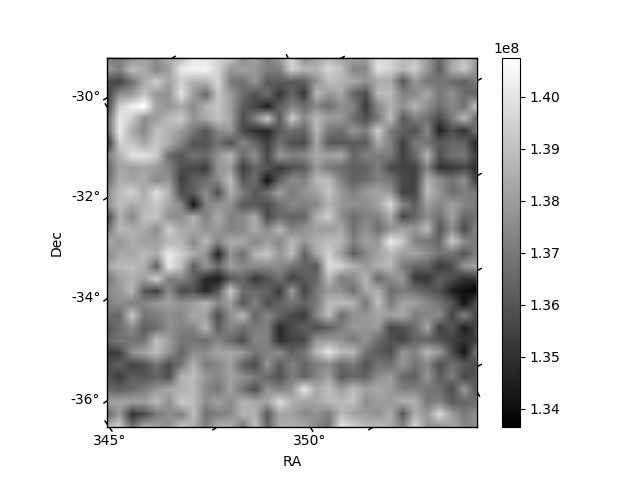
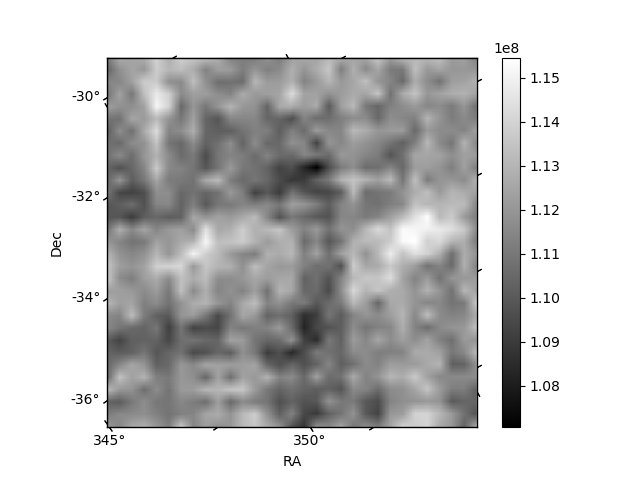
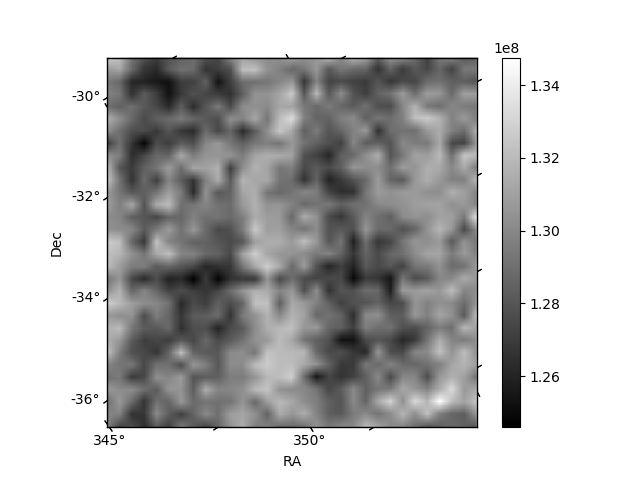
Histogram calculated using DETX and DETY for each event in the final _common_clean file
| Quadrant A | 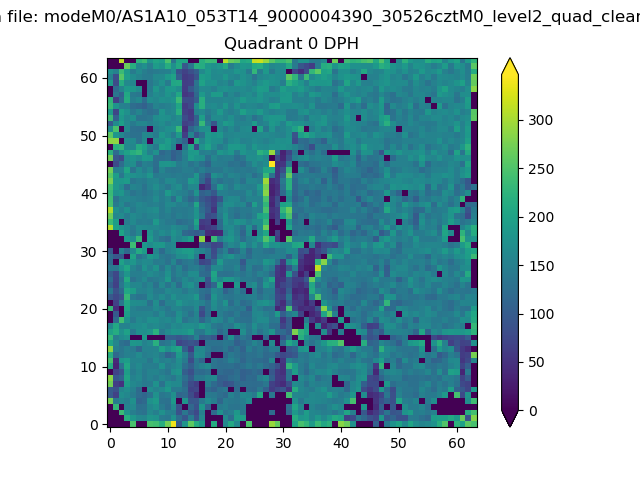 |
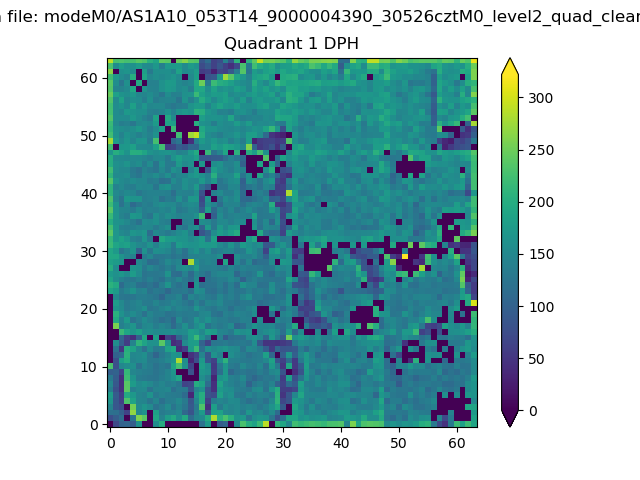 |
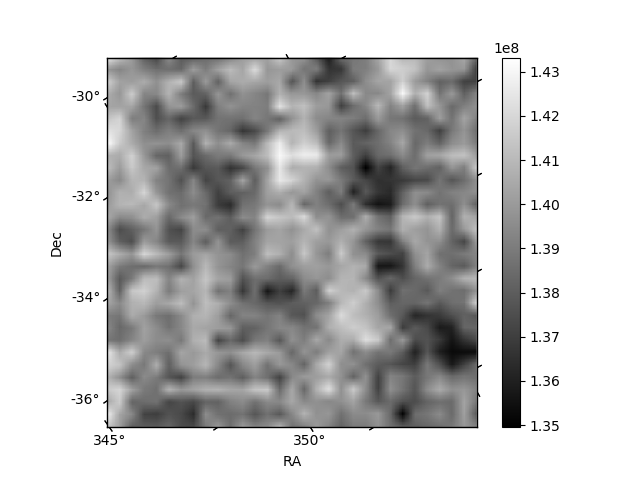
Quadrant B |
|---|---|---|---|
| Quadrant D | 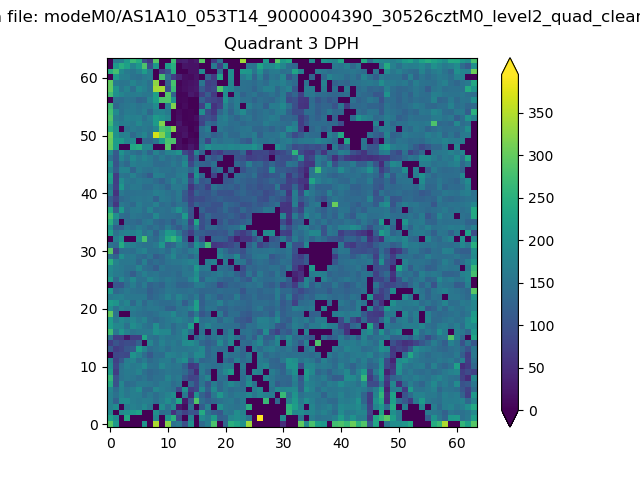 |
 |
Quadrant C |
| Plot type | Count rate plots | Images |
|---|---|---|
| Comparison with Poisson distribution Blue bars denote a histogram of data divided into 1 sec bins. Red curve is a Poisson curve with rate = median count rate of data. |
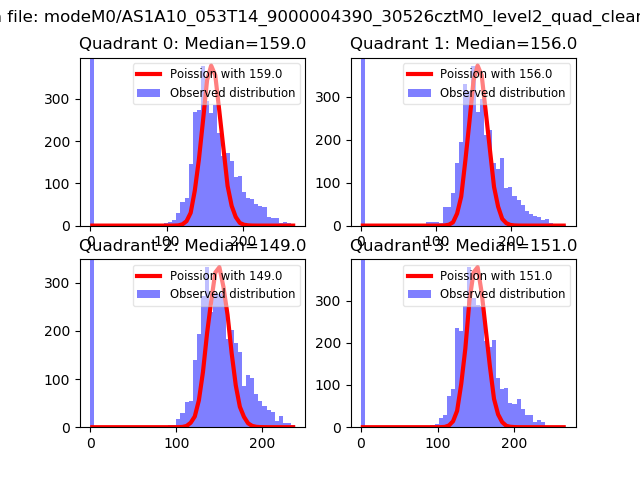 |
 |
| Quadrant-wise count rates Data is divided into 100 sec bins |
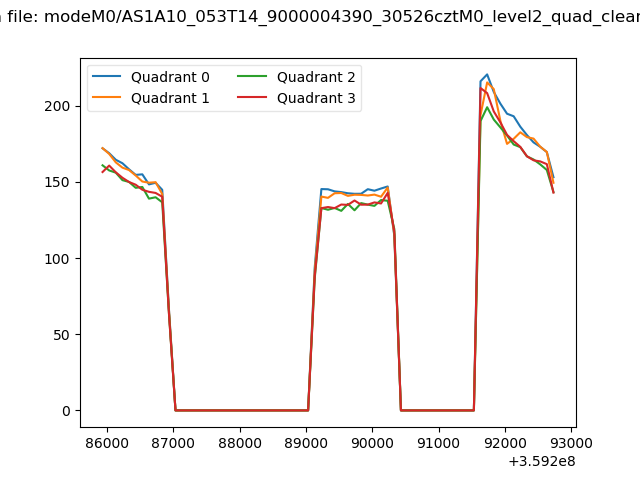 |
|
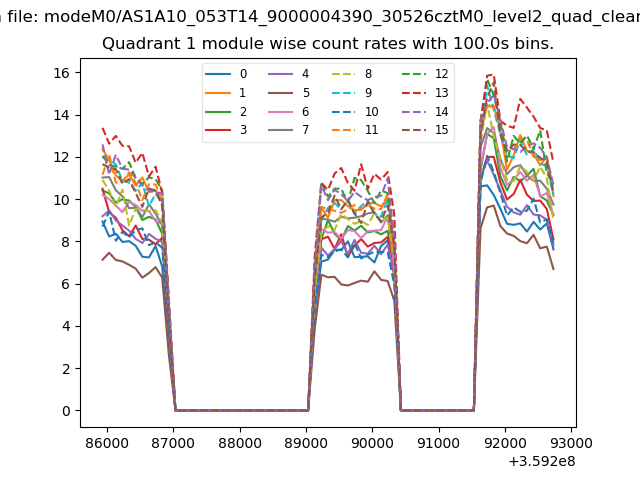
| Module-wise count rates for Quadrant A Data is divided into 100 sec bins |
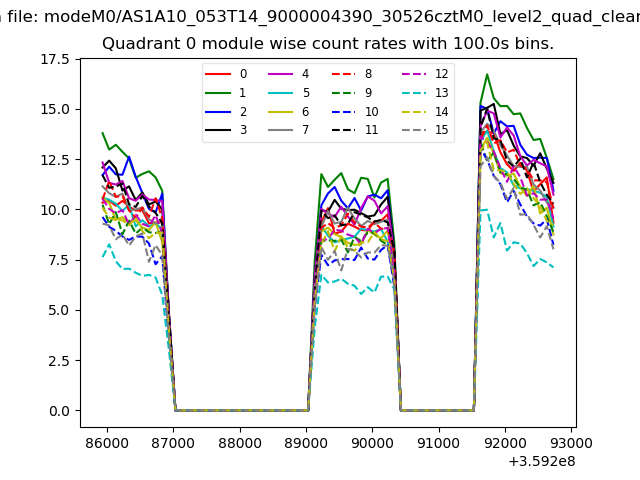 |
 |
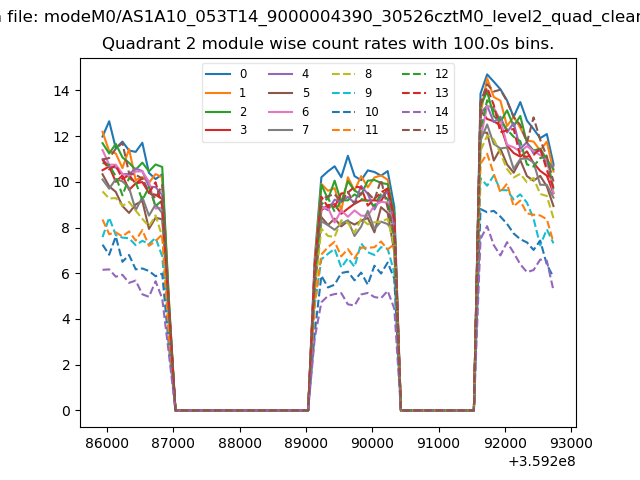
| Module-wise count rates for Quadrant B Data is divided into 100 sec bins |
 |
 |
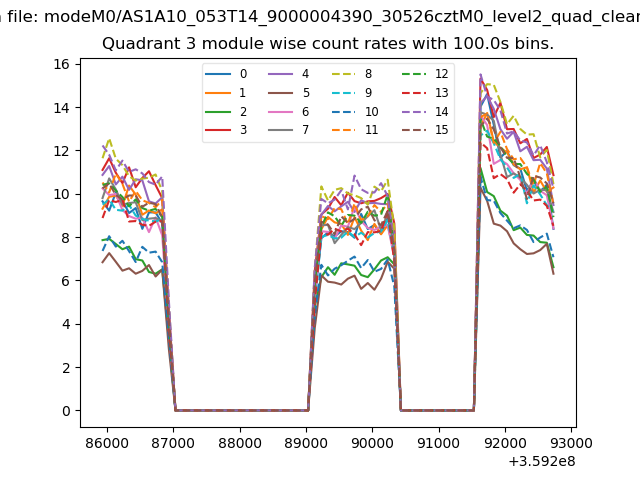
| Module-wise count rates for Quadrant C Data is divided into 100 sec bins |
 |
 |
| Module-wise count rates for Quadrant D Data is divided into 100 sec bins |
 |
 |
| Parameter | Plot |
|---|---|
| CZT HV Monitor | 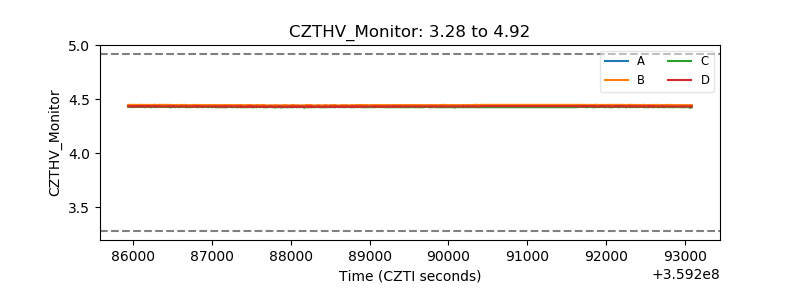 |
| D_VDD | 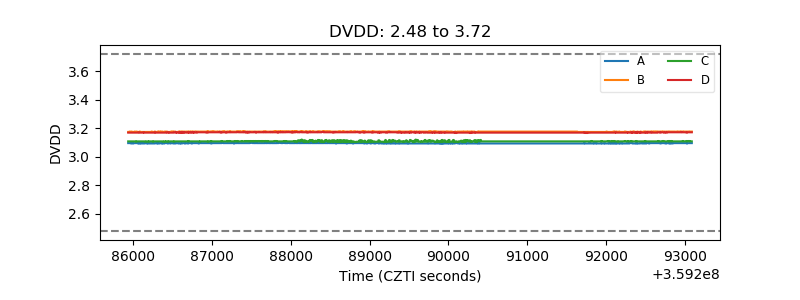 |
| Temperature 1 | 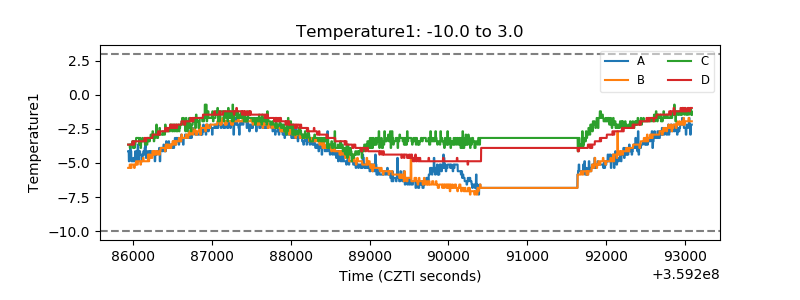 |
| Veto HV Monitor | 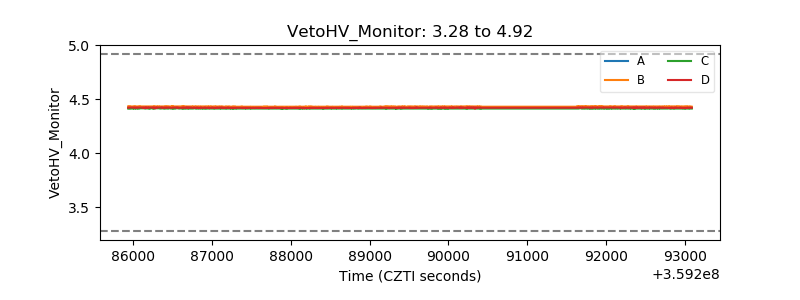 |
| Veto LLD | 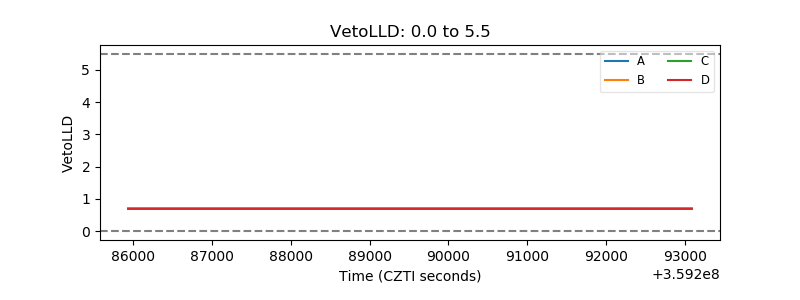 |
| Alpha Counter | 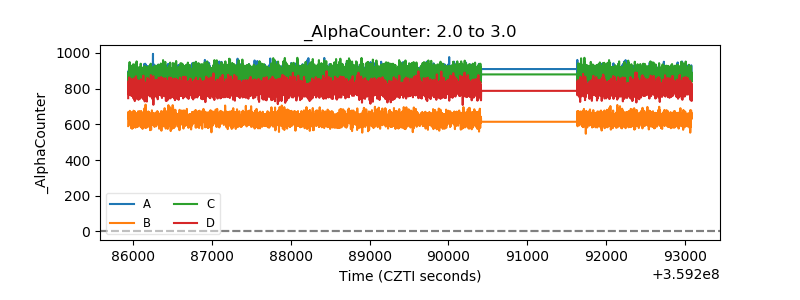 |
| _CPM_Rate | 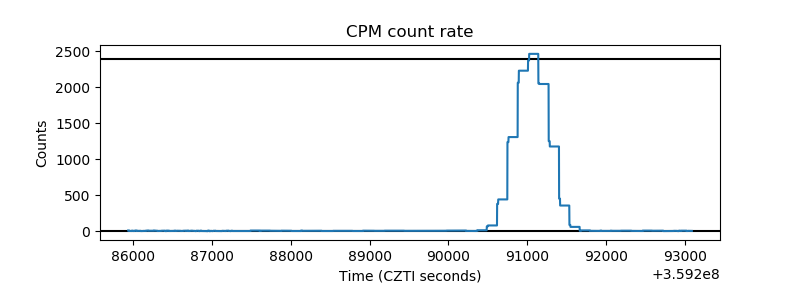 |
| CZT Counter | 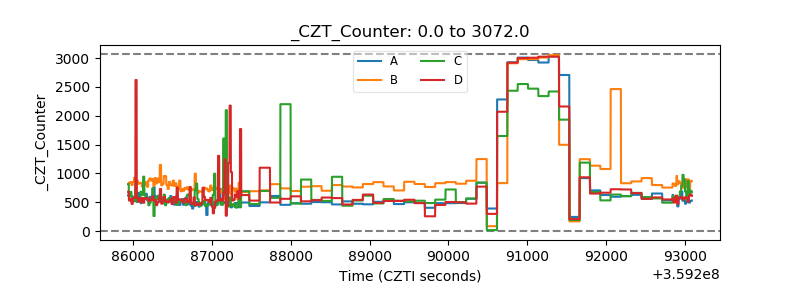 |
| +2.5 Volts monitor |  |
| +5 Volts monitor | 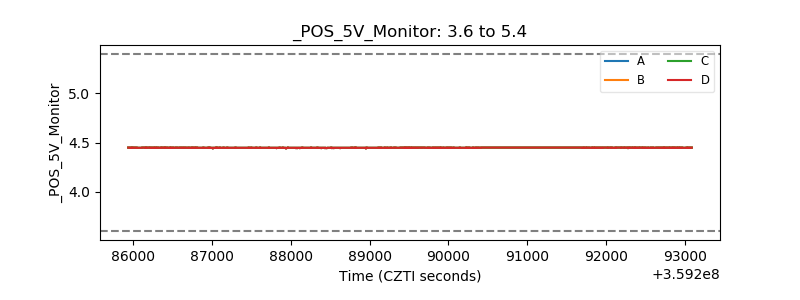 |
| _ROLL_ROT | 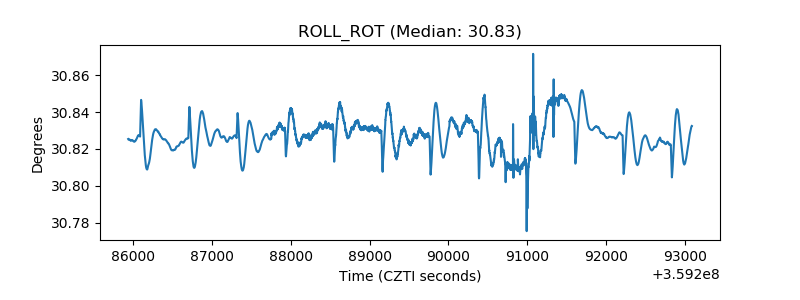 |
| _Roll_DEC | 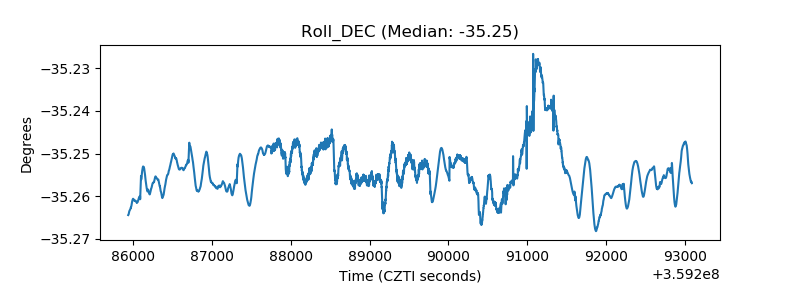 |
| _Roll_RA | 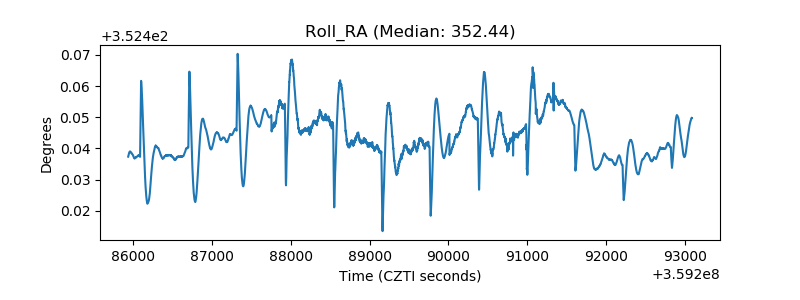 |
| Veto Counter | 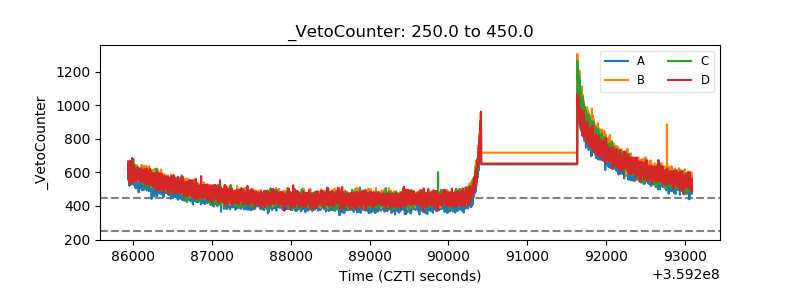 |