| Param | Original file | Final file |
|---|---|---|
| Filename | modeM0/AS1A10_053T14_9000004390_30528cztM0_level2.evt | modeM0/AS1A10_053T14_9000004390_30528cztM0_level2_quad_clean.evt |
| Size (bytes) | 594,155,520 | 75,363,840 |
| Size | 566.6 MB | 71.9 MB |
| Events in quadrant A | 3,442,922 | 483,883 |
| Events in quadrant B | 5,373,506 | 475,930 |
| Events in quadrant C | 4,254,217 | 438,941 |
| Events in quadrant D | 4,504,189 | 450,179 |
| Mode M9 | |||
|---|---|---|---|
| Quadrant | BADHDUFLAG | Total packets | Discarded packets |
| A | 0 | 13 | 0 |
| B | 0 | 13 | 0 |
| C | 0 | 13 | 0 |
| D | 0 | 13 | 0 |
| Mode M0 | |||
|---|---|---|---|
| Quadrant | BADHDUFLAG | Total packets | Discarded packets |
| A | 0 | 13915 | 1 |
| B | 0 | 19740 | 1 |
| C | 0 | 16630 | 1 |
| D | 0 | 17746 | 1 |
| Mode SS | |||
|---|---|---|---|
| Quadrant | BADHDUFLAG | Total packets | Discarded packets |
| A | 0 | 126 | 0 |
| B | 0 | 126 | 0 |
| C | 0 | 126 | 0 |
| D | 0 | 126 | 0 |
| Quadrant | Total seconds | Saturated seconds | Saturation percentage |
|---|---|---|---|
| A | 6202 | 109 | 1.757498% |
| B | 6202 | 212 | 3.418252% |
| C | 6202 | 325 | 5.240245% |
| D | 6203 | 174 | 2.805094% |
Noise dominated data is calculated using 1-second bins in cleaned event files. If a bin has >2000 counts, and if more than 50% of those come from <1% of pixels, then it is considered to be noise-dominated and hence unusable.
| Quadrant | # 1 sec bins | Bins with >0 counts | Bins with >2000 counts | High rate bins dominated by noise | Noise dominated (total time) | Noise dominated (detector-on time) | Marked lightcurve |
|---|---|---|---|---|---|---|---|
| A | 7517 | 6203 | 2 | 2 | 0.03% | 0.03% | 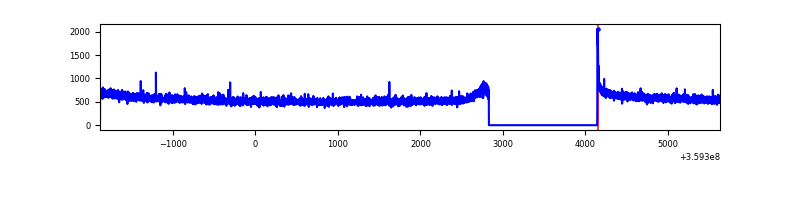 |
| B | 7517 | 6203 | 22 | 22 | 0.29% | 0.35% | 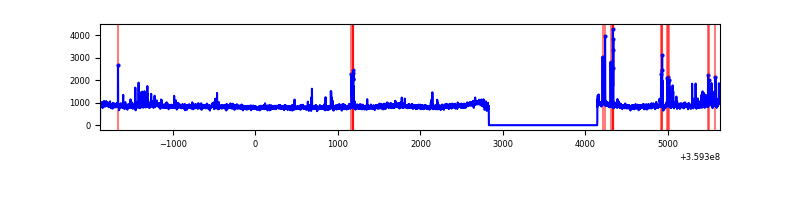 |
| C | 7517 | 6203 | 119 | 119 | 1.58% | 1.92% | 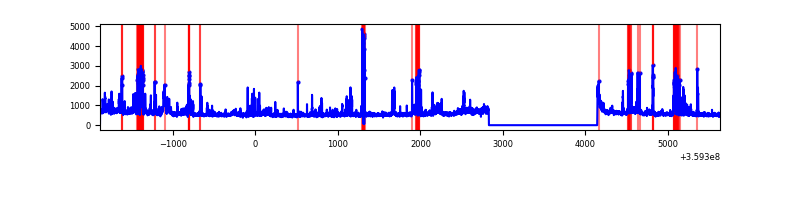 |
| D | 7518 | 6204 | 86 | 86 | 1.14% | 1.39% | 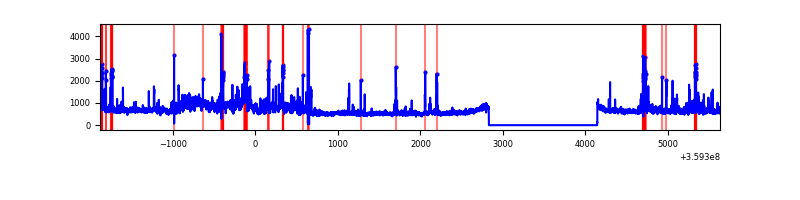 |
Top three noisy pixels from each quadrant. If the there are fewer than three noisy pixels in the level2.evt file, extra rows are filled as -1
| Pixel properties | Quadrant properties | ||||||
|---|---|---|---|---|---|---|---|
| Quadrant | DetID | PixID | Counts | Sigma | Mean | Median | Sigma |
| A | 8 | 192 | 12063 | 63.74 | 889 | 875 | 175.5 |
| A | 13 | 254 | 11275 | 59.25 | 889 | 875 | 175.5 |
| A | 3 | 137 | 7924 | 40.16 | 889 | 875 | 175.5 |
| B | 6 | 159 | 1691420 | 10593.62 | 862 | 845 | 159.6 |
| B | 6 | 36 | 124760 | 776.49 | 862 | 845 | 159.6 |
| B | 0 | 229 | 61063 | 377.34 | 862 | 845 | 159.6 |
| C | 15 | 208 | 659631 | 3529.53 | 811 | 820 | 186.7 |
| C | 10 | 22 | 206897 | 1104.04 | 811 | 820 | 186.7 |
| C | 14 | 238 | 136916 | 729.12 | 811 | 820 | 186.7 |
| D | 1 | 52 | 714186 | 3652.07 | 842 | 824 | 195.3 |
| D | 8 | 195 | 259794 | 1325.8 | 842 | 824 | 195.3 |
| D | 13 | 104 | 118707 | 603.5 | 842 | 824 | 195.3 |
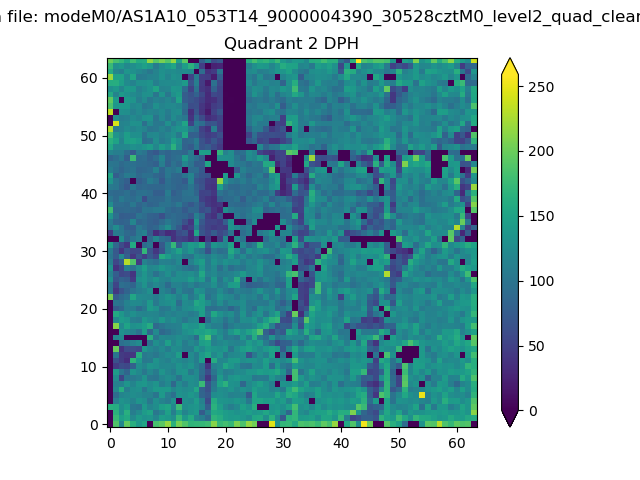
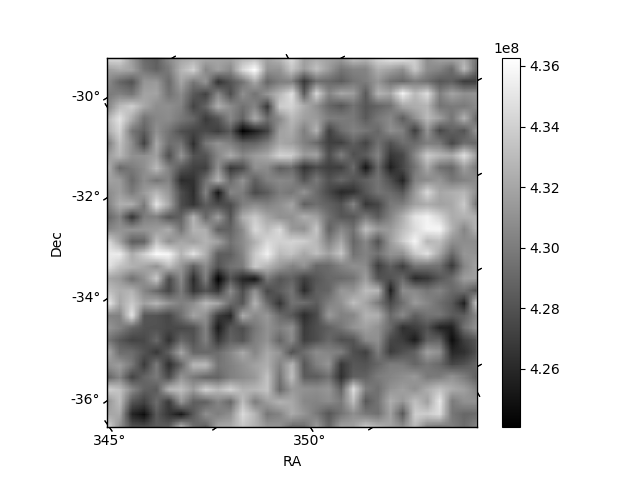
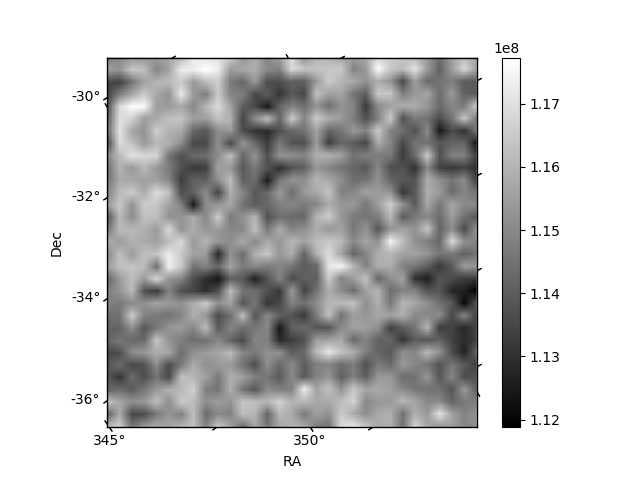
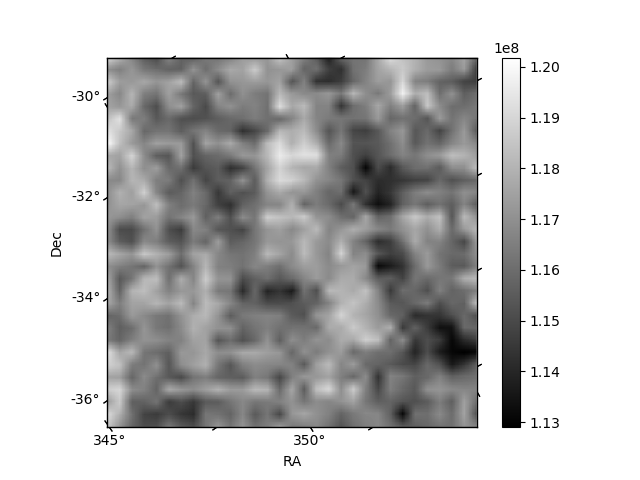
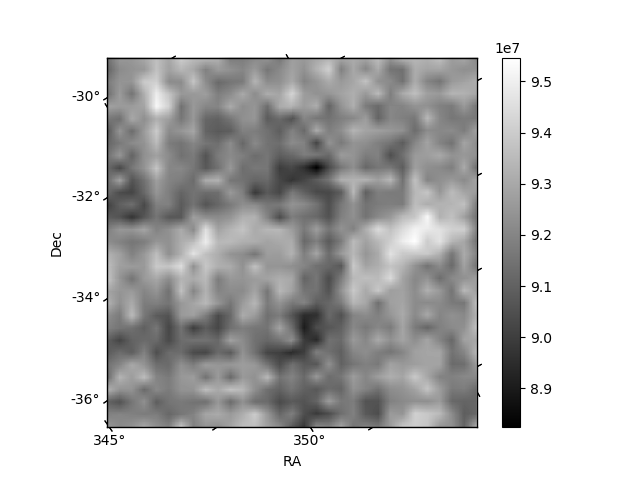
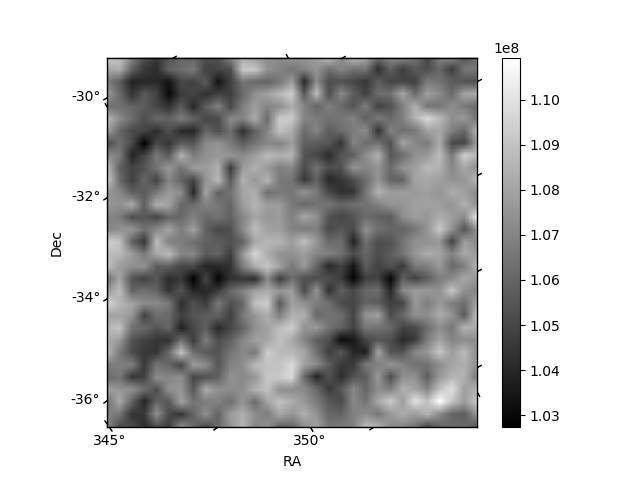
Histogram calculated using DETX and DETY for each event in the final _common_clean file
| Quadrant A | 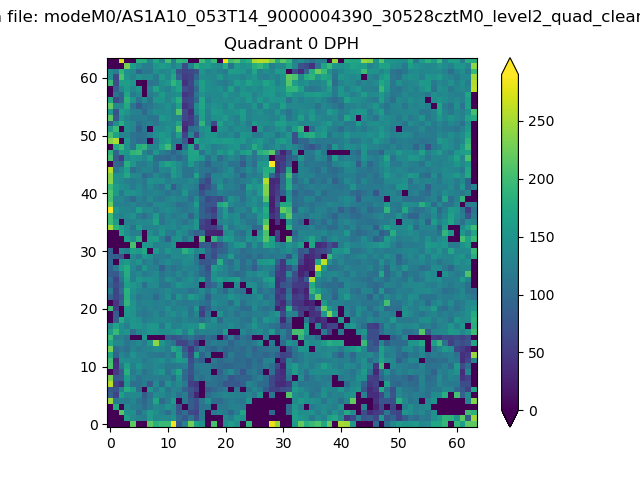 |
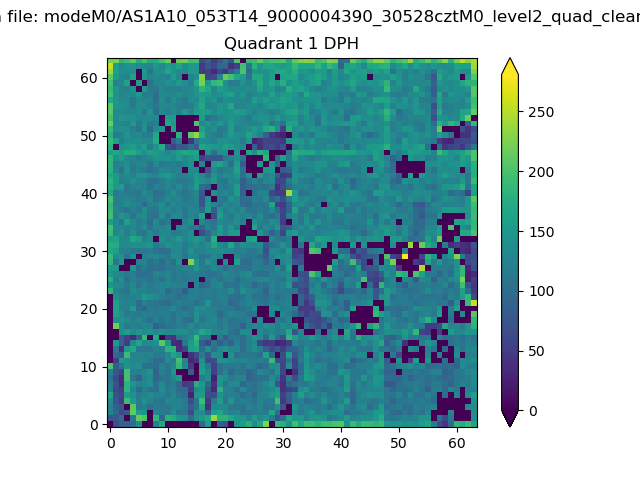 |
Quadrant B |
|---|---|---|---|
| Quadrant D | 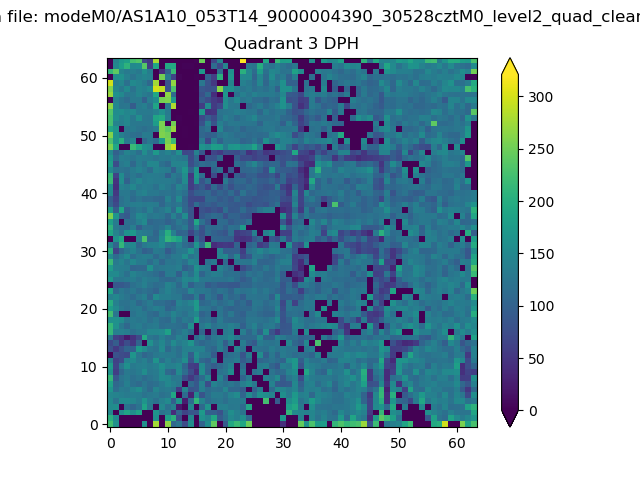 |
 |
Quadrant C |
| Plot type | Count rate plots | Images |
|---|---|---|
| Comparison with Poisson distribution Blue bars denote a histogram of data divided into 1 sec bins. Red curve is a Poisson curve with rate = median count rate of data. |
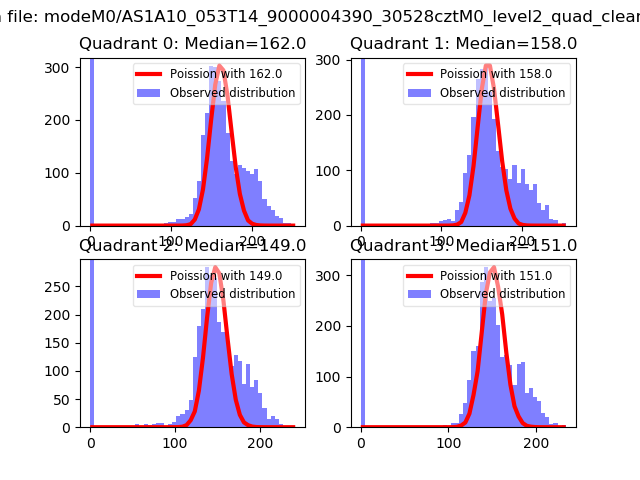 |
 |
| Quadrant-wise count rates Data is divided into 100 sec bins |
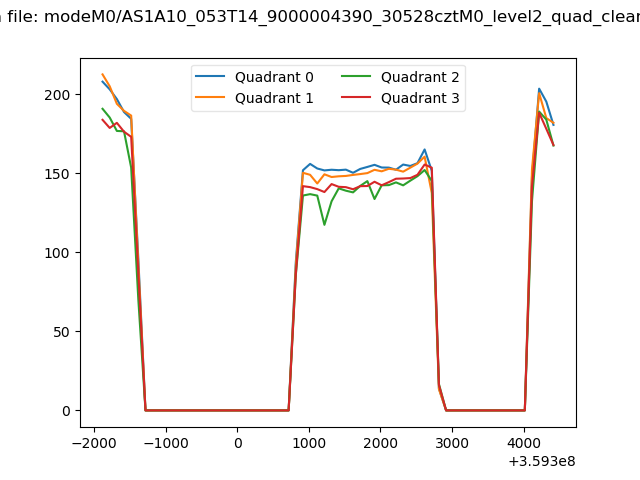 |
|
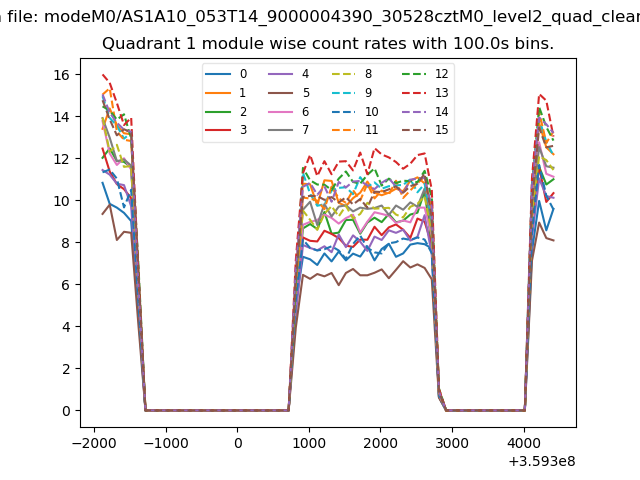
| Module-wise count rates for Quadrant A Data is divided into 100 sec bins |
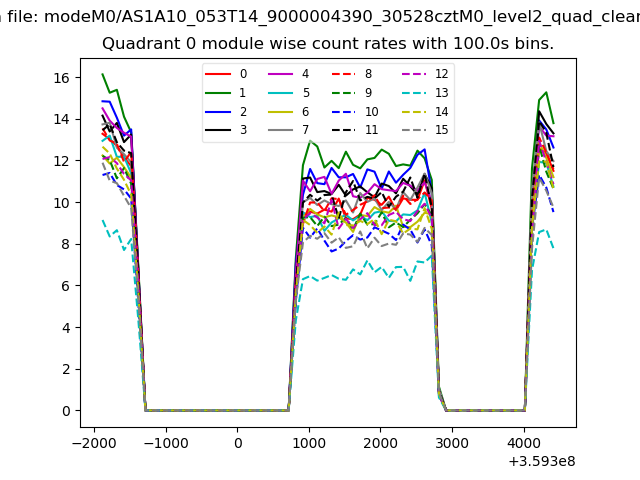 |
 |
| Module-wise count rates for Quadrant B Data is divided into 100 sec bins |
 |
 |
| Module-wise count rates for Quadrant C Data is divided into 100 sec bins |
 |
 |
| Module-wise count rates for Quadrant D Data is divided into 100 sec bins |
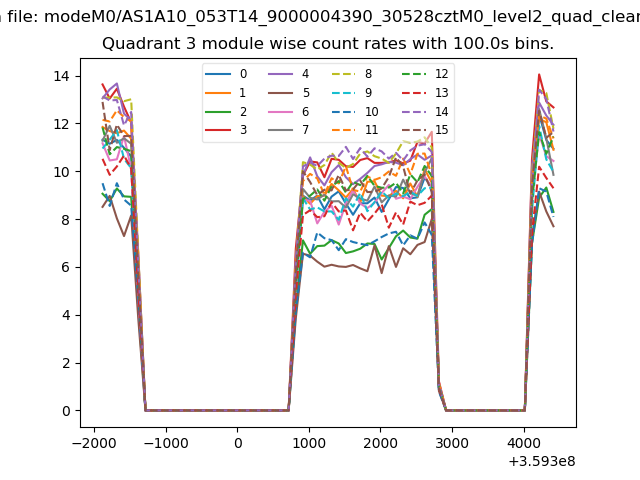 |
 |
| Parameter | Plot |
|---|---|
| CZT HV Monitor | 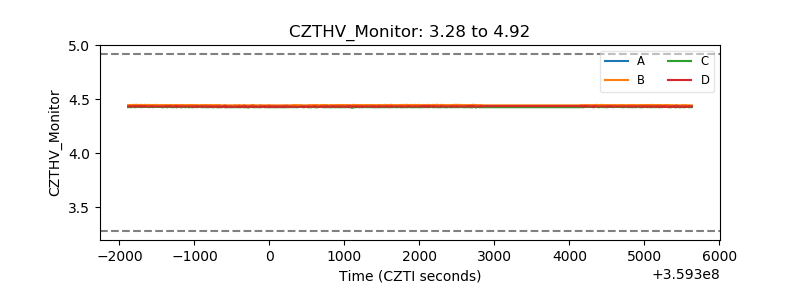 |
| D_VDD | 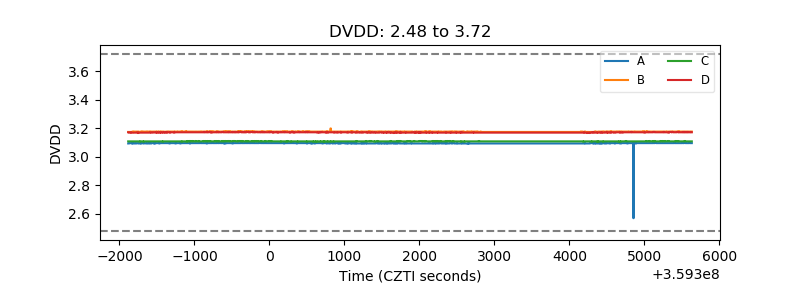 |
| Temperature 1 | 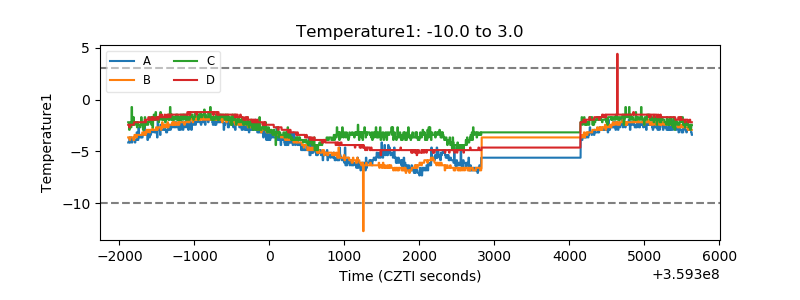 |
| Veto HV Monitor | 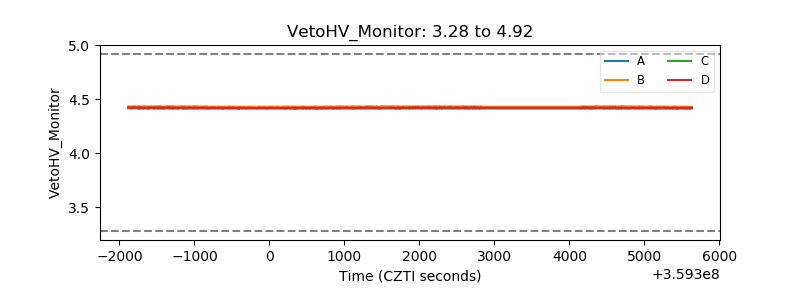 |
| Veto LLD | 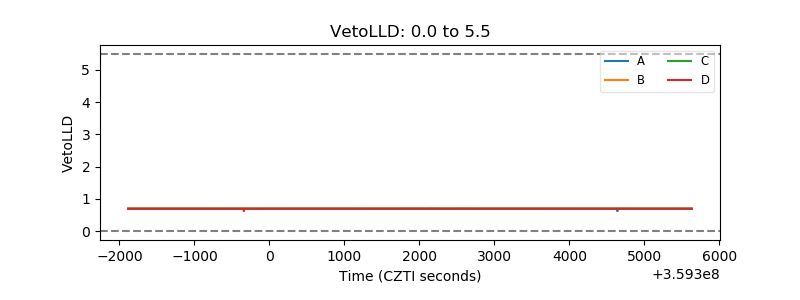 |
| Alpha Counter | 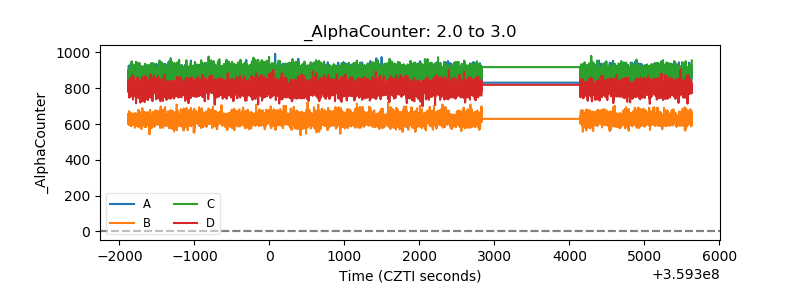 |
| _CPM_Rate | 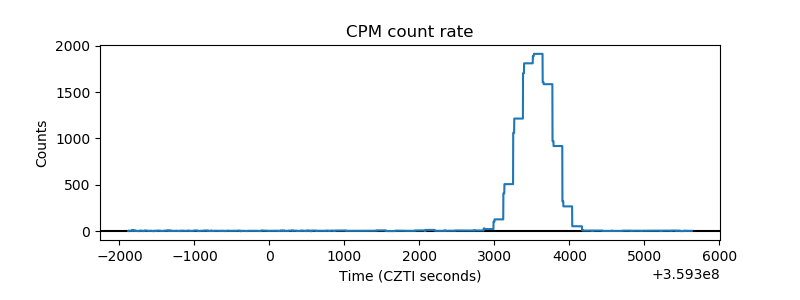 |
| CZT Counter | 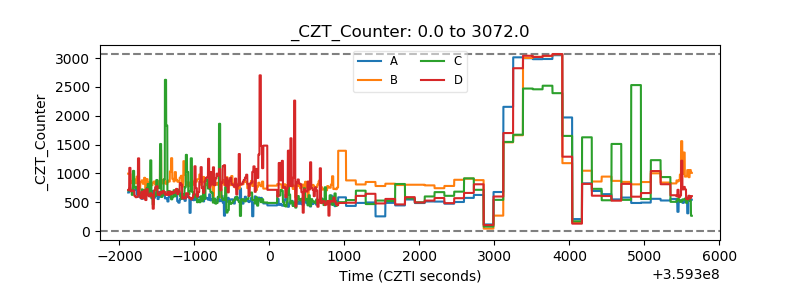 |
| +2.5 Volts monitor |  |
| +5 Volts monitor | 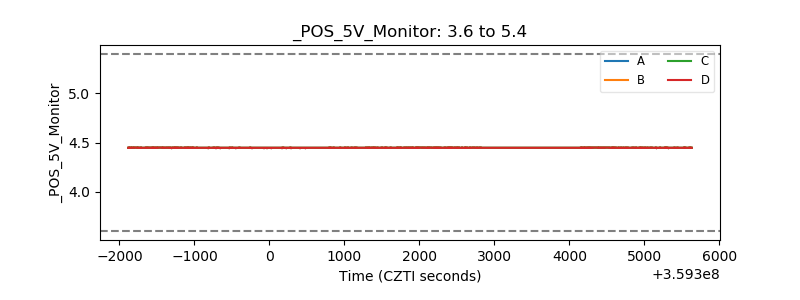 |
| _ROLL_ROT | 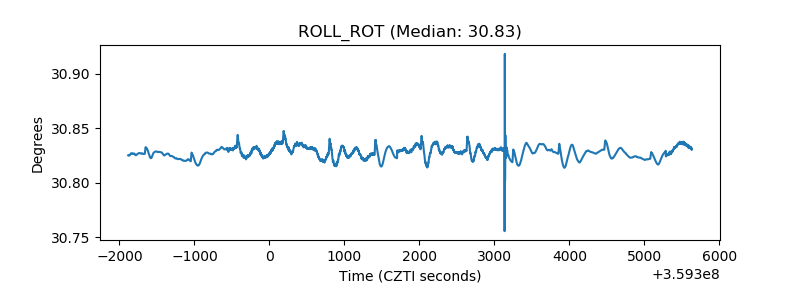 |
| _Roll_DEC | 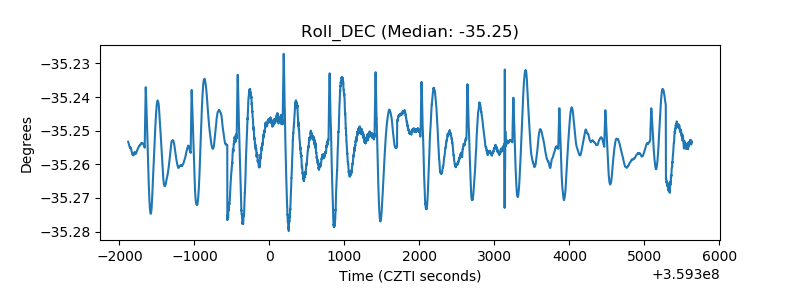 |
| _Roll_RA | 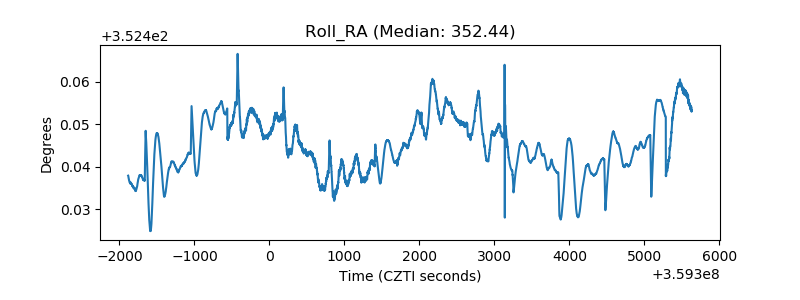 |
| Veto Counter |  |