| Param | Original file | Final file |
|---|---|---|
| Filename | modeM0/AS1A10_053T15_9000004392_30529cztM0_level2.evt | modeM0/AS1A10_053T15_9000004392_30529cztM0_level2_quad_clean.evt |
| Size (bytes) | 251,409,600 | 35,864,640 |
| Size | 239.8 MB | 34.2 MB |
| Events in quadrant A | 1,537,059 | 228,142 |
| Events in quadrant B | 2,370,176 | 226,052 |
| Events in quadrant C | 1,773,849 | 215,425 |
| Events in quadrant D | 1,744,036 | 218,450 |
| Mode M9 | |||
|---|---|---|---|
| Quadrant | BADHDUFLAG | Total packets | Discarded packets |
| A | 0 | 13 | 0 |
| B | 0 | 13 | 0 |
| C | 0 | 13 | 0 |
| D | 0 | 13 | 0 |
| Mode SS | |||
|---|---|---|---|
| Quadrant | BADHDUFLAG | Total packets | Discarded packets |
| A | 0 | 56 | 0 |
| B | 0 | 56 | 0 |
| C | 0 | 56 | 0 |
| D | 0 | 56 | 0 |
| Mode M0 | |||
|---|---|---|---|
| Quadrant | BADHDUFLAG | Total packets | Discarded packets |
| A | 0 | 6118 | 1 |
| B | 0 | 8726 | 3 |
| C | 0 | 6967 | 1 |
| D | 0 | 6916 | 1 |
| Quadrant | Total seconds | Saturated seconds | Saturation percentage |
|---|---|---|---|
| A | 2765 | 94 | 3.399638% |
| B | 2764 | 151 | 5.463097% |
| C | 2764 | 154 | 5.571635% |
| D | 2764 | 78 | 2.821997% |
Noise dominated data is calculated using 1-second bins in cleaned event files. If a bin has >2000 counts, and if more than 50% of those come from <1% of pixels, then it is considered to be noise-dominated and hence unusable.
| Quadrant | # 1 sec bins | Bins with >0 counts | Bins with >2000 counts | High rate bins dominated by noise | Noise dominated (total time) | Noise dominated (detector-on time) | Marked lightcurve |
|---|---|---|---|---|---|---|---|
| A | 4015 | 2766 | 3 | 3 | 0.07% | 0.11% | 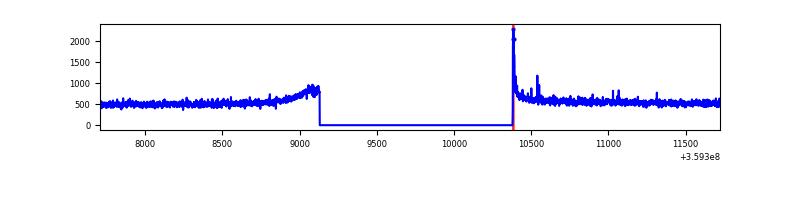 |
| B | 4014 | 2765 | 11 | 11 | 0.27% | 0.40% | 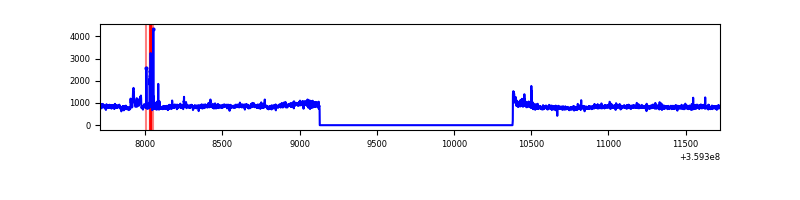 |
| C | 4014 | 2765 | 25 | 25 | 0.62% | 0.90% | 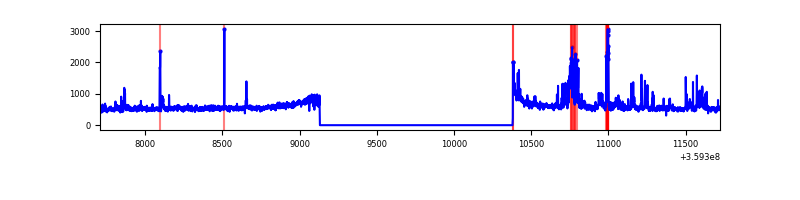 |
| D | 4014 | 2765 | 15 | 15 | 0.37% | 0.54% | 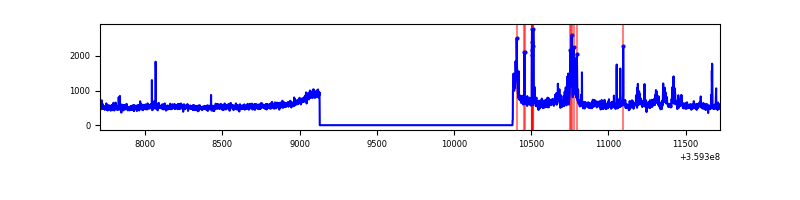 |
Top three noisy pixels from each quadrant. If the there are fewer than three noisy pixels in the level2.evt file, extra rows are filled as -1
| Pixel properties | Quadrant properties | ||||||
|---|---|---|---|---|---|---|---|
| Quadrant | DetID | PixID | Counts | Sigma | Mean | Median | Sigma |
| A | 8 | 192 | 12848 | 157.56 | 393 | 385 | 79.1 |
| A | 12 | 96 | 7193 | 86.07 | 393 | 385 | 79.1 |
| A | 13 | 254 | 5207 | 60.96 | 393 | 385 | 79.1 |
| B | 6 | 159 | 760151 | 10376.38 | 382 | 373 | 73.2 |
| B | 6 | 36 | 33916 | 458.1 | 382 | 373 | 73.2 |
| B | 4 | 171 | 28606 | 385.58 | 382 | 373 | 73.2 |
| C | 10 | 22 | 178712 | 2061.62 | 368 | 370 | 86.5 |
| C | 14 | 238 | 60289 | 692.66 | 368 | 370 | 86.5 |
| C | 15 | 208 | 40985 | 469.51 | 368 | 370 | 86.5 |
| D | 12 | 227 | 126815 | 1273.16 | 376 | 369 | 99.3 |
| D | 8 | 195 | 117986 | 1184.26 | 376 | 369 | 99.3 |
| D | 1 | 52 | 26919 | 267.33 | 376 | 369 | 99.3 |
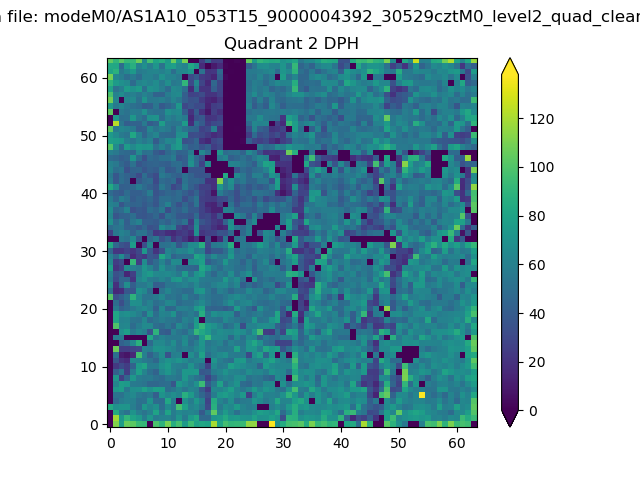
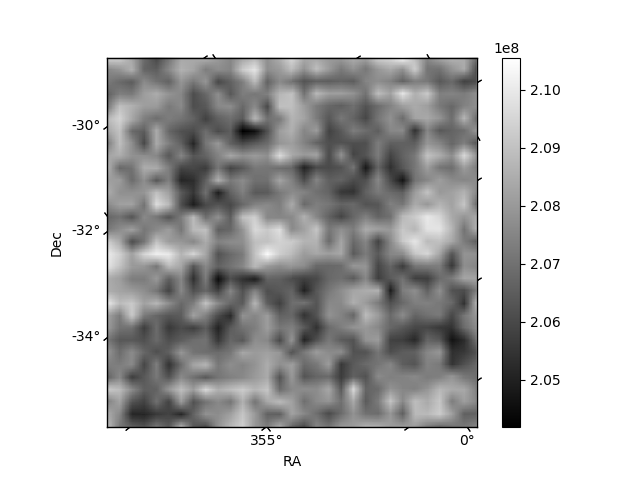
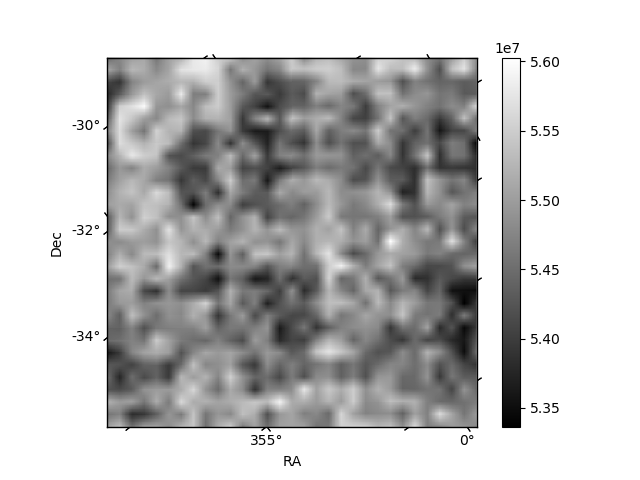
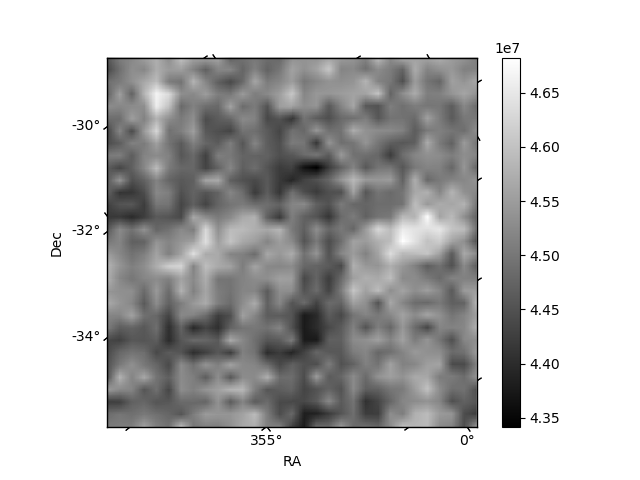
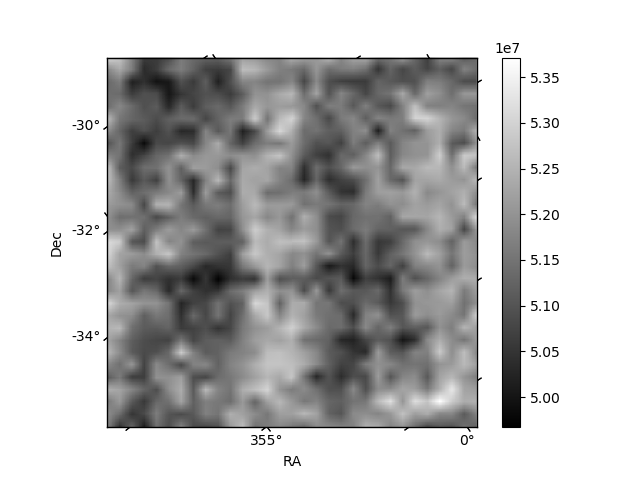
Histogram calculated using DETX and DETY for each event in the final _common_clean file
| Quadrant A | 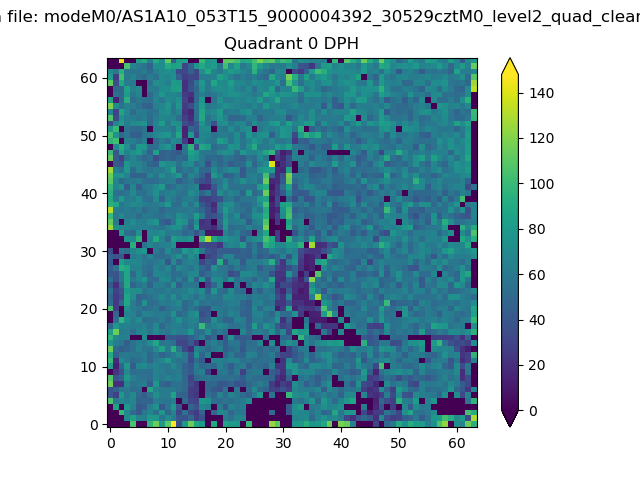 |
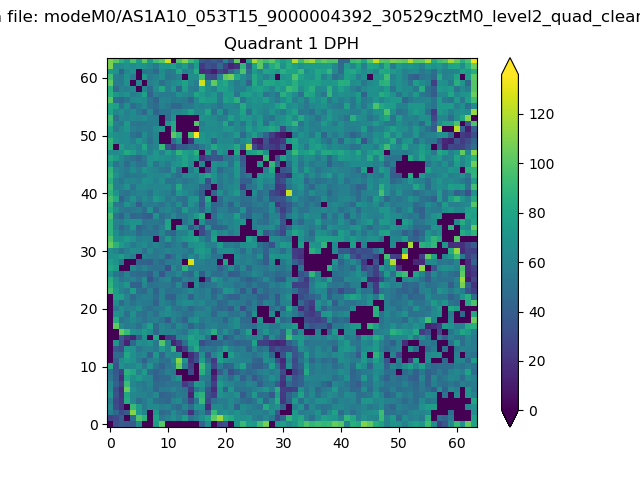 |
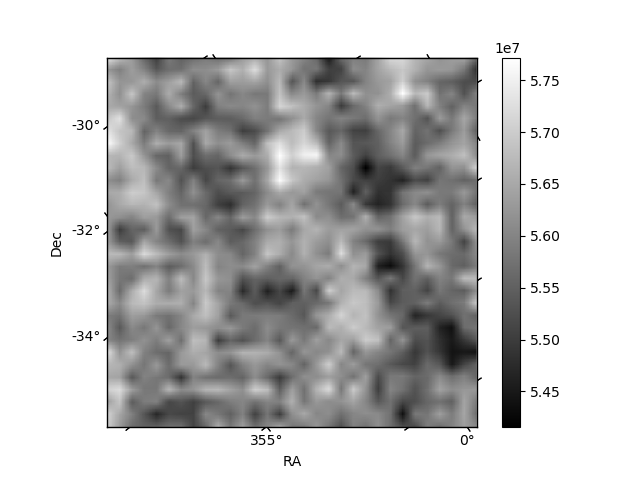
Quadrant B |
|---|---|---|---|
| Quadrant D | 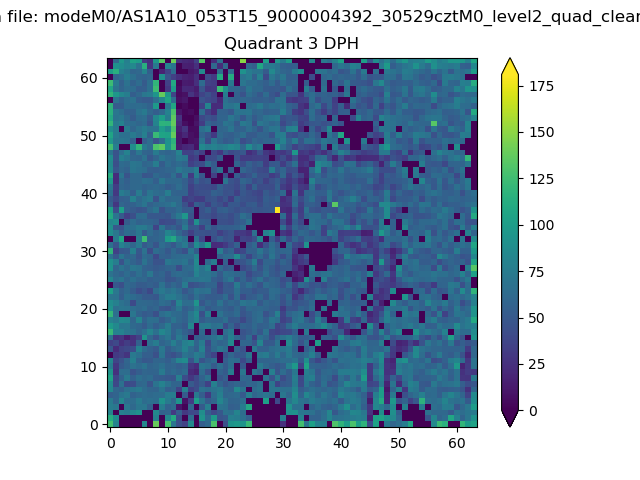 |
 |
Quadrant C |
| Plot type | Count rate plots | Images |
|---|---|---|
| Comparison with Poisson distribution Blue bars denote a histogram of data divided into 1 sec bins. Red curve is a Poisson curve with rate = median count rate of data. |
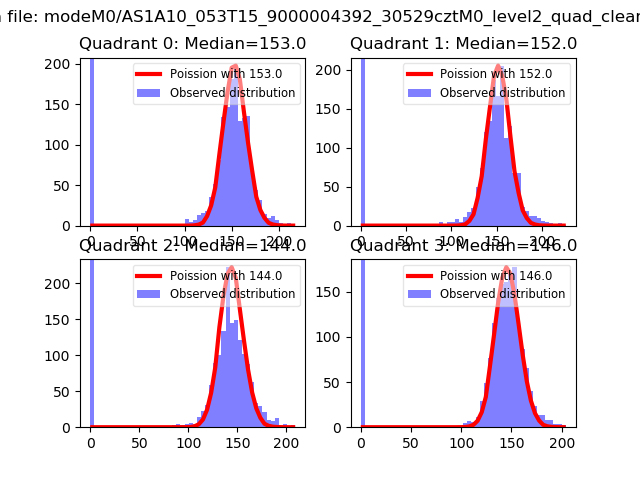 |
 |
| Quadrant-wise count rates Data is divided into 100 sec bins |
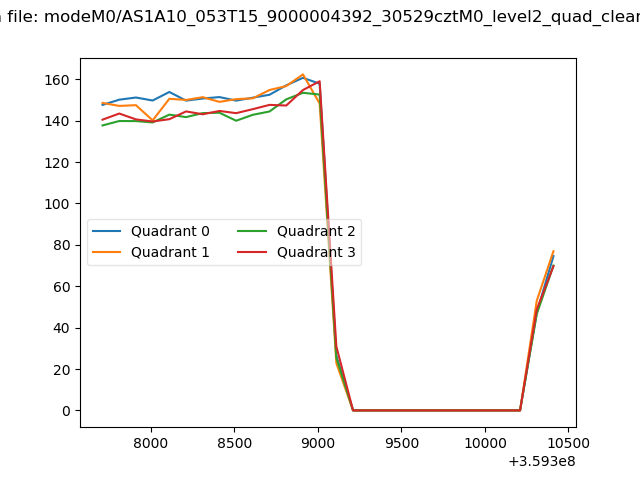 |
|
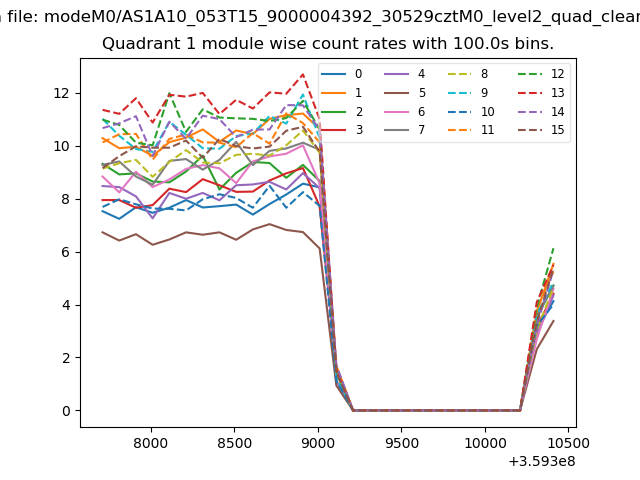
| Module-wise count rates for Quadrant A Data is divided into 100 sec bins |
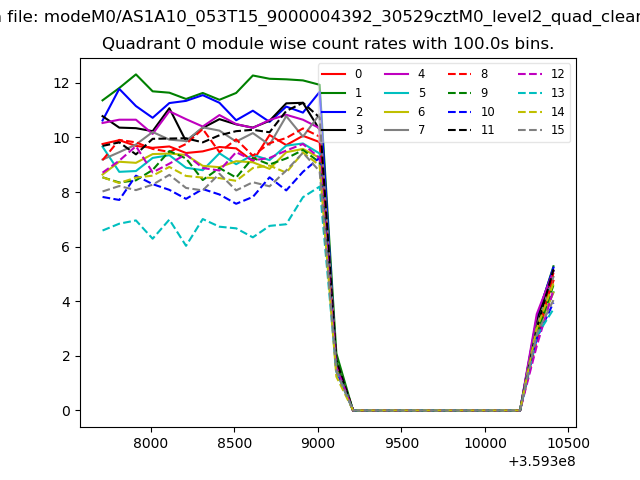 |
 |
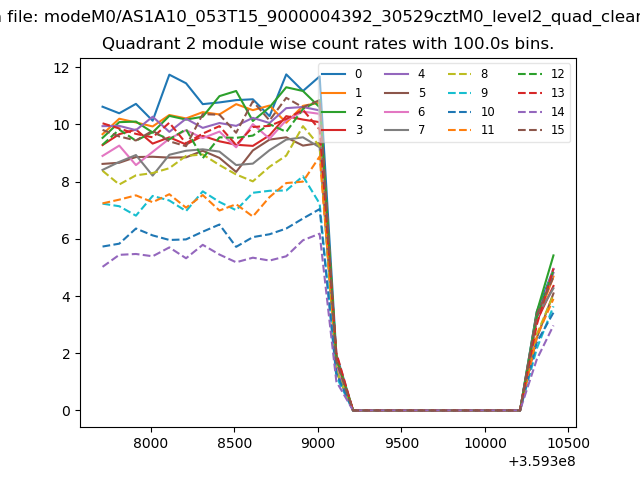
| Module-wise count rates for Quadrant B Data is divided into 100 sec bins |
 |
 |
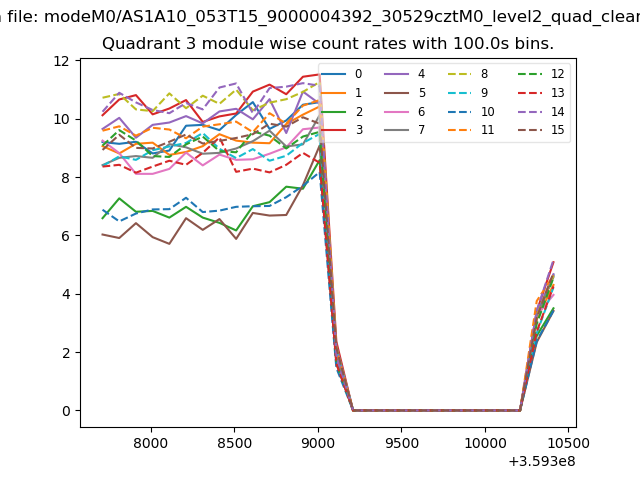
| Module-wise count rates for Quadrant C Data is divided into 100 sec bins |
 |
 |
| Module-wise count rates for Quadrant D Data is divided into 100 sec bins |
 |
 |
| Parameter | Plot |
|---|---|
| CZT HV Monitor | 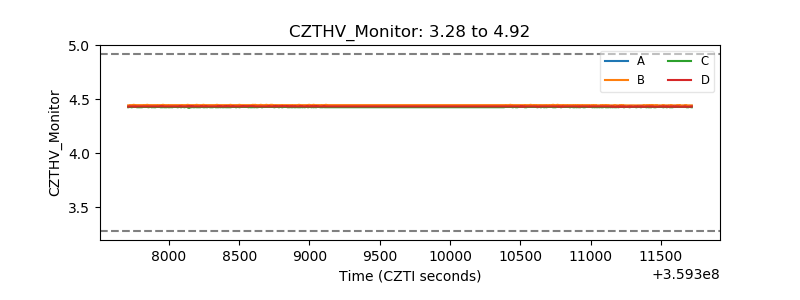 |
| D_VDD | 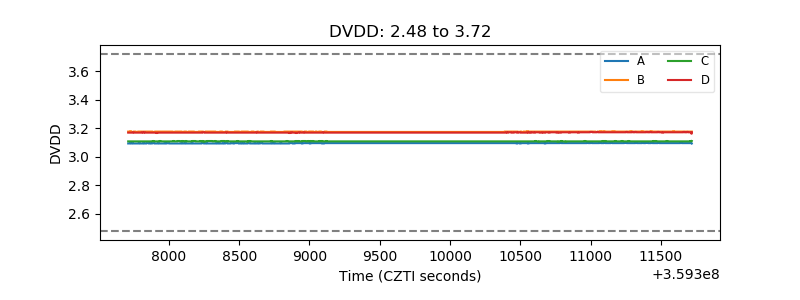 |
| Temperature 1 | 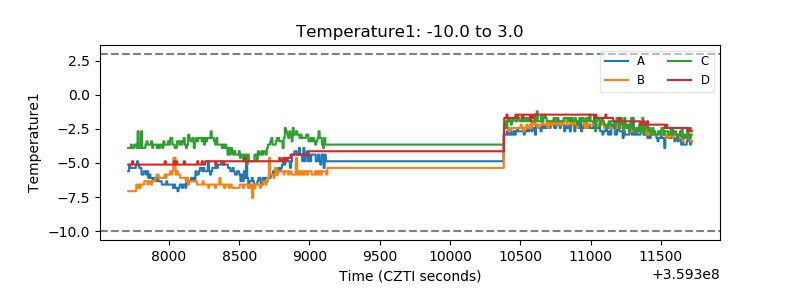 |
| Veto HV Monitor | 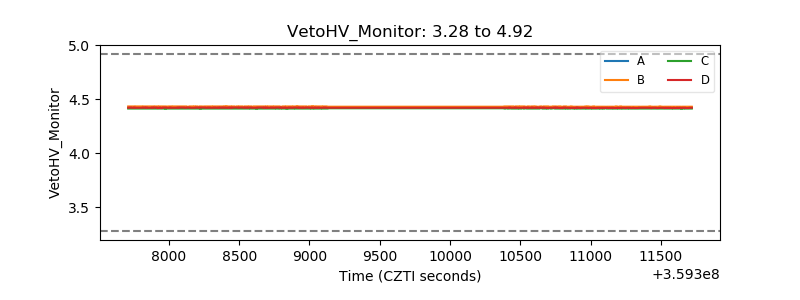 |
| Veto LLD | 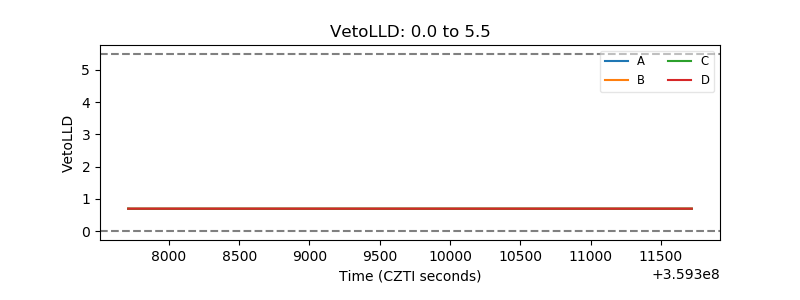 |
| Alpha Counter | 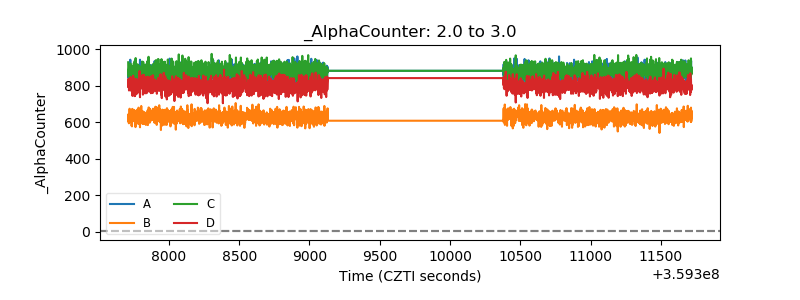 |
| _CPM_Rate | 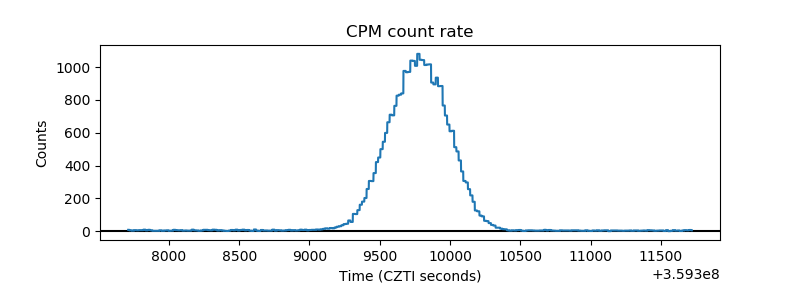 |
| CZT Counter | 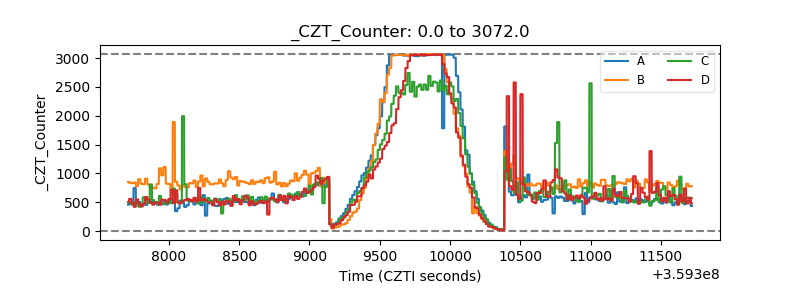 |
| +2.5 Volts monitor | 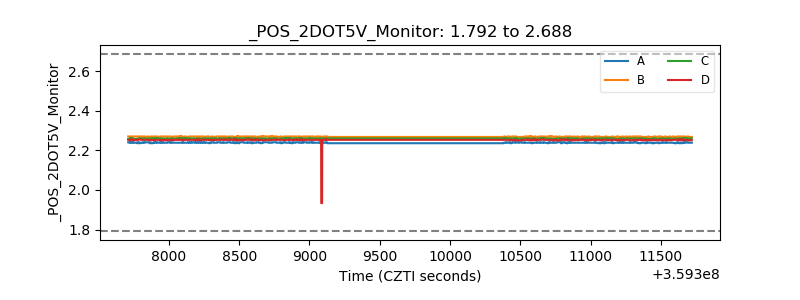 |
| +5 Volts monitor | 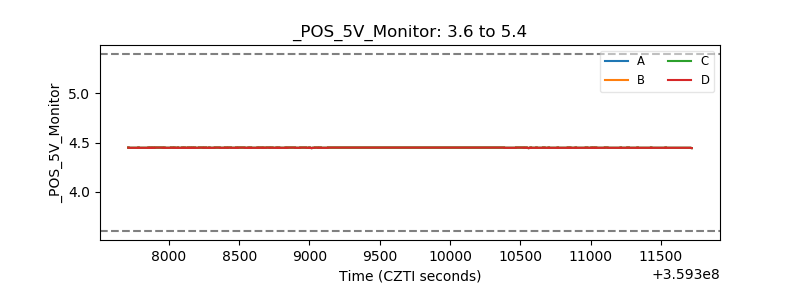 |
| _ROLL_ROT | 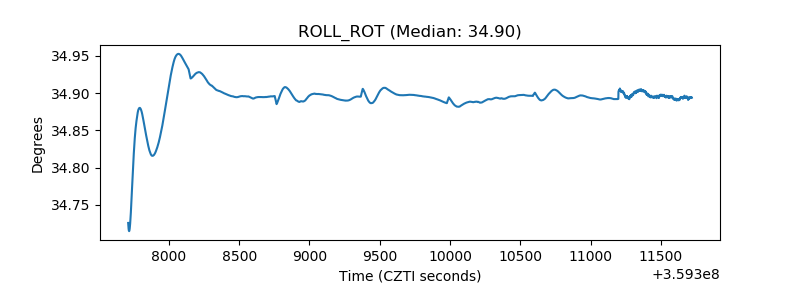 |
| _Roll_DEC | 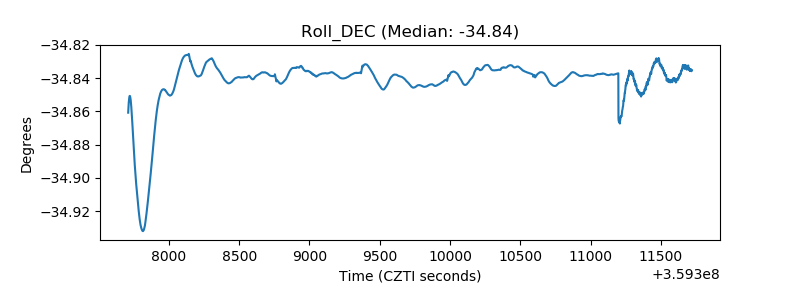 |
| _Roll_RA | 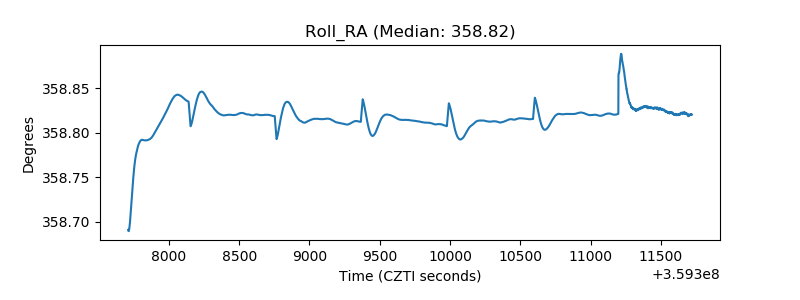 |
| Veto Counter | 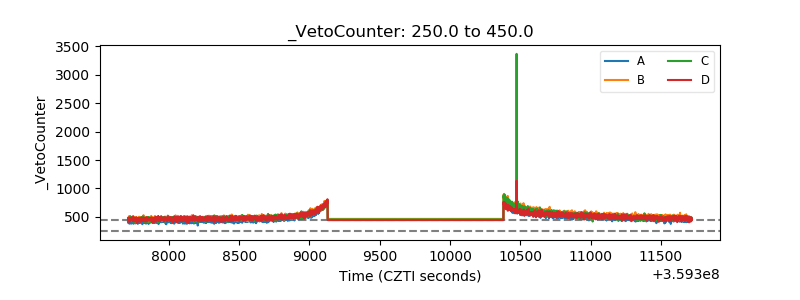 |