| Param | Original file | Final file |
|---|---|---|
| Filename | modeM0/AS1A10_053T15_9000004392_30531cztM0_level2.evt | modeM0/AS1A10_053T15_9000004392_30531cztM0_level2_quad_clean.evt |
| Size (bytes) | 608,567,040 | 78,687,360 |
| Size | 580.4 MB | 75.0 MB |
| Events in quadrant A | 3,240,149 | 496,274 |
| Events in quadrant B | 5,333,129 | 490,583 |
| Events in quadrant C | 3,403,422 | 470,663 |
| Events in quadrant D | 6,006,583 | 463,879 |
| Mode M9 | |||
|---|---|---|---|
| Quadrant | BADHDUFLAG | Total packets | Discarded packets |
| A | 0 | 6 | 0 |
| B | 0 | 6 | 0 |
| C | 0 | 6 | 0 |
| D | 0 | 6 | 0 |
| Mode SS | |||
|---|---|---|---|
| Quadrant | BADHDUFLAG | Total packets | Discarded packets |
| A | 0 | 134 | 0 |
| B | 0 | 134 | 0 |
| C | 0 | 134 | 0 |
| D | 0 | 134 | 0 |
| Mode M0 | |||
|---|---|---|---|
| Quadrant | BADHDUFLAG | Total packets | Discarded packets |
| A | 0 | 13669 | 1 |
| B | 0 | 20477 | 1 |
| C | 0 | 14125 | 1 |
| D | 0 | 22302 | 1 |
| Quadrant | Total seconds | Saturated seconds | Saturation percentage |
|---|---|---|---|
| A | 6614 | 85 | 1.285153% |
| B | 6615 | 217 | 3.280423% |
| C | 6615 | 167 | 2.524565% |
| D | 6615 | 366 | 5.532880% |
Noise dominated data is calculated using 1-second bins in cleaned event files. If a bin has >2000 counts, and if more than 50% of those come from <1% of pixels, then it is considered to be noise-dominated and hence unusable.
| Quadrant | # 1 sec bins | Bins with >0 counts | Bins with >2000 counts | High rate bins dominated by noise | Noise dominated (total time) | Noise dominated (detector-on time) | Marked lightcurve |
|---|---|---|---|---|---|---|---|
| A | 7209 | 6615 | 1 | 1 | 0.01% | 0.02% | 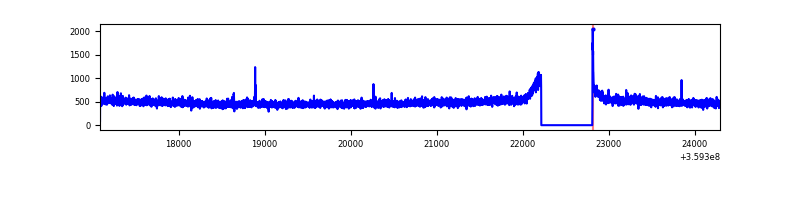 |
| B | 7210 | 6616 | 18 | 18 | 0.25% | 0.27% | 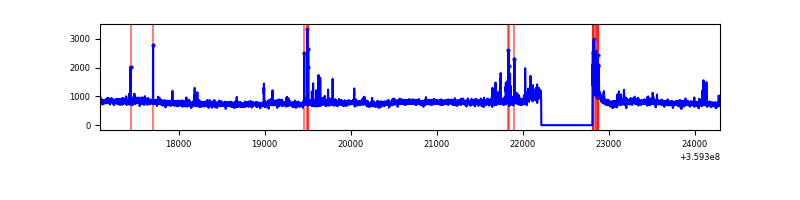 |
| C | 7210 | 6616 | 48 | 48 | 0.67% | 0.73% | 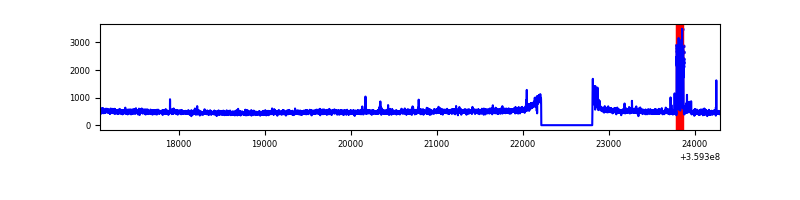 |
| D | 7210 | 6616 | 309 | 309 | 4.29% | 4.67% | 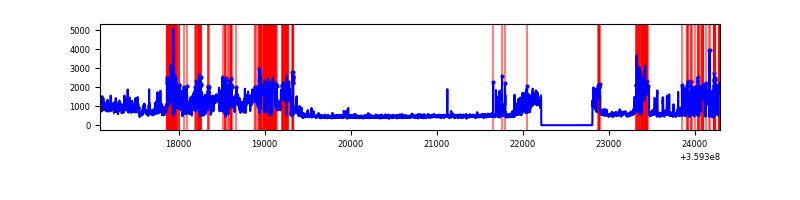 |
Top three noisy pixels from each quadrant. If the there are fewer than three noisy pixels in the level2.evt file, extra rows are filled as -1
| Pixel properties | Quadrant properties | ||||||
|---|---|---|---|---|---|---|---|
| Quadrant | DetID | PixID | Counts | Sigma | Mean | Median | Sigma |
| A | 8 | 192 | 13332 | 74.37 | 832 | 816 | 168.3 |
| A | 13 | 254 | 12235 | 67.85 | 832 | 816 | 168.3 |
| A | 15 | 192 | 9448 | 51.29 | 832 | 816 | 168.3 |
| B | 6 | 159 | 1892429 | 12155.71 | 811 | 791 | 155.6 |
| B | 6 | 36 | 138571 | 885.38 | 811 | 791 | 155.6 |
| B | 0 | 229 | 66207 | 420.36 | 811 | 791 | 155.6 |
| C | 3 | 233 | 149310 | 801.98 | 784 | 790 | 185.2 |
| C | 14 | 238 | 128812 | 691.29 | 784 | 790 | 185.2 |
| C | 10 | 22 | 31553 | 166.11 | 784 | 790 | 185.2 |
| D | 1 | 52 | 2172281 | 10612.49 | 786 | 770 | 204.6 |
| D | 8 | 195 | 633718 | 3093.31 | 786 | 770 | 204.6 |
| D | 13 | 249 | 142358 | 691.96 | 786 | 770 | 204.6 |
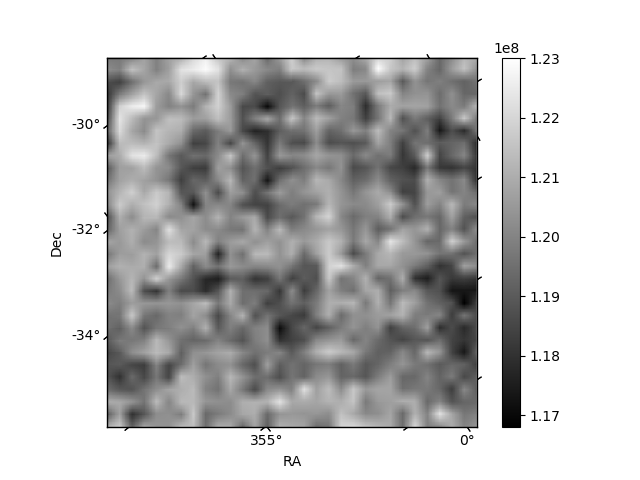
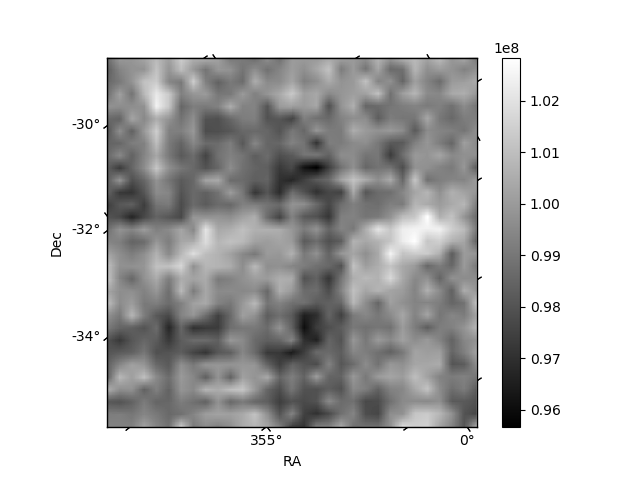
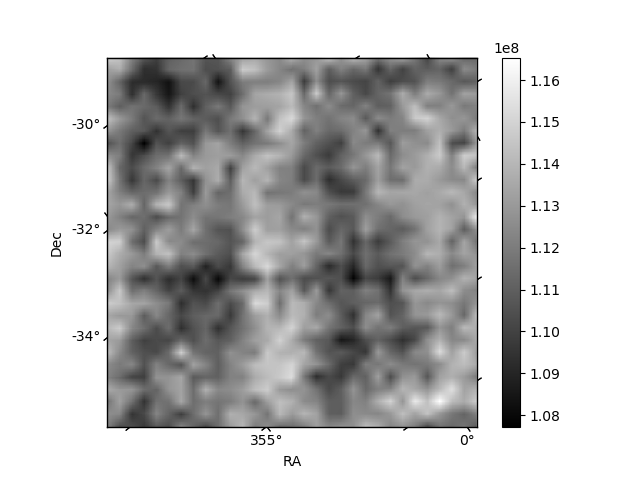
Histogram calculated using DETX and DETY for each event in the final _common_clean file
| Quadrant A | 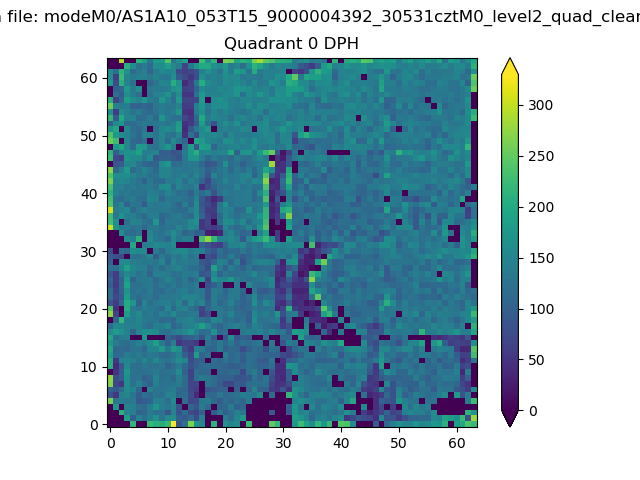 |
 |
Quadrant B |
|---|---|---|---|
| Quadrant D | 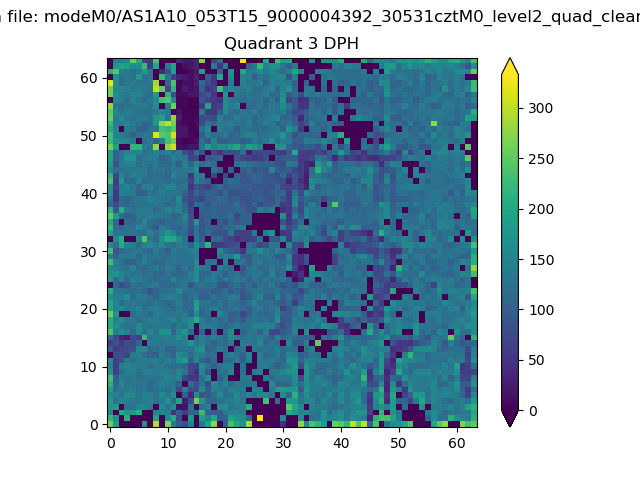 |
 |
Quadrant C |
| Plot type | Count rate plots | Images |
|---|---|---|
| Comparison with Poisson distribution Blue bars denote a histogram of data divided into 1 sec bins. Red curve is a Poisson curve with rate = median count rate of data. |
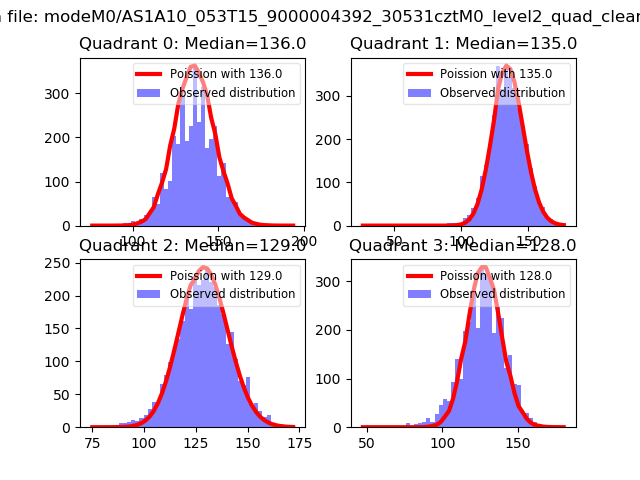 |
 |
| Quadrant-wise count rates Data is divided into 100 sec bins |
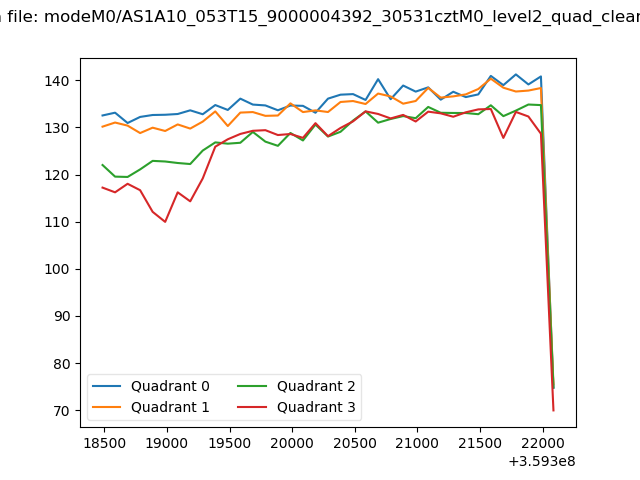 |
|
| Module-wise count rates for Quadrant A Data is divided into 100 sec bins |
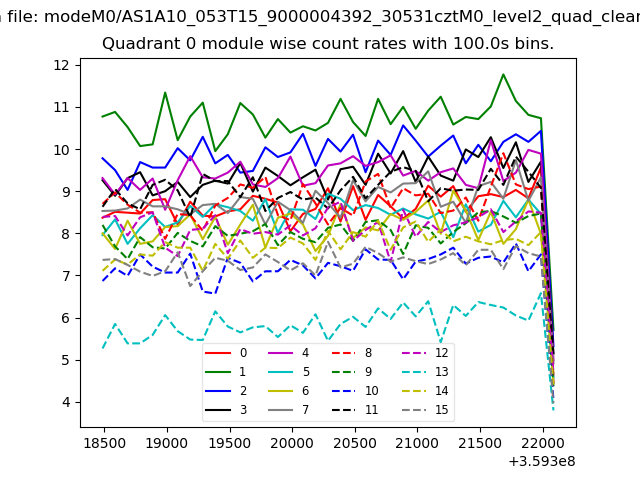 |
 |
| Module-wise count rates for Quadrant B Data is divided into 100 sec bins |
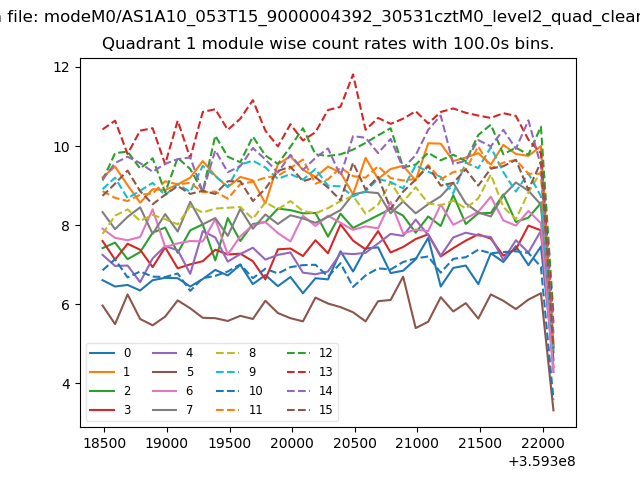 |
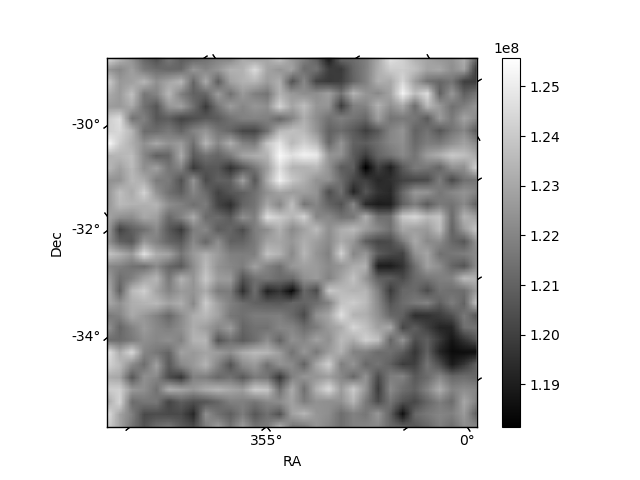 |
| Module-wise count rates for Quadrant C Data is divided into 100 sec bins |
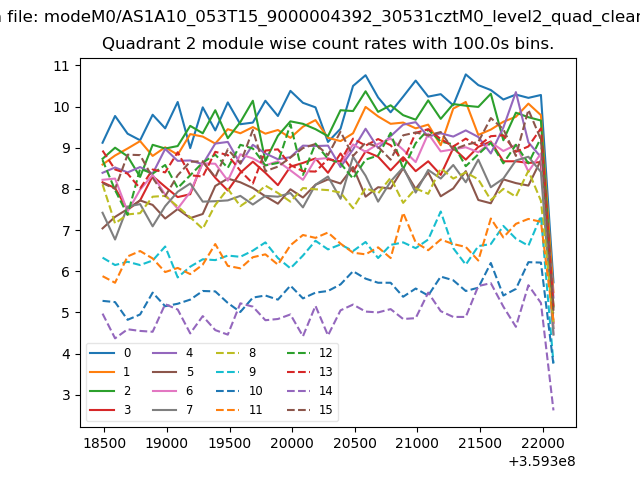 |
 |
| Module-wise count rates for Quadrant D Data is divided into 100 sec bins |
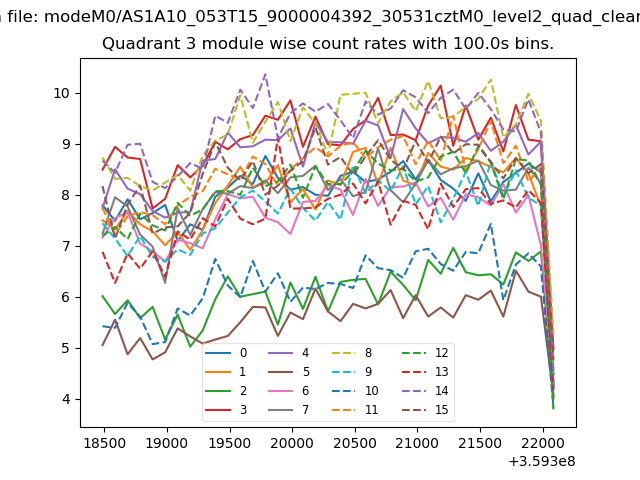 |
 |
| Parameter | Plot |
|---|---|
| CZT HV Monitor | 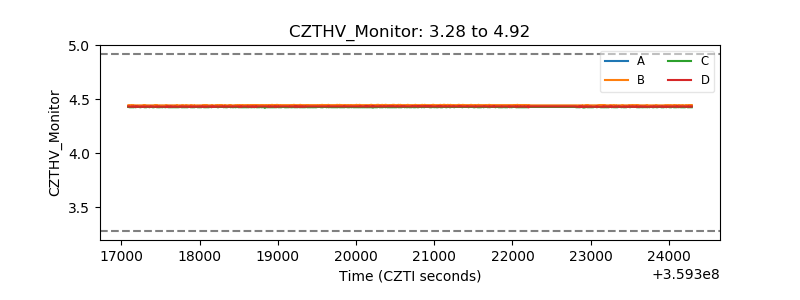 |
| D_VDD | 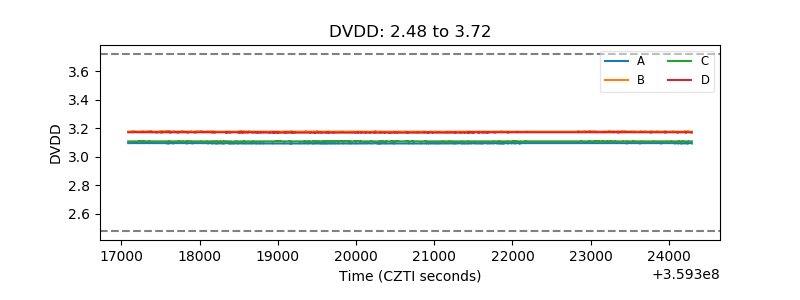 |
| Temperature 1 | 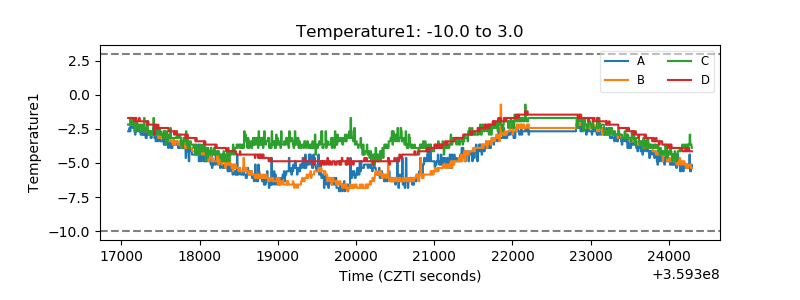 |
| Veto HV Monitor | 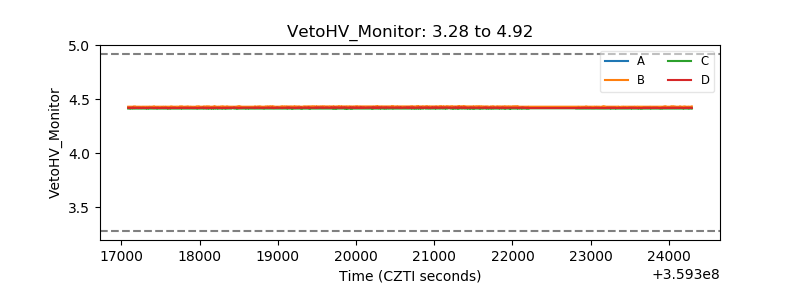 |
| Veto LLD | 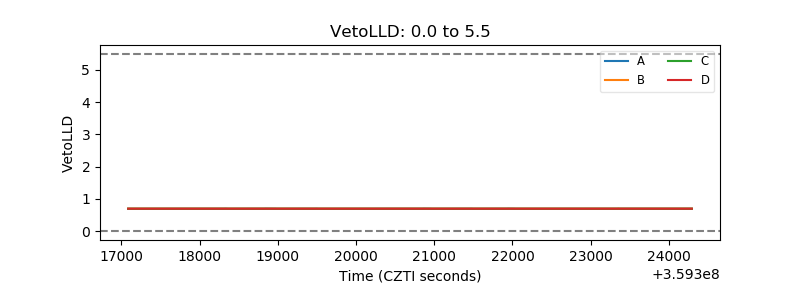 |
| Alpha Counter | 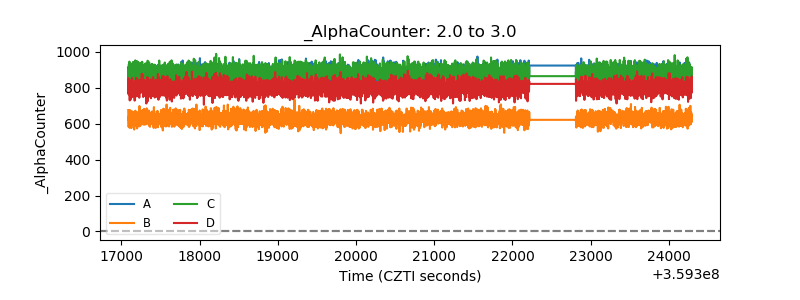 |
| _CPM_Rate | 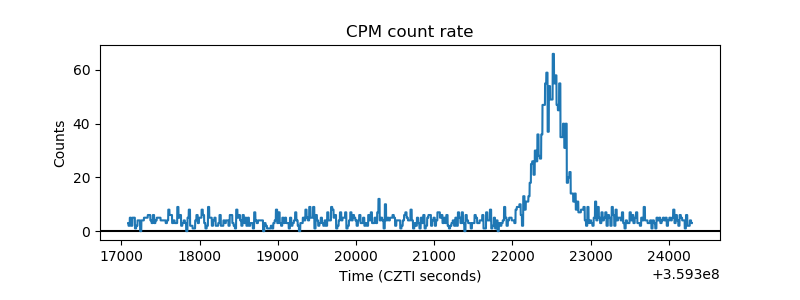 |
| CZT Counter | 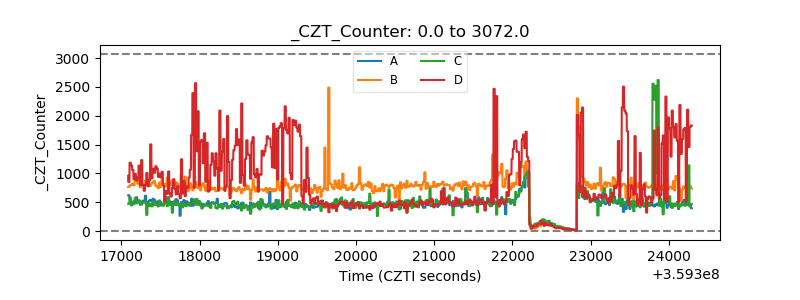 |
| +2.5 Volts monitor |  |
| +5 Volts monitor |  |
| _ROLL_ROT | 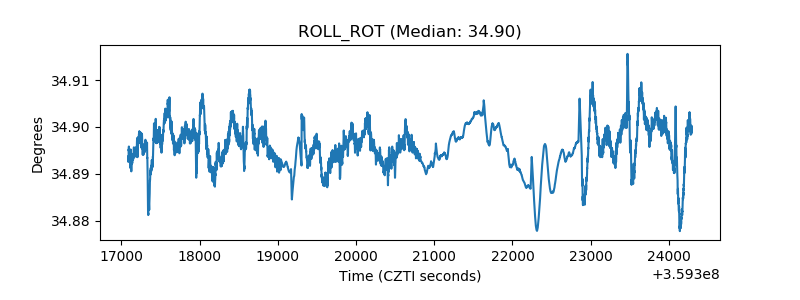 |
| _Roll_DEC | 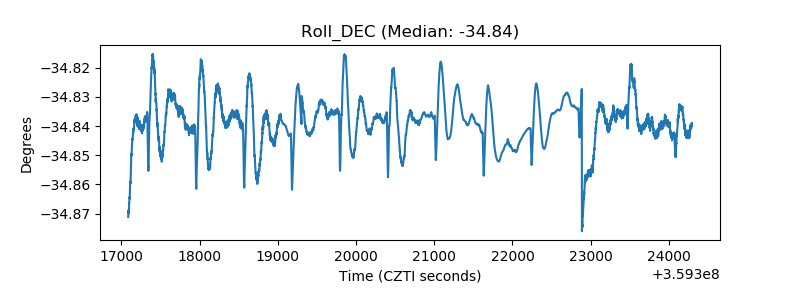 |
| _Roll_RA | 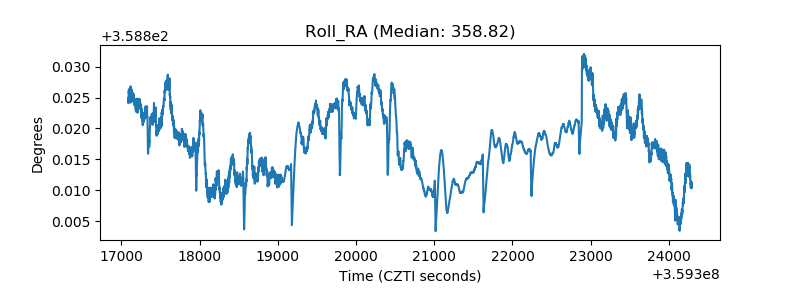 |
| Veto Counter | 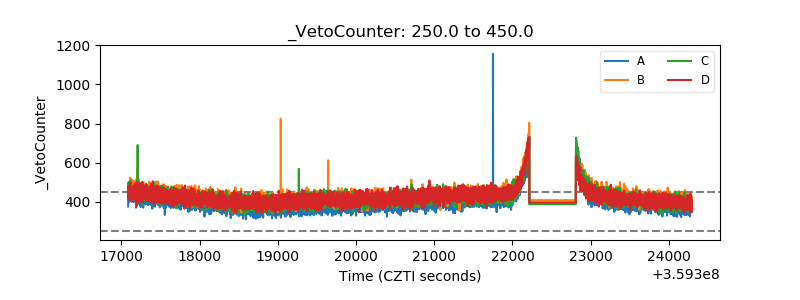 |