| Param | Original file | Final file |
|---|---|---|
| Filename | modeM0/AS1A10_053T15_9000004392_30533cztM0_level2.evt | modeM0/AS1A10_053T15_9000004392_30533cztM0_level2_quad_clean.evt |
| Size (bytes) | 488,923,200 | 73,497,600 |
| Size | 466.3 MB | 70.1 MB |
| Events in quadrant A | 2,831,634 | 465,013 |
| Events in quadrant B | 4,707,815 | 462,154 |
| Events in quadrant C | 2,909,523 | 445,354 |
| Events in quadrant D | 3,954,793 | 437,697 |
| Mode M9 | |||
|---|---|---|---|
| Quadrant | BADHDUFLAG | Total packets | Discarded packets |
| A | 0 | 2 | 0 |
| B | 0 | 2 | 0 |
| C | 0 | 2 | 0 |
| D | 0 | 2 | 0 |
| Mode SS | |||
|---|---|---|---|
| Quadrant | BADHDUFLAG | Total packets | Discarded packets |
| A | 0 | 120 | 0 |
| B | 0 | 120 | 0 |
| C | 0 | 120 | 0 |
| D | 0 | 120 | 0 |
| Mode M0 | |||
|---|---|---|---|
| Quadrant | BADHDUFLAG | Total packets | Discarded packets |
| A | 0 | 12223 | 1 |
| B | 0 | 18385 | 1 |
| C | 0 | 12341 | 1 |
| D | 0 | 15583 | 1 |
| Quadrant | Total seconds | Saturated seconds | Saturation percentage |
|---|---|---|---|
| A | 5945 | 75 | 1.261564% |
| B | 5945 | 196 | 3.296888% |
| C | 5946 | 144 | 2.421796% |
| D | 5946 | 304 | 5.112681% |
Noise dominated data is calculated using 1-second bins in cleaned event files. If a bin has >2000 counts, and if more than 50% of those come from <1% of pixels, then it is considered to be noise-dominated and hence unusable.
| Quadrant | # 1 sec bins | Bins with >0 counts | Bins with >2000 counts | High rate bins dominated by noise | Noise dominated (total time) | Noise dominated (detector-on time) | Marked lightcurve |
|---|---|---|---|---|---|---|---|
| A | 6095 | 5946 | 1 | 1 | 0.02% | 0.02% | 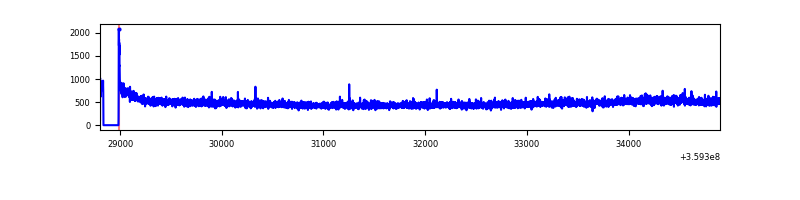 |
| B | 6095 | 5946 | 23 | 23 | 0.38% | 0.39% | 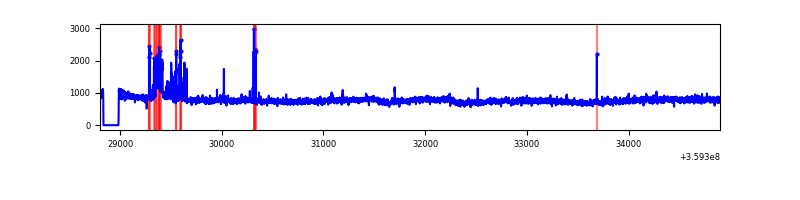 |
| C | 6096 | 5947 | 1 | 1 | 0.02% | 0.02% | 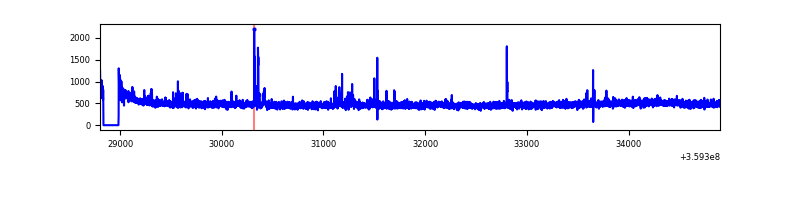 |
| D | 6096 | 5947 | 194 | 194 | 3.18% | 3.26% |  |
Top three noisy pixels from each quadrant. If the there are fewer than three noisy pixels in the level2.evt file, extra rows are filled as -1
| Pixel properties | Quadrant properties | ||||||
|---|---|---|---|---|---|---|---|
| Quadrant | DetID | PixID | Counts | Sigma | Mean | Median | Sigma |
| A | 8 | 192 | 12945 | 82.85 | 728 | 713 | 147.6 |
| A | 13 | 254 | 10823 | 68.48 | 728 | 713 | 147.6 |
| A | 15 | 192 | 10385 | 65.51 | 728 | 713 | 147.6 |
| B | 6 | 159 | 1695806 | 12289.47 | 714 | 697 | 137.9 |
| B | 6 | 36 | 146380 | 1056.2 | 714 | 697 | 137.9 |
| B | 0 | 229 | 26063 | 183.9 | 714 | 697 | 137.9 |
| C | 14 | 238 | 132530 | 809.39 | 689 | 692 | 162.9 |
| C | 10 | 22 | 35490 | 213.63 | 689 | 692 | 162.9 |
| C | 14 | 254 | 30169 | 180.97 | 689 | 692 | 162.9 |
| D | 1 | 52 | 681002 | 4099.55 | 693 | 674 | 166.0 |
| D | 8 | 195 | 294922 | 1773.09 | 693 | 674 | 166.0 |
| D | 13 | 104 | 248759 | 1494.92 | 693 | 674 | 166.0 |
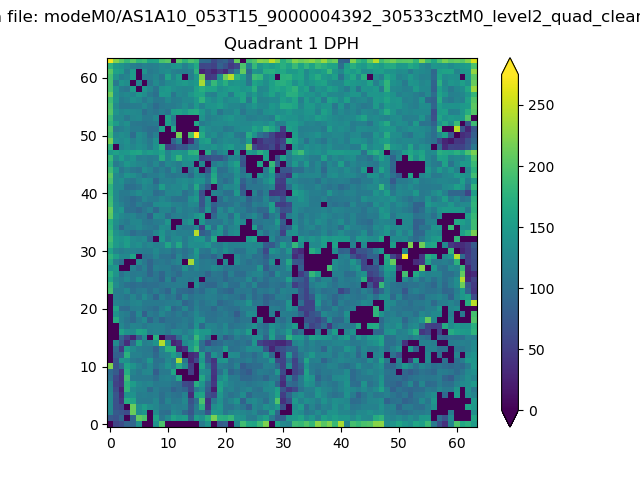
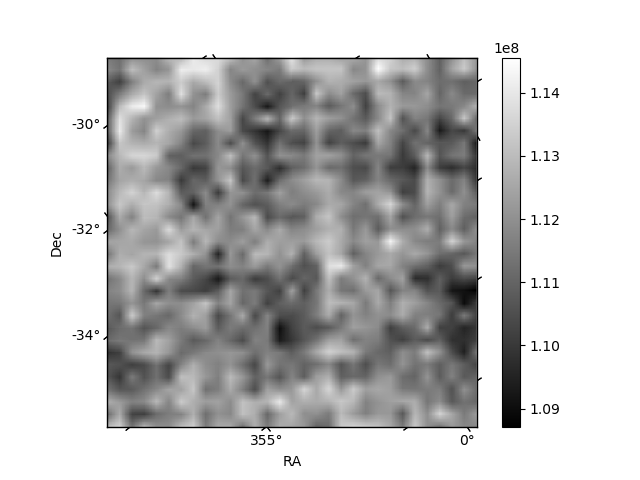
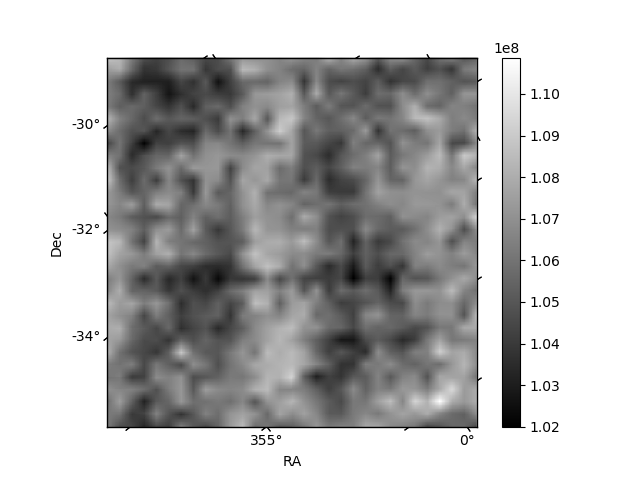
Histogram calculated using DETX and DETY for each event in the final _common_clean file
| Quadrant A |  |
 |
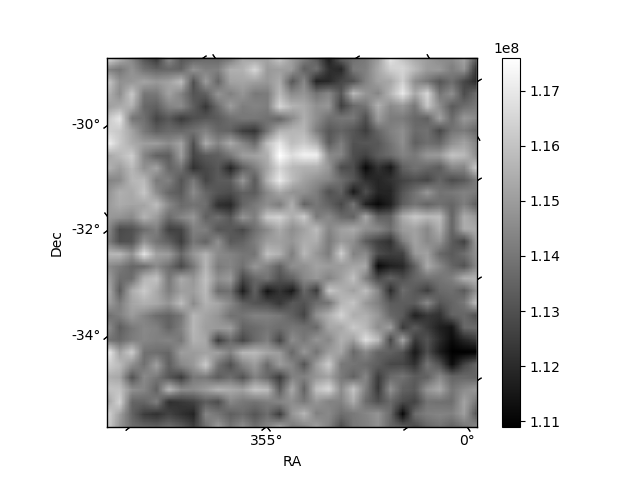
Quadrant B |
|---|---|---|---|
| Quadrant D | 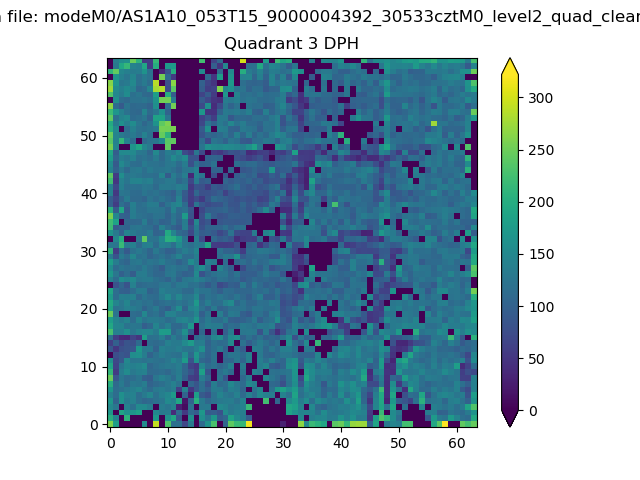 |
 |
Quadrant C |
| Plot type | Count rate plots | Images |
|---|---|---|
| Comparison with Poisson distribution Blue bars denote a histogram of data divided into 1 sec bins. Red curve is a Poisson curve with rate = median count rate of data. |
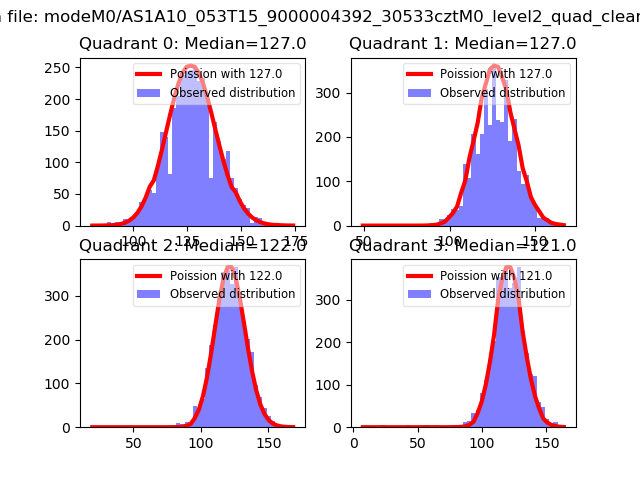 |
 |
| Quadrant-wise count rates Data is divided into 100 sec bins |
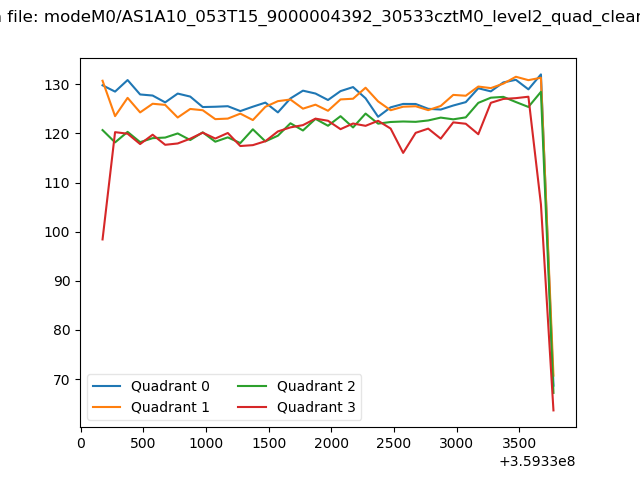 |
|
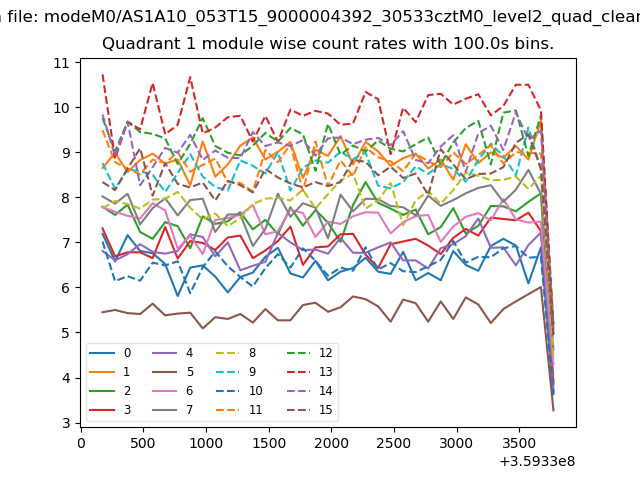
| Module-wise count rates for Quadrant A Data is divided into 100 sec bins |
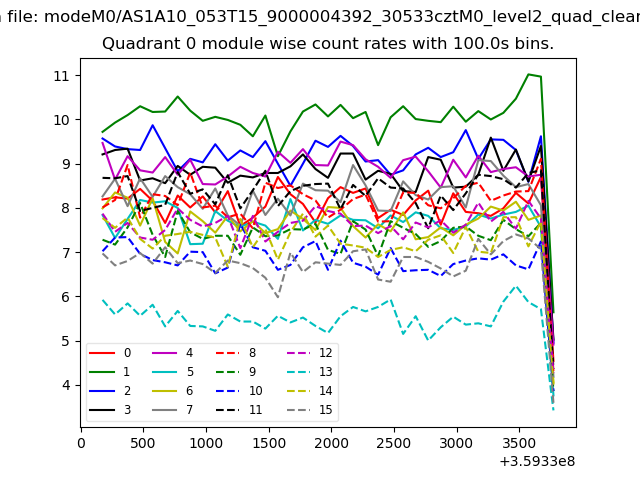 |
 |
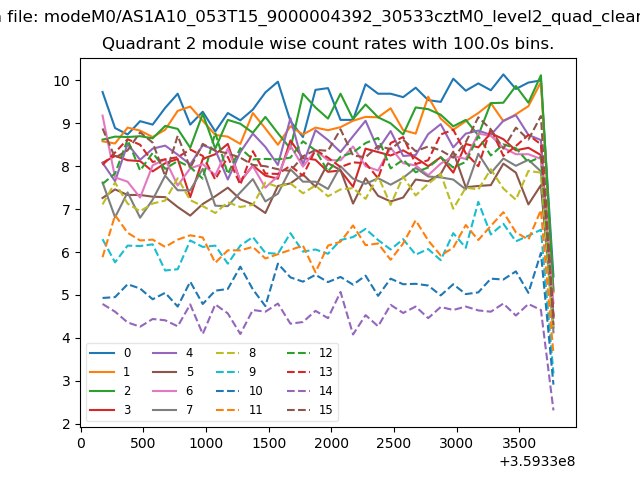
| Module-wise count rates for Quadrant B Data is divided into 100 sec bins |
 |
 |
| Module-wise count rates for Quadrant C Data is divided into 100 sec bins |
 |
 |
| Module-wise count rates for Quadrant D Data is divided into 100 sec bins |
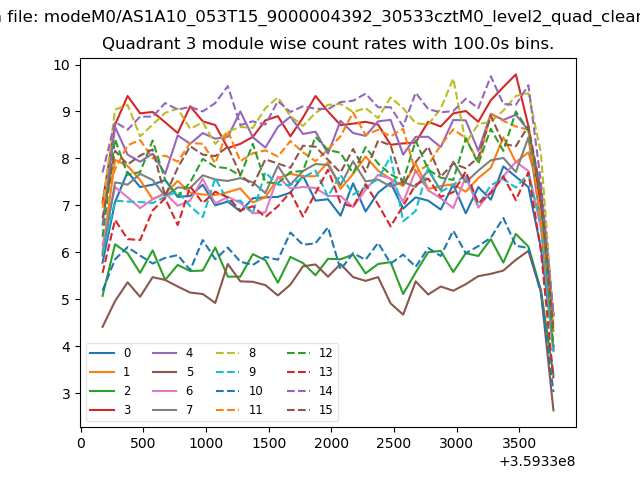 |
 |
| Parameter | Plot |
|---|---|
| CZT HV Monitor | 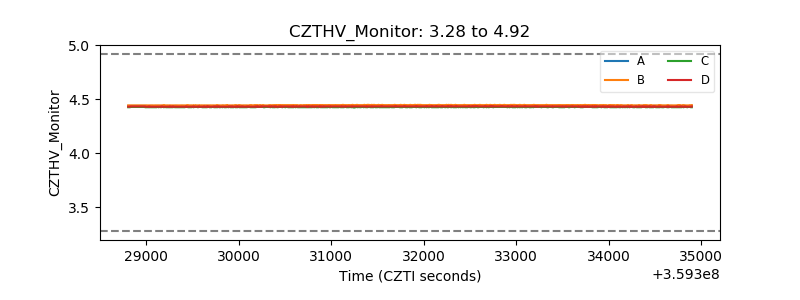 |
| D_VDD | 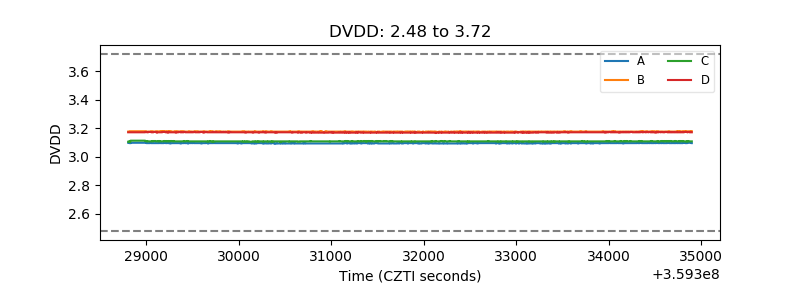 |
| Temperature 1 |  |
| Veto HV Monitor |  |
| Veto LLD |  |
| Alpha Counter | 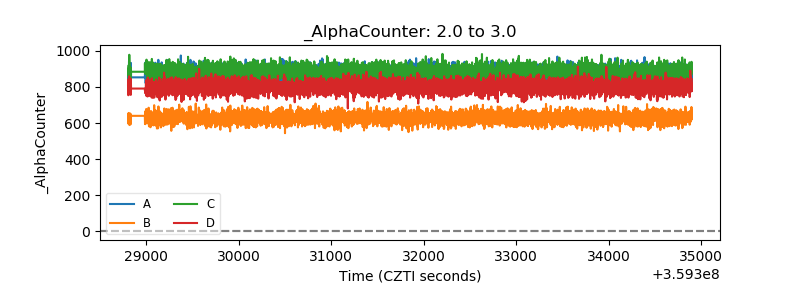 |
| _CPM_Rate | 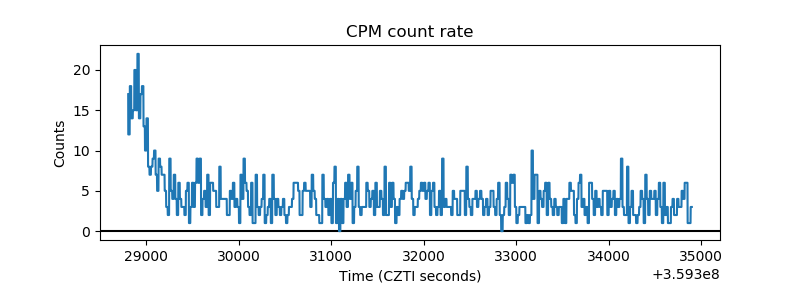 |
| CZT Counter | 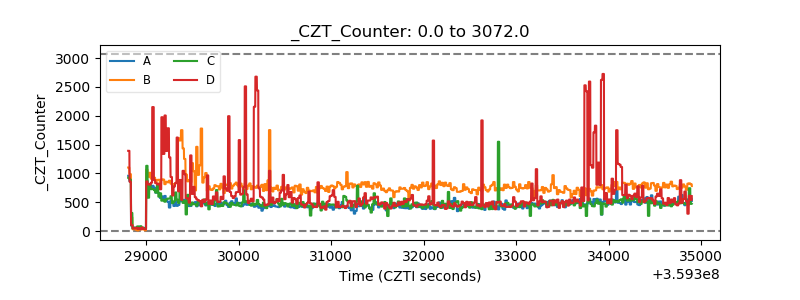 |
| +2.5 Volts monitor |  |
| +5 Volts monitor | 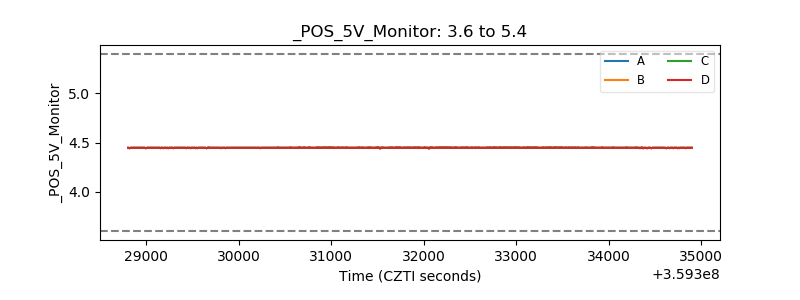 |
| _ROLL_ROT | 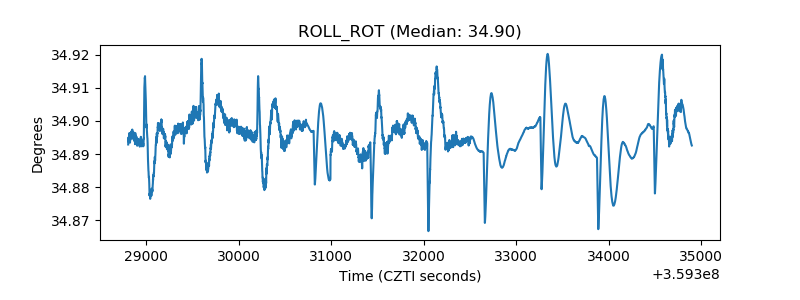 |
| _Roll_DEC | 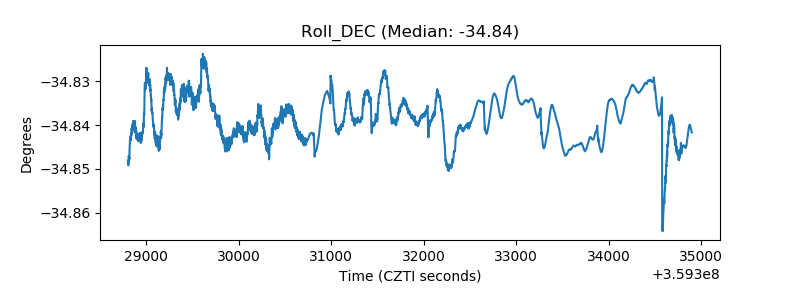 |
| _Roll_RA |  |
| Veto Counter | 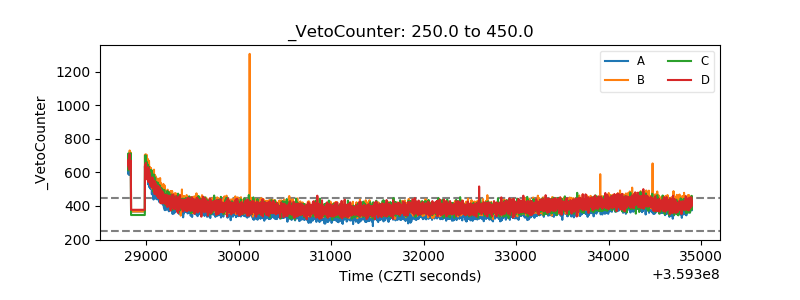 |