| Param | Original file | Final file |
|---|---|---|
| Filename | modeM0/AS1A10_053T17_9000004396cztM0_level2.fits | modeM0/AS1A10_053T17_9000004396cztM0_level2_quad_clean.evt |
| Size (bytes) | 250,655,040 | 121,582,080 |
| Size | 239.0 MB | 115.9 MB |
| Events in quadrant A | 1,642,908 | 573,592 |
| Events in quadrant B | 1,495,814 | 521,898 |
| Events in quadrant C | 1,502,104 | 520,906 |
| Events in quadrant D | 1,373,074 | 486,199 |
| Mode M9 | |||
|---|---|---|---|
| Quadrant | BADHDUFLAG | Total packets | Discarded packets |
| A | 0 | 58 | 0 |
| B | 0 | 58 | 0 |
| C | 0 | 58 | 0 |
| D | 0 | 58 | 0 |
| Mode SS | |||
|---|---|---|---|
| Quadrant | BADHDUFLAG | Total packets | Discarded packets |
| A | 0 | 470 | 0 |
| B | 0 | 470 | 0 |
| C | 0 | 470 | 0 |
| D | 0 | 470 | 0 |
| Mode M0 | |||
|---|---|---|---|
| Quadrant | BADHDUFLAG | Total packets | Discarded packets |
| A | 0 | 49406 | 0 |
| B | 0 | 76090 | 0 |
| C | 0 | 54091 | 0 |
| D | 0 | 59460 | 0 |
| Quadrant | Total seconds | Saturated seconds | Saturation percentage |
|---|---|---|---|
| A | 22907 | 373 | 1.628323% |
| B | 22907 | 1420 | 6.198978% |
| C | 22907 | 919 | 4.011874% |
| D | 22907 | 638 | 2.785175% |
Noise dominated data is calculated using 1-second bins in cleaned event files. If a bin has >2000 counts, and if more than 50% of those come from <1% of pixels, then it is considered to be noise-dominated and hence unusable.
| Quadrant | # 1 sec bins | Bins with >0 counts | Bins with >2000 counts | High rate bins dominated by noise | Noise dominated (total time) | Noise dominated (detector-on time) | Marked lightcurve |
|---|---|---|---|---|---|---|---|
| A | 28742 | 22906 | 0 | 0 | 0.00% | 0.00% |  |
| B | 28742 | 22904 | 0 | 0 | 0.00% | 0.00% |  |
| C | 28742 | 22905 | 0 | 0 | 0.00% | 0.00% |  |
| D | 28742 | 22906 | 0 | 0 | 0.00% | 0.00% | 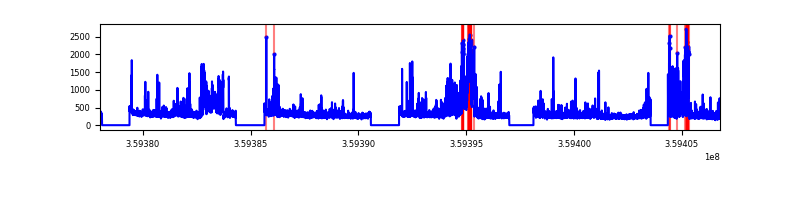 |
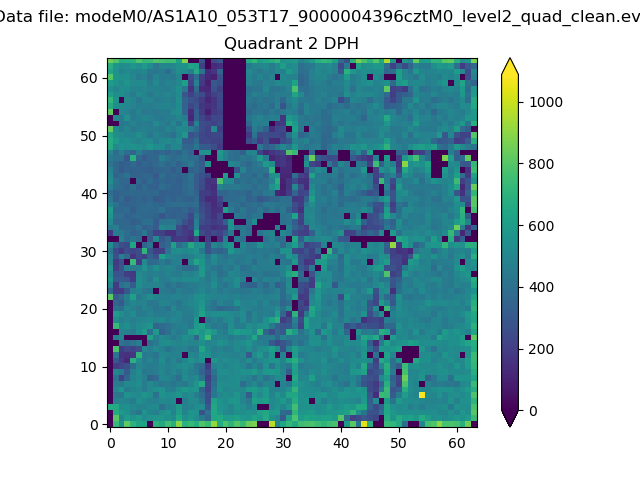
Top three noisy pixels from each quadrant. If the there are fewer than three noisy pixels in the level2.evt file, extra rows are filled as -1
| Pixel properties | Quadrant properties | ||||||
|---|---|---|---|---|---|---|---|
| Quadrant | DetID | PixID | Counts | Sigma | Mean | Median | Sigma |
| A | 0 | 29 | 1459 | 10.32 | 428 | 407 | 102.0 |
| A | 7 | 110 | 1296 | 8.72 | 428 | 407 | 102.0 |
| A | 0 | 30 | 1201 | 7.79 | 428 | 407 | 102.0 |
| B | 2 | 9 | 1130 | 9.25 | 396 | 381 | 81.0 |
| B | 2 | 8 | 991 | 7.53 | 396 | 381 | 81.0 |
| B | 5 | 128 | 988 | 7.49 | 396 | 381 | 81.0 |
| C | 3 | 202 | 1137 | 7.55 | 396 | 374 | 101.1 |
| C | 1 | 80 | 1106 | 7.24 | 396 | 374 | 101.1 |
| C | 1 | 81 | 1103 | 7.21 | 396 | 374 | 101.1 |
| D | 15 | 46 | 1028 | 6.46 | 392 | 361 | 103.2 |
| D | 6 | 67 | 955 | 5.76 | 392 | 361 | 103.2 |
| D | 4 | 160 | 951 | 5.72 | 392 | 361 | 103.2 |
Histogram calculated using DETX and DETY for each event in the final _common_clean file
| Quadrant A |  |
 |
Quadrant B |
|---|---|---|---|
| Quadrant D | 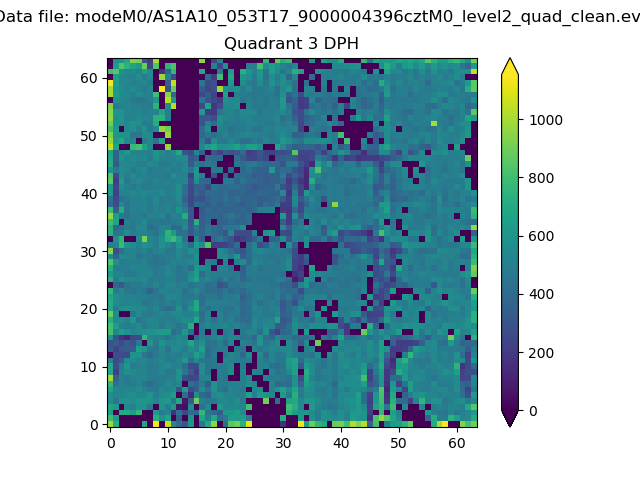 |
 |
Quadrant C |
| Plot type | Count rate plots | Images |
|---|---|---|
| Comparison with Poisson distribution Blue bars denote a histogram of data divided into 1 sec bins. Red curve is a Poisson curve with rate = median count rate of data. |
 |
 |
| Quadrant-wise count rates Data is divided into 100 sec bins |
 |
|
| Module-wise count rates for Quadrant A Data is divided into 100 sec bins |
 |
 |
| Module-wise count rates for Quadrant B Data is divided into 100 sec bins |
 |
 |
| Module-wise count rates for Quadrant C Data is divided into 100 sec bins |
 |
 |
| Module-wise count rates for Quadrant D Data is divided into 100 sec bins |
 |
 |
| Parameter | Plot |
|---|---|
| CZT HV Monitor | 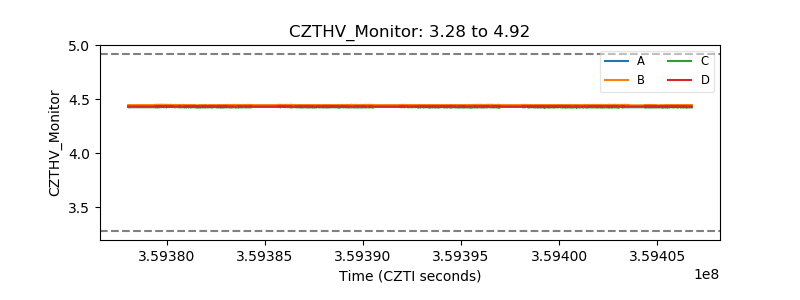 |
| D_VDD |  |
| Temperature 1 |  |
| Veto HV Monitor |  |
| Veto LLD |  |
| Alpha Counter |  |
| _CPM_Rate | 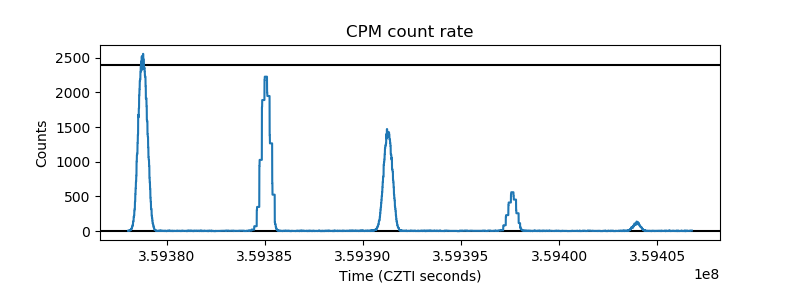 |
| CZT Counter | 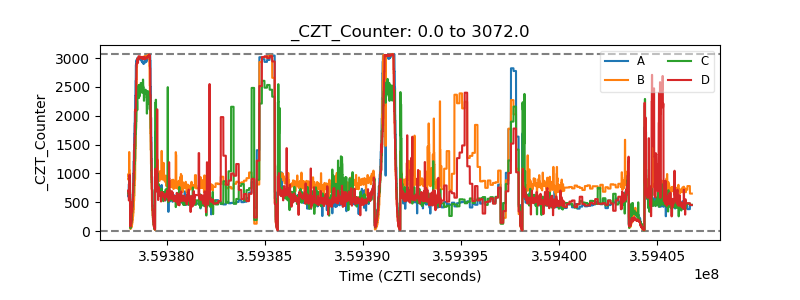 |
| +2.5 Volts monitor |  |
| +5 Volts monitor |  |
| _ROLL_ROT |  |
| _Roll_DEC |  |
| _Roll_RA |  |
| Veto Counter |  |