| Param | Original file | Final file |
|---|---|---|
| Filename | modeM0/AS1A10_053T17_9000004396_30541cztM0_level2.evt | modeM0/AS1A10_053T17_9000004396_30541cztM0_level2_quad_clean.evt |
| Size (bytes) | 150,108,480 | 34,997,760 |
| Size | 143.2 MB | 33.4 MB |
| Events in quadrant A | 967,940 | 249,021 |
| Events in quadrant B | 1,396,728 | 245,277 |
| Events in quadrant C | 1,076,394 | 221,363 |
| Events in quadrant D | 1,000,026 | 231,856 |
| Mode M9 | |||
|---|---|---|---|
| Quadrant | BADHDUFLAG | Total packets | Discarded packets |
| A | 0 | 13 | 0 |
| B | 0 | 13 | 0 |
| C | 0 | 13 | 0 |
| D | 0 | 13 | 0 |
| Mode SS | |||
|---|---|---|---|
| Quadrant | BADHDUFLAG | Total packets | Discarded packets |
| A | 0 | 32 | 0 |
| B | 0 | 32 | 0 |
| C | 0 | 32 | 0 |
| D | 0 | 32 | 0 |
| Mode M0 | |||
|---|---|---|---|
| Quadrant | BADHDUFLAG | Total packets | Discarded packets |
| A | 0 | 3937 | 1 |
| B | 0 | 5137 | 1 |
| C | 0 | 4192 | 1 |
| D | 0 | 4087 | 1 |
| Quadrant | Total seconds | Saturated seconds | Saturation percentage |
|---|---|---|---|
| A | 1513 | 55 | 3.635162% |
| B | 1513 | 96 | 6.345010% |
| C | 1513 | 131 | 8.658295% |
| D | 1513 | 28 | 1.850628% |
Noise dominated data is calculated using 1-second bins in cleaned event files. If a bin has >2000 counts, and if more than 50% of those come from <1% of pixels, then it is considered to be noise-dominated and hence unusable.
| Quadrant | # 1 sec bins | Bins with >0 counts | Bins with >2000 counts | High rate bins dominated by noise | Noise dominated (total time) | Noise dominated (detector-on time) | Marked lightcurve |
|---|---|---|---|---|---|---|---|
| A | 2788 | 1514 | 0 | 0 | 0.00% | 0.00% | 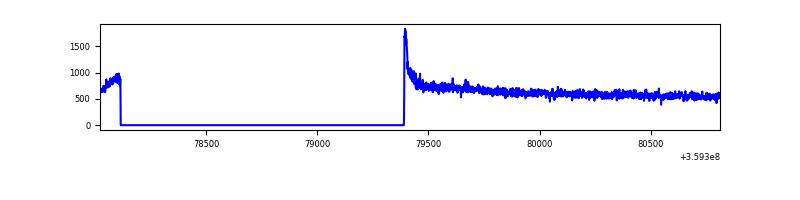 |
| B | 2788 | 1514 | 6 | 6 | 0.22% | 0.40% | 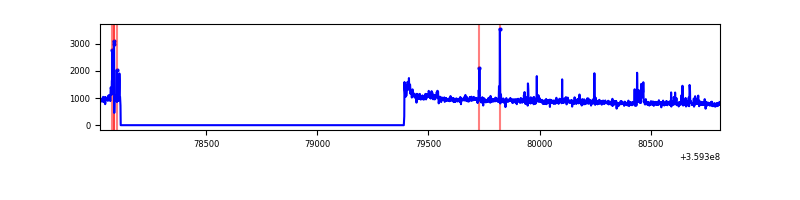 |
| C | 2788 | 1514 | 48 | 48 | 1.72% | 3.17% | 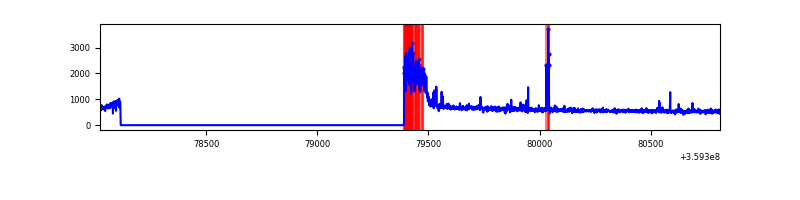 |
| D | 2788 | 1514 | 3 | 3 | 0.11% | 0.20% | 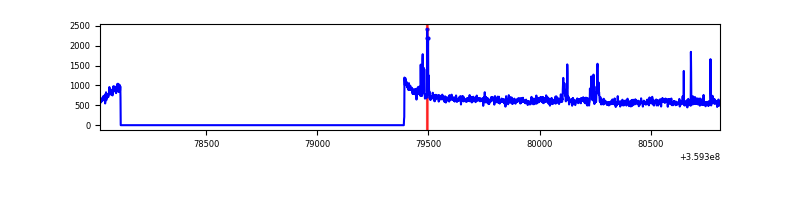 |
Top three noisy pixels from each quadrant. If the there are fewer than three noisy pixels in the level2.evt file, extra rows are filled as -1
| Pixel properties | Quadrant properties | ||||||
|---|---|---|---|---|---|---|---|
| Quadrant | DetID | PixID | Counts | Sigma | Mean | Median | Sigma |
| A | 8 | 192 | 12156 | 237.26 | 247 | 244 | 50.2 |
| A | 13 | 254 | 2582 | 46.57 | 247 | 244 | 50.2 |
| A | 3 | 137 | 2126 | 37.48 | 247 | 244 | 50.2 |
| B | 6 | 159 | 390828 | 8614.17 | 234 | 230 | 45.3 |
| B | 6 | 36 | 53207 | 1168.34 | 234 | 230 | 45.3 |
| B | 4 | 171 | 24683 | 539.28 | 234 | 230 | 45.3 |
| C | 0 | 10 | 183505 | 3563.32 | 217 | 219 | 51.4 |
| C | 14 | 238 | 35952 | 694.7 | 217 | 219 | 51.4 |
| C | 10 | 22 | 3559 | 64.93 | 217 | 219 | 51.4 |
| D | 8 | 195 | 53853 | 947.81 | 237 | 232 | 56.6 |
| D | 13 | 249 | 19706 | 344.23 | 237 | 232 | 56.6 |
| D | 2 | 120 | 15253 | 265.51 | 237 | 232 | 56.6 |
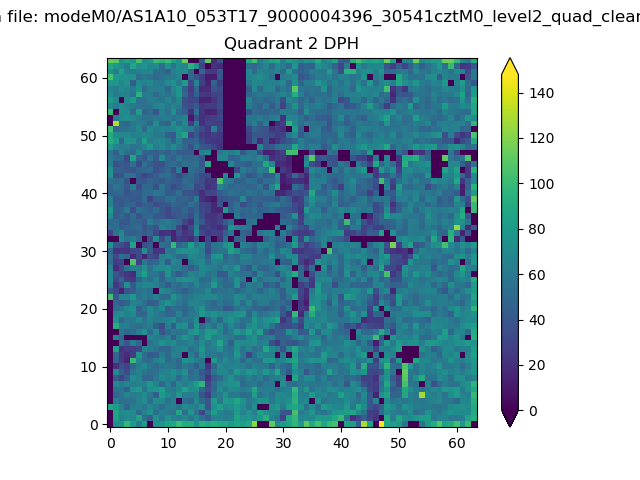
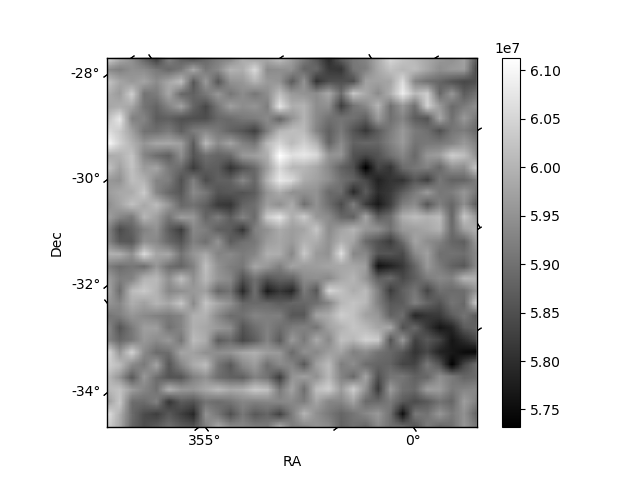
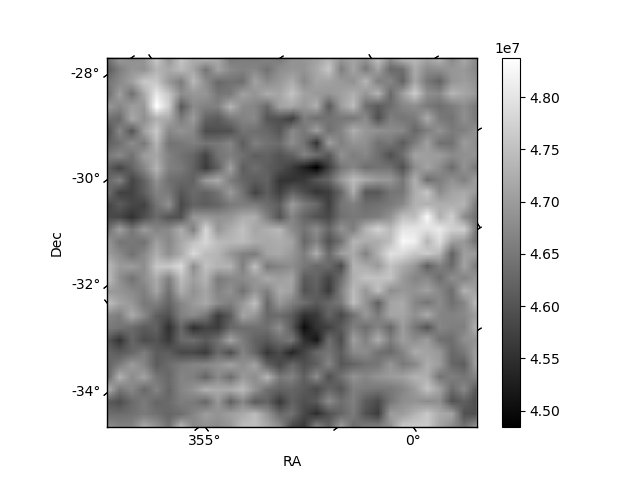
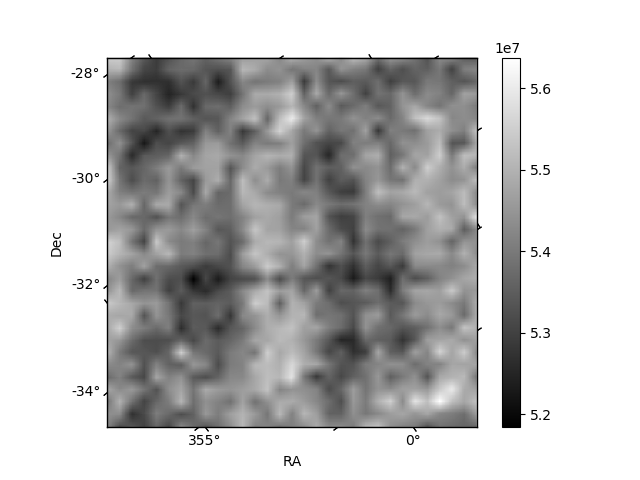
Histogram calculated using DETX and DETY for each event in the final _common_clean file
| Quadrant A | 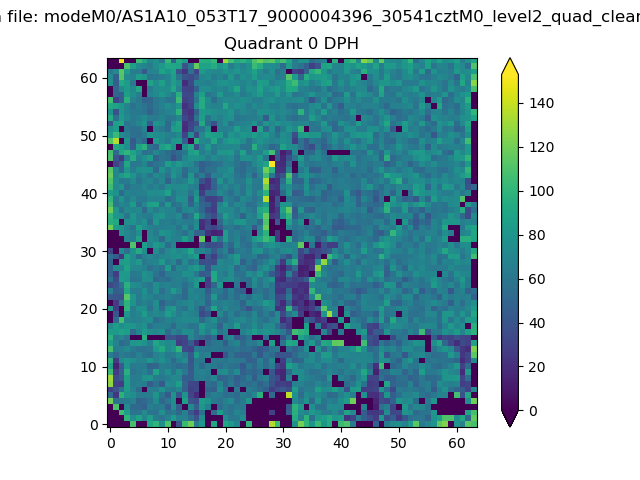 |
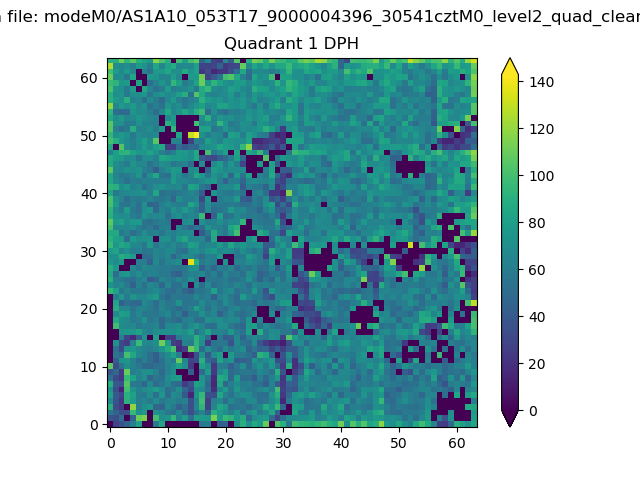 |
Quadrant B |
|---|---|---|---|
| Quadrant D | 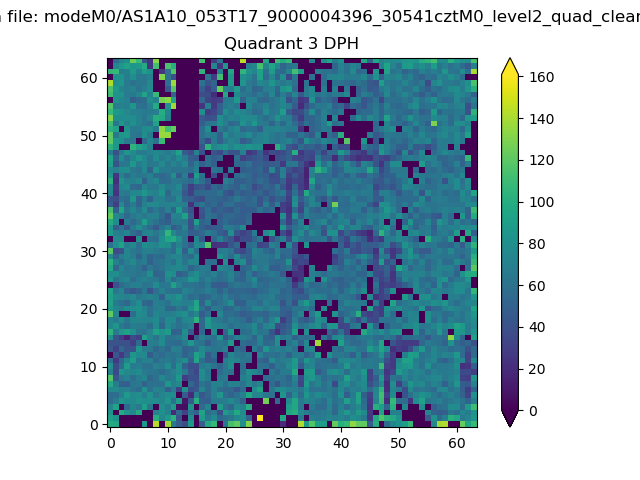 |
 |
Quadrant C |
| Plot type | Count rate plots | Images |
|---|---|---|
| Comparison with Poisson distribution Blue bars denote a histogram of data divided into 1 sec bins. Red curve is a Poisson curve with rate = median count rate of data. |
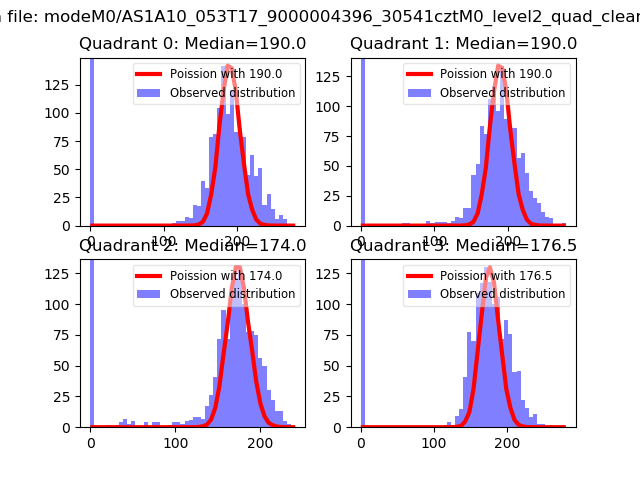 |
 |
| Quadrant-wise count rates Data is divided into 100 sec bins |
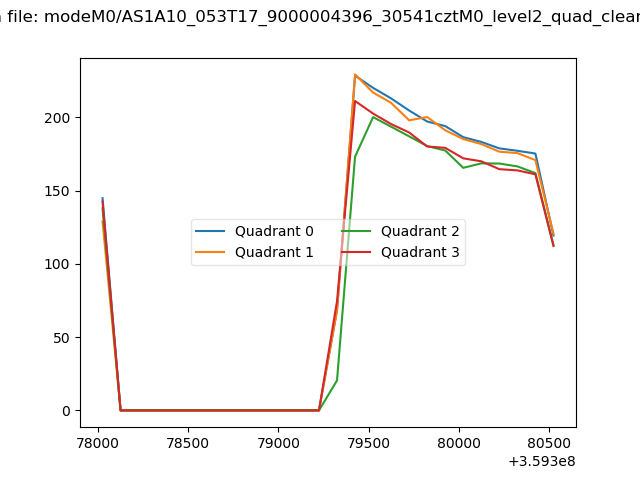 |
|
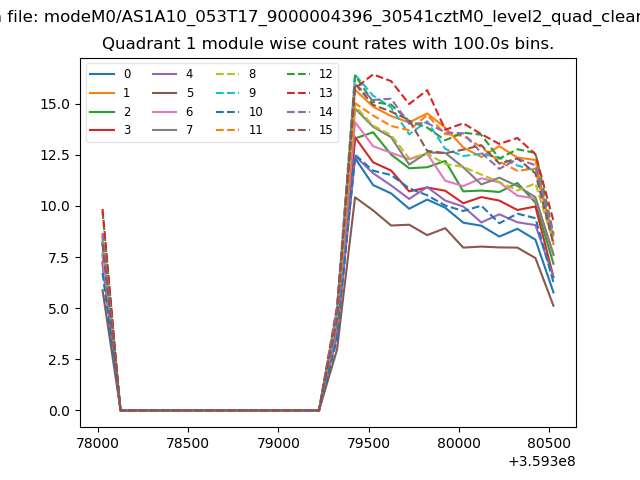
| Module-wise count rates for Quadrant A Data is divided into 100 sec bins |
 |
 |
| Module-wise count rates for Quadrant B Data is divided into 100 sec bins |
 |
 |
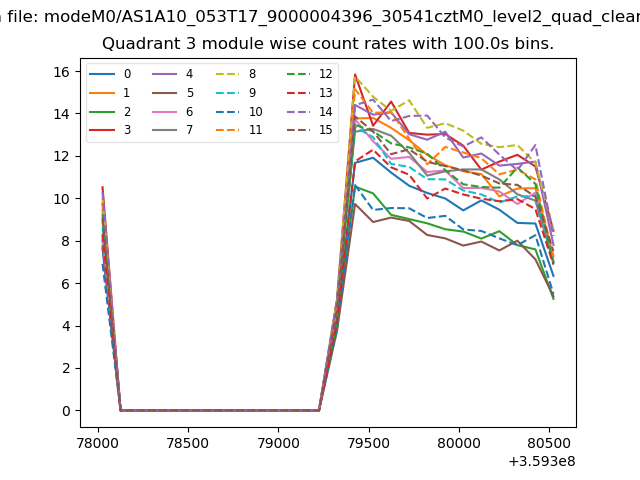
| Module-wise count rates for Quadrant C Data is divided into 100 sec bins |
 |
 |
| Module-wise count rates for Quadrant D Data is divided into 100 sec bins |
 |
 |
| Parameter | Plot |
|---|---|
| CZT HV Monitor |  |
| D_VDD | 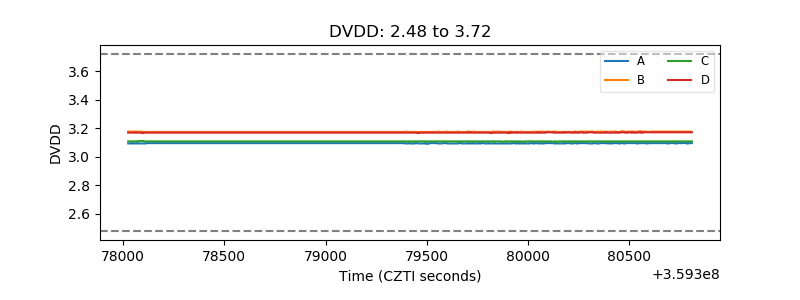 |
| Temperature 1 | 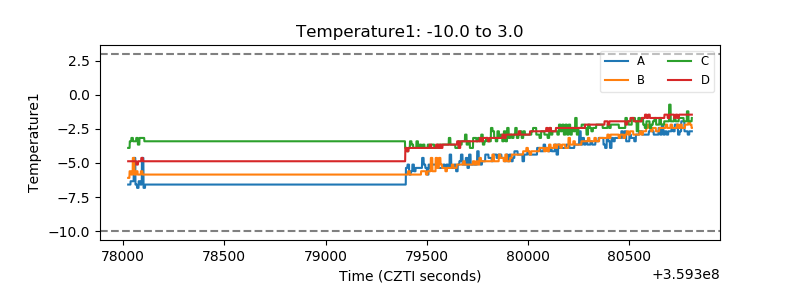 |
| Veto HV Monitor | 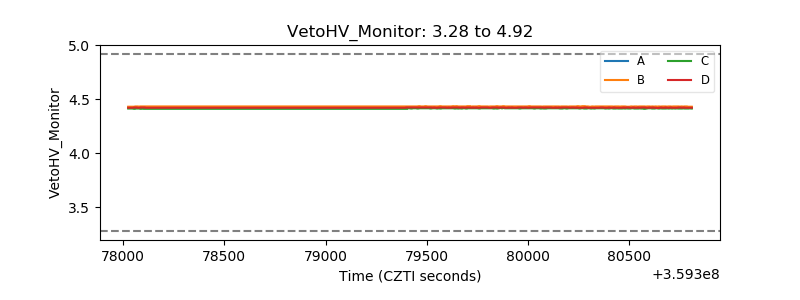 |
| Veto LLD | 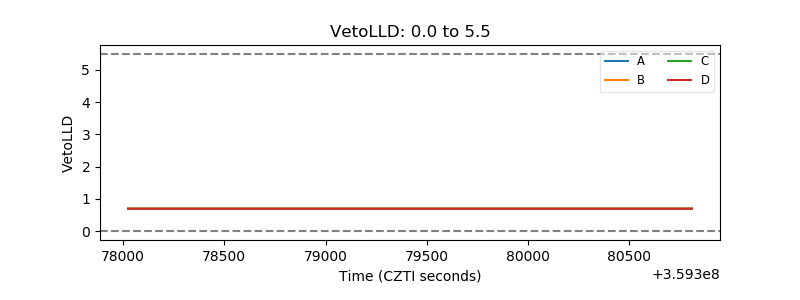 |
| Alpha Counter | 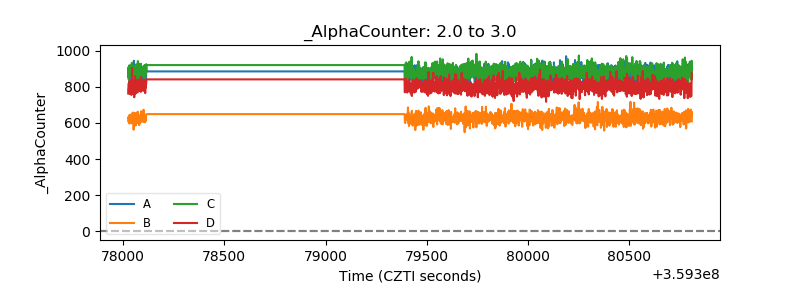 |
| _CPM_Rate | 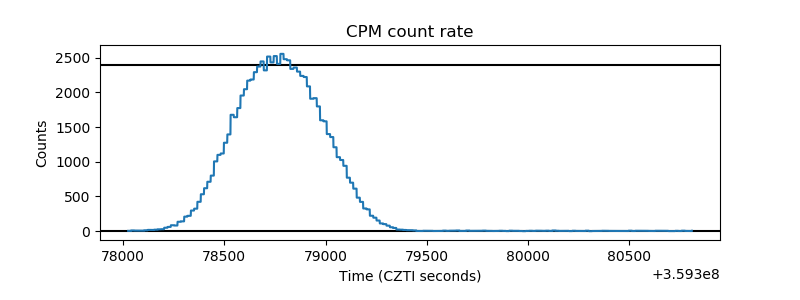 |
| CZT Counter | 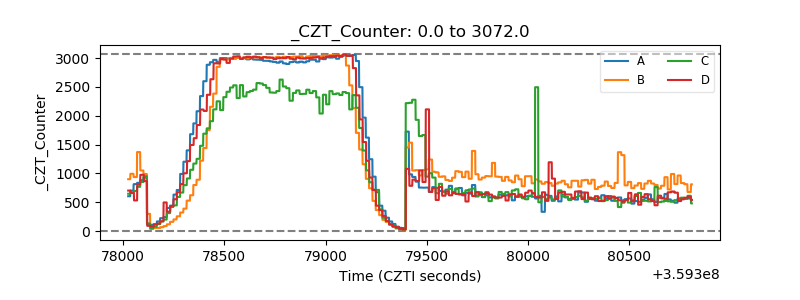 |
| +2.5 Volts monitor |  |
| +5 Volts monitor |  |
| _ROLL_ROT |  |
| _Roll_DEC | 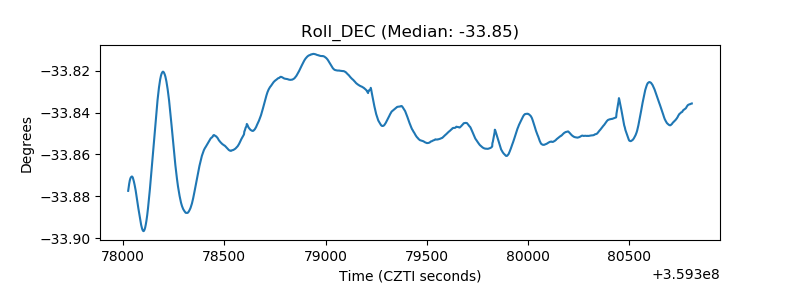 |
| _Roll_RA | 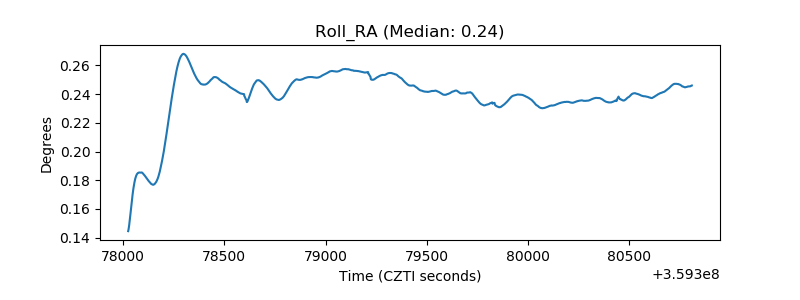 |
| Veto Counter | 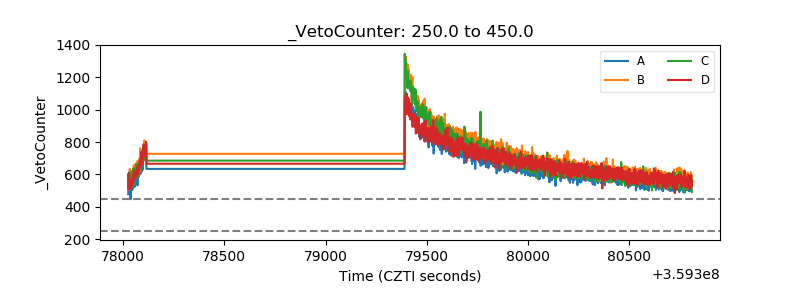 |