| Param | Original file | Final file |
|---|---|---|
| Filename | modeM0/AS1A10_053T17_9000004396_30542cztM0_level2.evt | modeM0/AS1A10_053T17_9000004396_30542cztM0_level2_quad_clean.evt |
| Size (bytes) | 583,790,400 | 88,922,880 |
| Size | 556.7 MB | 84.8 MB |
| Events in quadrant A | 3,525,914 | 592,238 |
| Events in quadrant B | 5,322,949 | 586,077 |
| Events in quadrant C | 4,084,239 | 528,337 |
| Events in quadrant D | 4,320,880 | 546,268 |
| Mode M9 | |||
|---|---|---|---|
| Quadrant | BADHDUFLAG | Total packets | Discarded packets |
| A | 0 | 13 | 0 |
| B | 0 | 13 | 0 |
| C | 0 | 13 | 0 |
| D | 0 | 13 | 0 |
| Mode SS | |||
|---|---|---|---|
| Quadrant | BADHDUFLAG | Total packets | Discarded packets |
| A | 0 | 130 | 0 |
| B | 0 | 130 | 0 |
| C | 0 | 130 | 0 |
| D | 0 | 130 | 0 |
| Mode M0 | |||
|---|---|---|---|
| Quadrant | BADHDUFLAG | Total packets | Discarded packets |
| A | 0 | 14229 | 1 |
| B | 0 | 19850 | 1 |
| C | 0 | 16064 | 1 |
| D | 0 | 17105 | 1 |
| Quadrant | Total seconds | Saturated seconds | Saturation percentage |
|---|---|---|---|
| A | 6295 | 62 | 0.984909% |
| B | 6295 | 143 | 2.271644% |
| C | 6295 | 285 | 4.527403% |
| D | 6296 | 64 | 1.016518% |
Noise dominated data is calculated using 1-second bins in cleaned event files. If a bin has >2000 counts, and if more than 50% of those come from <1% of pixels, then it is considered to be noise-dominated and hence unusable.
| Quadrant | # 1 sec bins | Bins with >0 counts | Bins with >2000 counts | High rate bins dominated by noise | Noise dominated (total time) | Noise dominated (detector-on time) | Marked lightcurve |
|---|---|---|---|---|---|---|---|
| A | 7625 | 6296 | 2 | 2 | 0.03% | 0.03% | 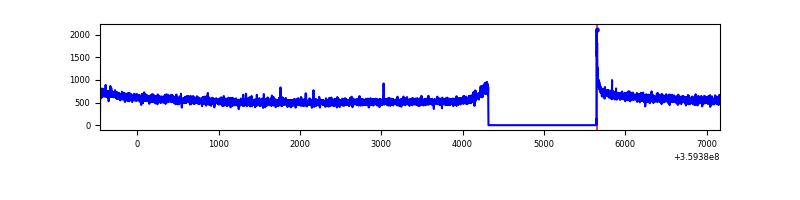 |
| B | 7625 | 6295 | 5 | 5 | 0.07% | 0.08% | 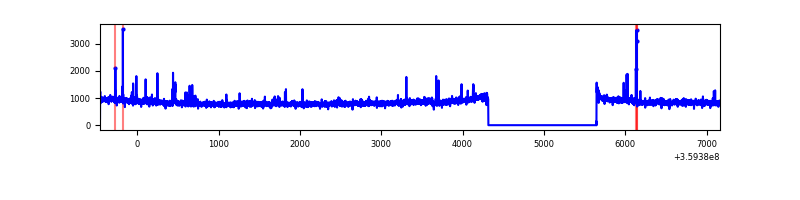 |
| C | 7625 | 6296 | 130 | 130 | 1.70% | 2.06% | 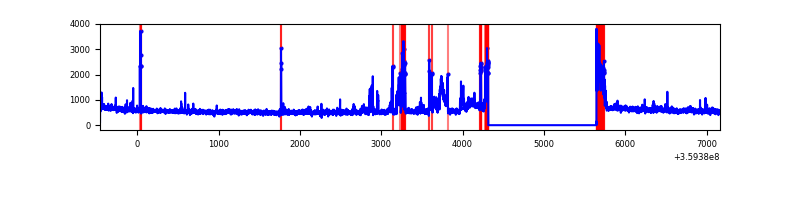 |
| D | 7626 | 6296 | 17 | 17 | 0.22% | 0.27% | 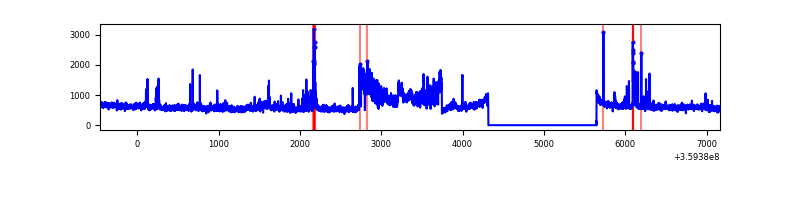 |
Top three noisy pixels from each quadrant. If the there are fewer than three noisy pixels in the level2.evt file, extra rows are filled as -1
| Pixel properties | Quadrant properties | ||||||
|---|---|---|---|---|---|---|---|
| Quadrant | DetID | PixID | Counts | Sigma | Mean | Median | Sigma |
| A | 8 | 192 | 13071 | 68.09 | 911 | 897 | 178.8 |
| A | 13 | 254 | 11117 | 57.16 | 911 | 897 | 178.8 |
| A | 3 | 137 | 8006 | 39.76 | 911 | 897 | 178.8 |
| B | 6 | 159 | 1692790 | 10226.73 | 885 | 866 | 165.4 |
| B | 6 | 36 | 83688 | 500.61 | 885 | 866 | 165.4 |
| B | 0 | 229 | 52049 | 309.37 | 885 | 866 | 165.4 |
| C | 10 | 22 | 448933 | 2376.53 | 822 | 830 | 188.6 |
| C | 0 | 10 | 210307 | 1110.97 | 822 | 830 | 188.6 |
| C | 14 | 238 | 148337 | 782.31 | 822 | 830 | 188.6 |
| D | 7 | 238 | 531306 | 2626.34 | 871 | 854 | 202.0 |
| D | 8 | 195 | 275593 | 1360.27 | 871 | 854 | 202.0 |
| D | 2 | 250 | 75867 | 371.4 | 871 | 854 | 202.0 |
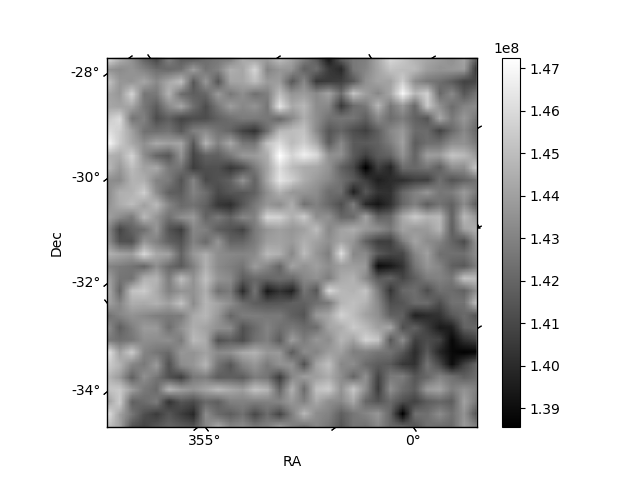
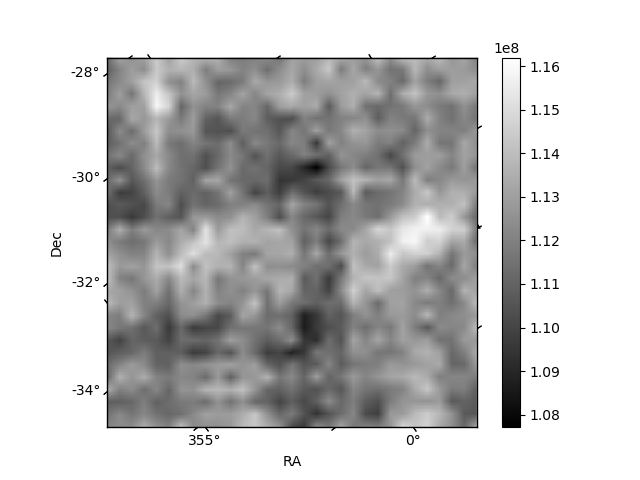
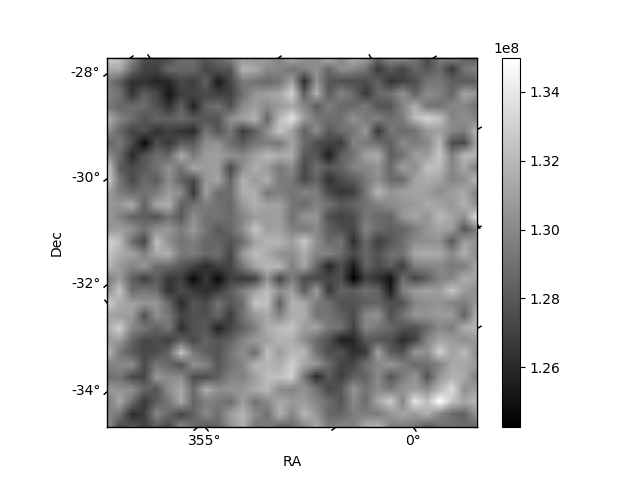
Histogram calculated using DETX and DETY for each event in the final _common_clean file
| Quadrant A | 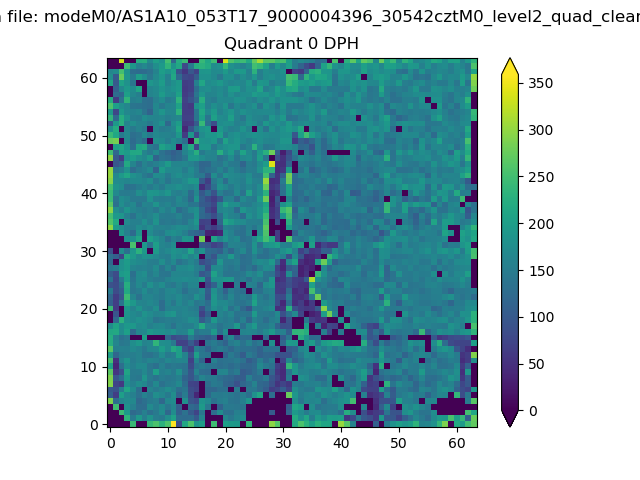 |
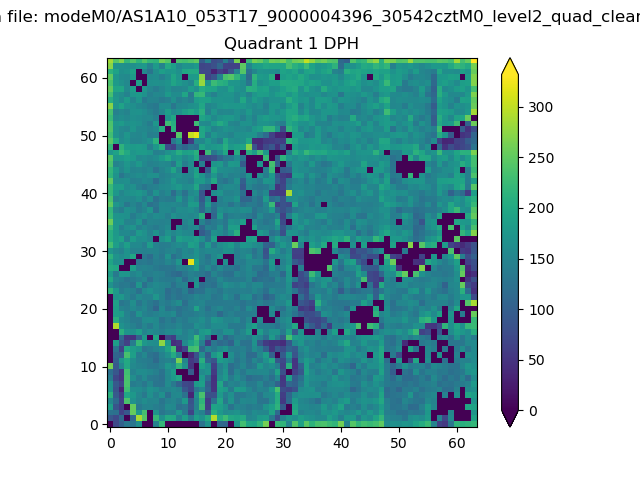 |
Quadrant B |
|---|---|---|---|
| Quadrant D | 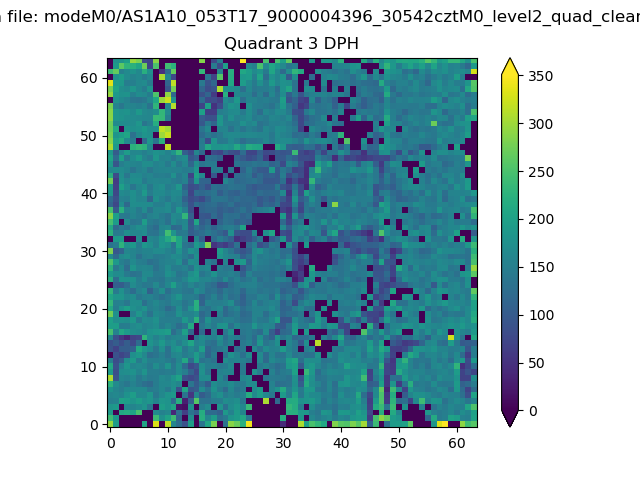 |
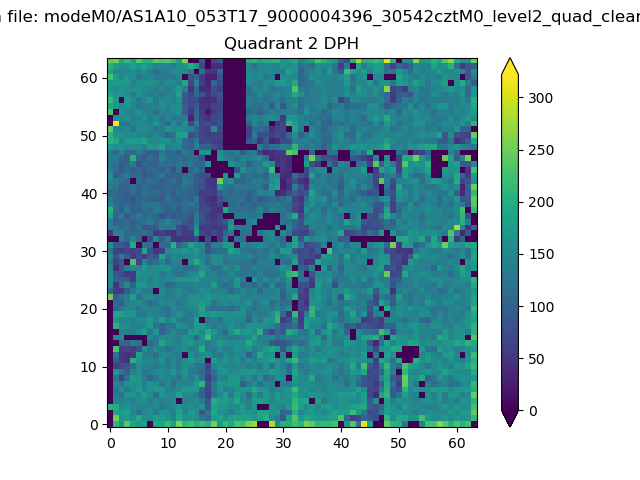 |
Quadrant C |
| Plot type | Count rate plots | Images |
|---|---|---|
| Comparison with Poisson distribution Blue bars denote a histogram of data divided into 1 sec bins. Red curve is a Poisson curve with rate = median count rate of data. |
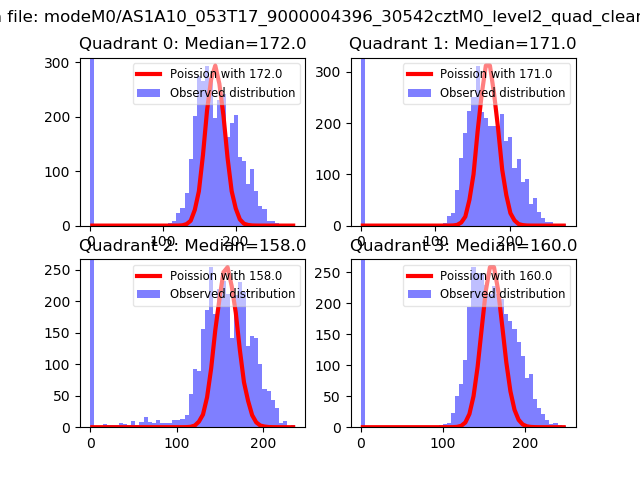 |
 |
| Quadrant-wise count rates Data is divided into 100 sec bins |
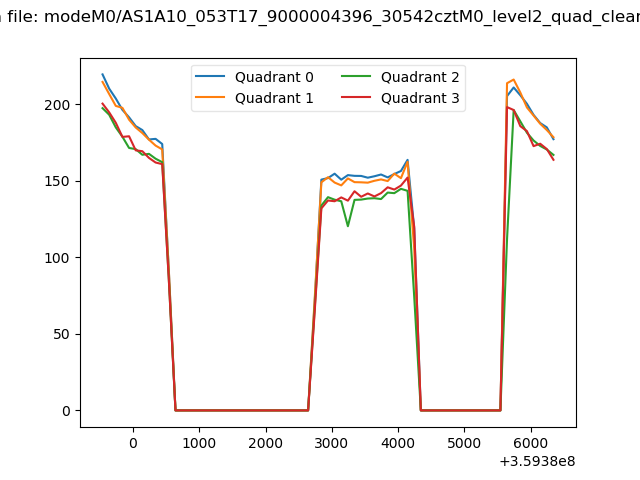 |
|
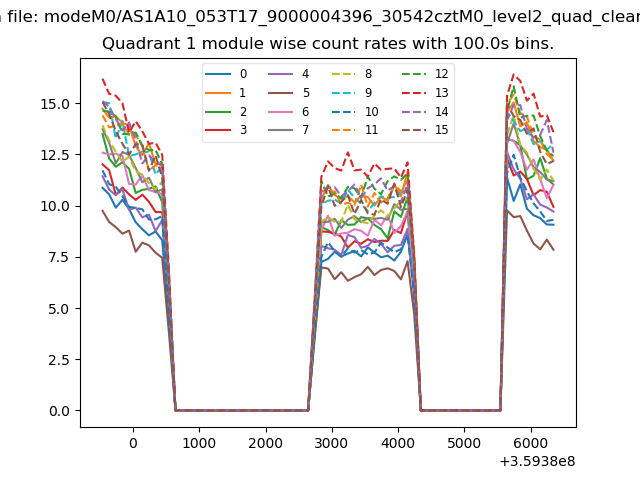
| Module-wise count rates for Quadrant A Data is divided into 100 sec bins |
 |
 |
| Module-wise count rates for Quadrant B Data is divided into 100 sec bins |
 |
 |
| Module-wise count rates for Quadrant C Data is divided into 100 sec bins |
 |
 |
| Module-wise count rates for Quadrant D Data is divided into 100 sec bins |
 |
 |
| Parameter | Plot |
|---|---|
| CZT HV Monitor |  |
| D_VDD | 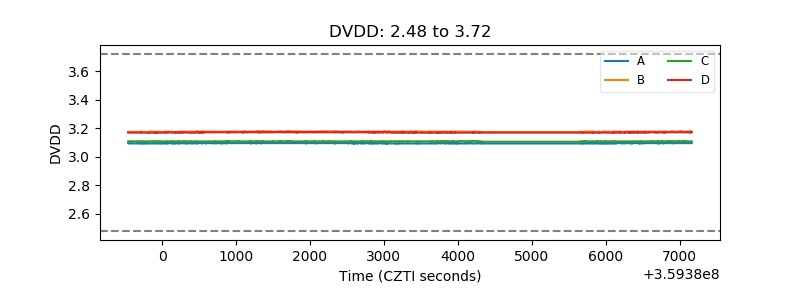 |
| Temperature 1 | 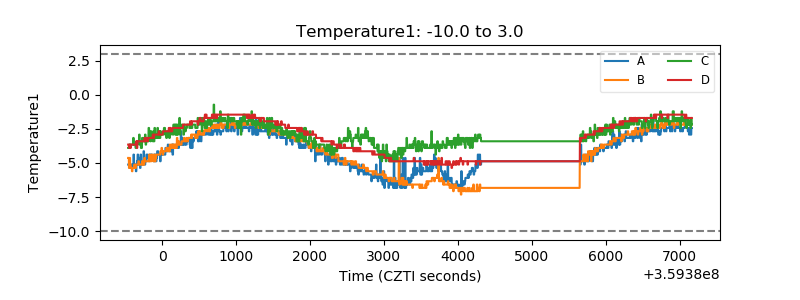 |
| Veto HV Monitor | 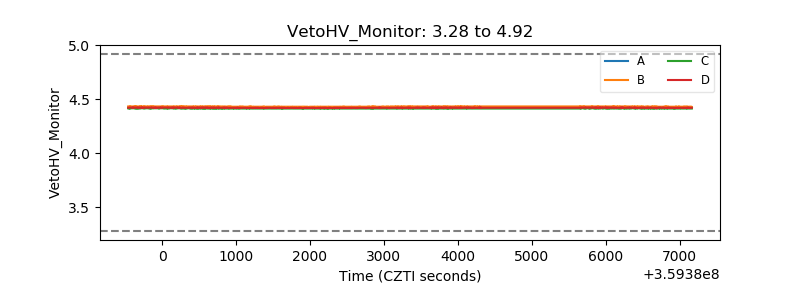 |
| Veto LLD | 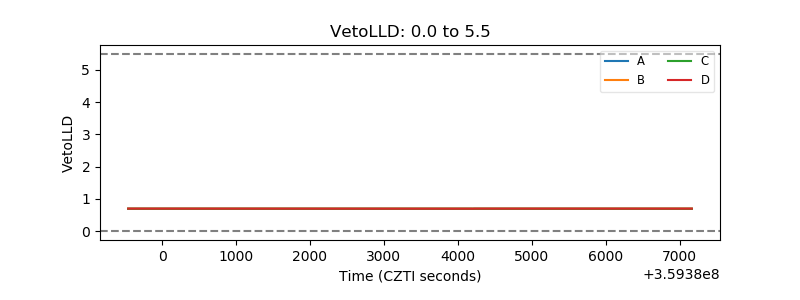 |
| Alpha Counter | 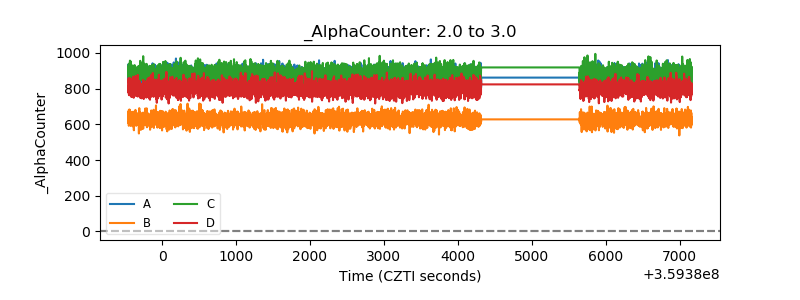 |
| _CPM_Rate | 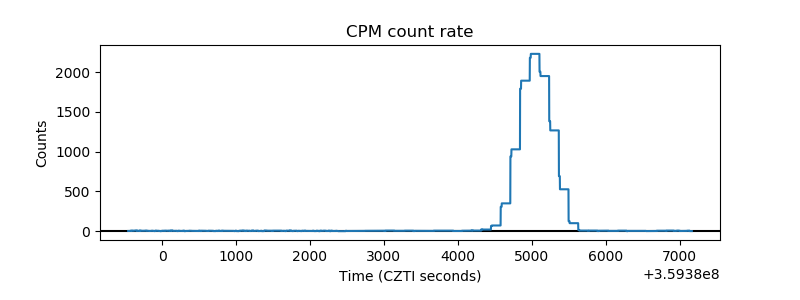 |
| CZT Counter | 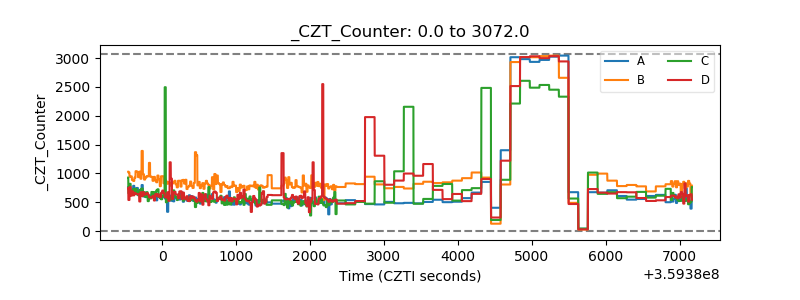 |
| +2.5 Volts monitor |  |
| +5 Volts monitor |  |
| _ROLL_ROT |  |
| _Roll_DEC | 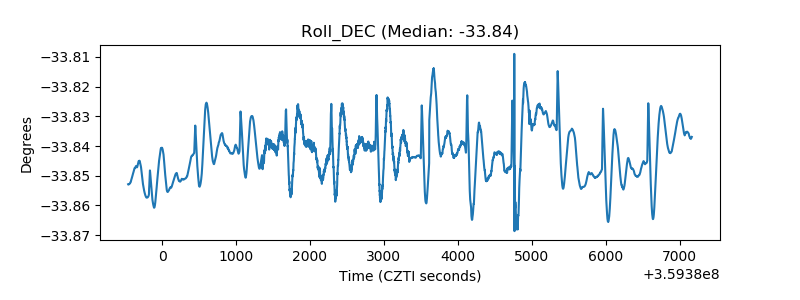 |
| _Roll_RA | 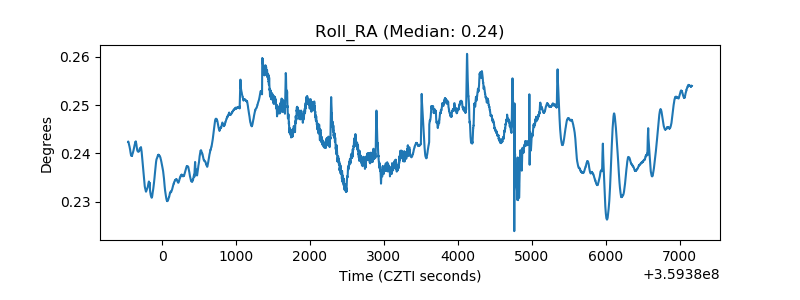 |
| Veto Counter |  |