| Param | Original file | Final file |
|---|---|---|
| Filename | modeM0/AS1A10_053T17_9000004396_30543cztM0_level2.evt | modeM0/AS1A10_053T17_9000004396_30543cztM0_level2_quad_clean.evt |
| Size (bytes) | 522,411,840 | 67,754,880 |
| Size | 498.2 MB | 64.6 MB |
| Events in quadrant A | 3,241,595 | 426,877 |
| Events in quadrant B | 5,024,680 | 424,132 |
| Events in quadrant C | 3,700,788 | 386,217 |
| Events in quadrant D | 3,449,496 | 396,711 |
| Mode M9 | |||
|---|---|---|---|
| Quadrant | BADHDUFLAG | Total packets | Discarded packets |
| A | 0 | 13 | 0 |
| B | 0 | 13 | 0 |
| C | 0 | 13 | 0 |
| D | 0 | 13 | 0 |
| Mode SS | |||
|---|---|---|---|
| Quadrant | BADHDUFLAG | Total packets | Discarded packets |
| A | 0 | 122 | 0 |
| B | 0 | 122 | 0 |
| C | 0 | 122 | 0 |
| D | 0 | 122 | 0 |
| Mode M0 | |||
|---|---|---|---|
| Quadrant | BADHDUFLAG | Total packets | Discarded packets |
| A | 0 | 12991 | 1 |
| B | 0 | 18638 | 2 |
| C | 0 | 14664 | 1 |
| D | 0 | 13834 | 1 |
| Quadrant | Total seconds | Saturated seconds | Saturation percentage |
|---|---|---|---|
| A | 5976 | 67 | 1.121151% |
| B | 5975 | 150 | 2.510460% |
| C | 5975 | 162 | 2.711297% |
| D | 5976 | 45 | 0.753012% |
Noise dominated data is calculated using 1-second bins in cleaned event files. If a bin has >2000 counts, and if more than 50% of those come from <1% of pixels, then it is considered to be noise-dominated and hence unusable.
| Quadrant | # 1 sec bins | Bins with >0 counts | Bins with >2000 counts | High rate bins dominated by noise | Noise dominated (total time) | Noise dominated (detector-on time) | Marked lightcurve |
|---|---|---|---|---|---|---|---|
| A | 7286 | 5977 | 0 | 0 | 0.00% | 0.00% | 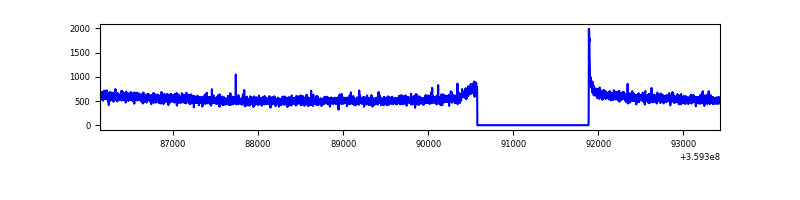 |
| B | 7285 | 5976 | 8 | 8 | 0.11% | 0.13% | 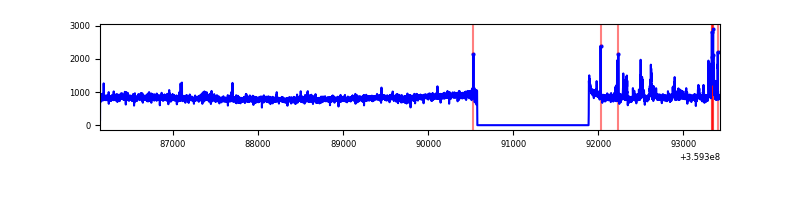 |
| C | 7285 | 5976 | 42 | 42 | 0.58% | 0.70% | 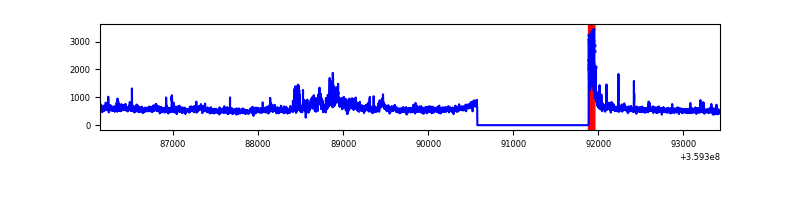 |
| D | 7286 | 5977 | 6 | 6 | 0.08% | 0.10% | 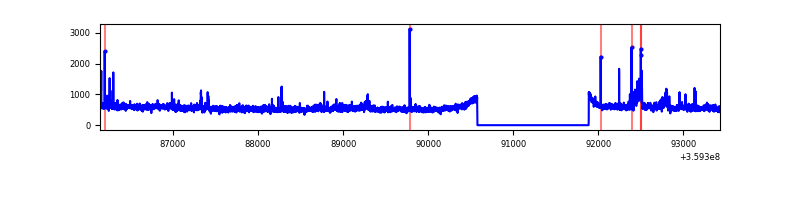 |
Top three noisy pixels from each quadrant. If the there are fewer than three noisy pixels in the level2.evt file, extra rows are filled as -1
| Pixel properties | Quadrant properties | ||||||
|---|---|---|---|---|---|---|---|
| Quadrant | DetID | PixID | Counts | Sigma | Mean | Median | Sigma |
| A | 8 | 192 | 12990 | 73.67 | 837 | 823 | 165.1 |
| A | 13 | 254 | 10815 | 60.5 | 837 | 823 | 165.1 |
| A | 3 | 137 | 7757 | 41.99 | 837 | 823 | 165.1 |
| B | 6 | 159 | 1613069 | 10504.5 | 819 | 802 | 153.5 |
| B | 6 | 36 | 152133 | 985.98 | 819 | 802 | 153.5 |
| B | 0 | 229 | 19262 | 120.27 | 819 | 802 | 153.5 |
| C | 3 | 233 | 364363 | 2054.76 | 768 | 775 | 176.9 |
| C | 0 | 10 | 182575 | 1027.41 | 768 | 775 | 176.9 |
| C | 14 | 238 | 130109 | 730.91 | 768 | 775 | 176.9 |
| D | 8 | 195 | 230068 | 1232.16 | 799 | 780 | 186.1 |
| D | 12 | 227 | 113064 | 603.4 | 799 | 780 | 186.1 |
| D | 2 | 234 | 25905 | 135.02 | 799 | 780 | 186.1 |
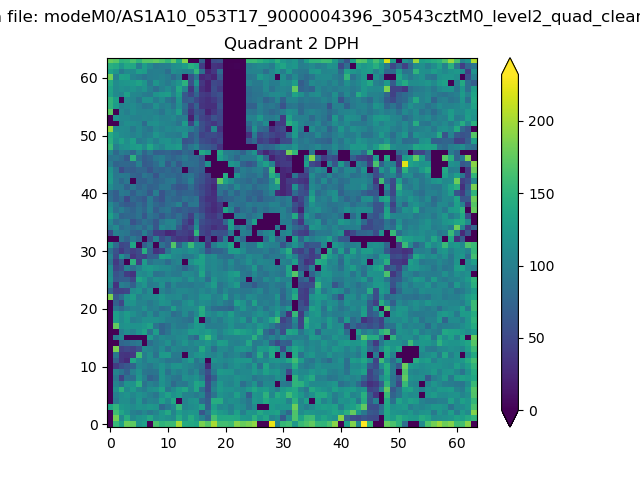
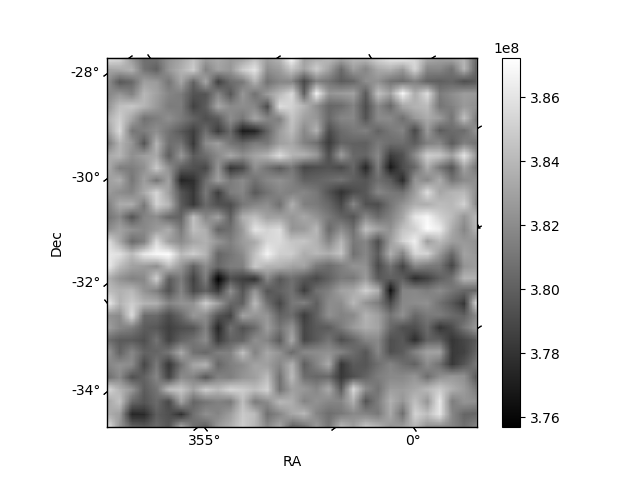
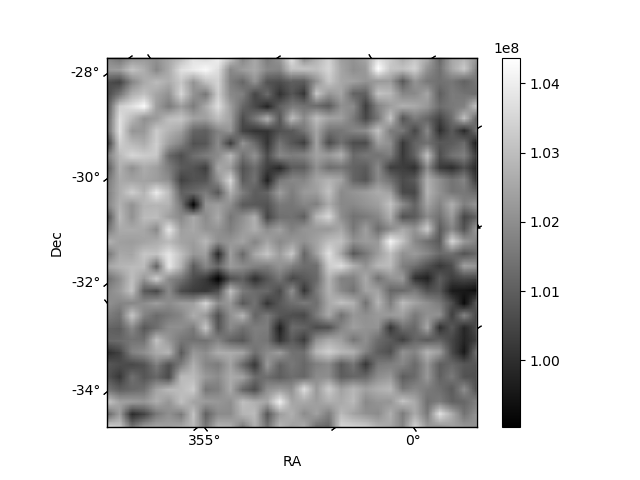
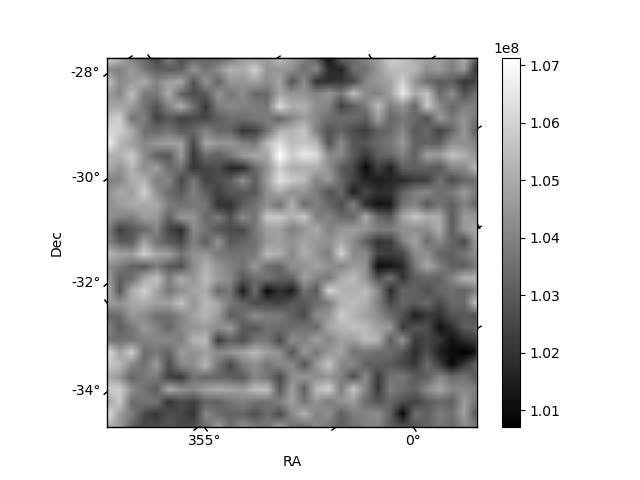
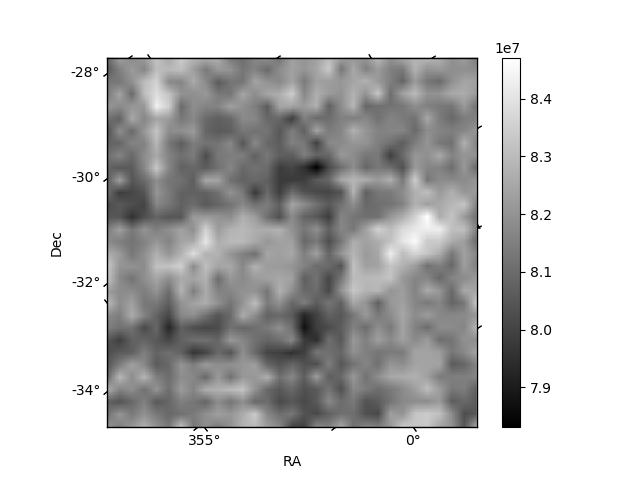
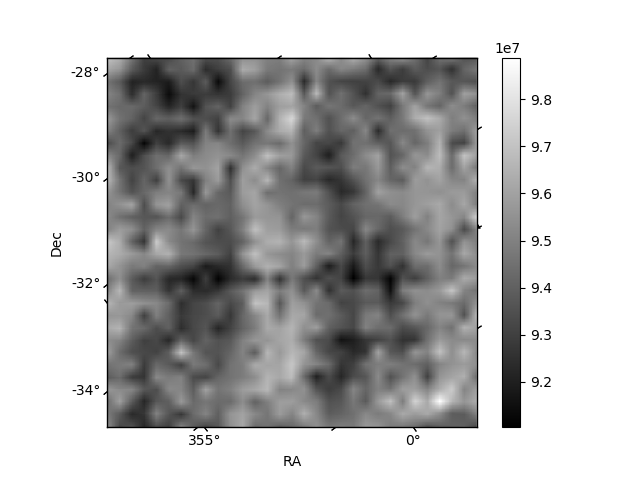
Histogram calculated using DETX and DETY for each event in the final _common_clean file
| Quadrant A | 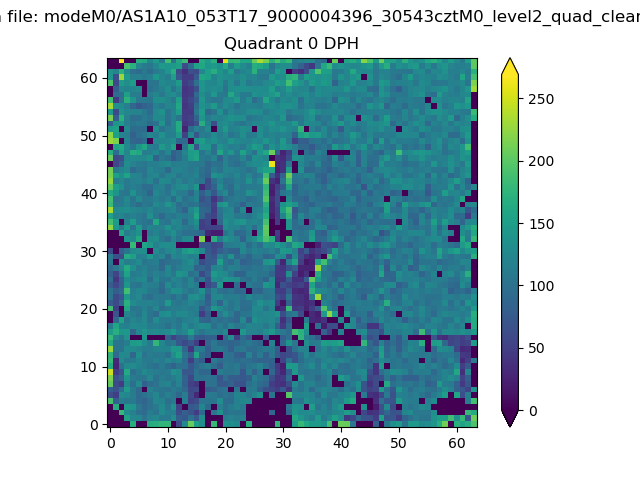 |
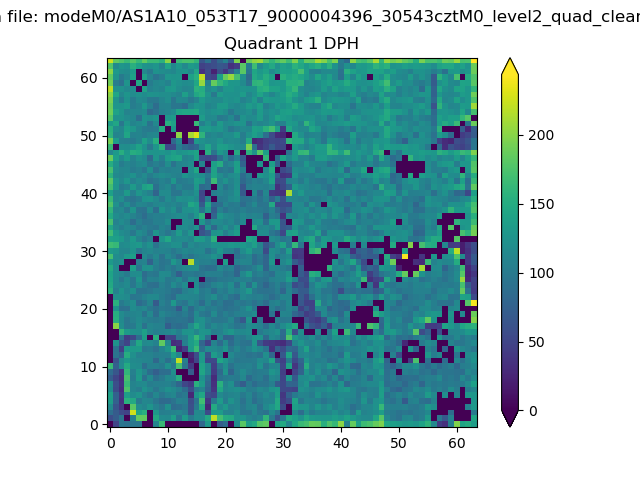 |
Quadrant B |
|---|---|---|---|
| Quadrant D | 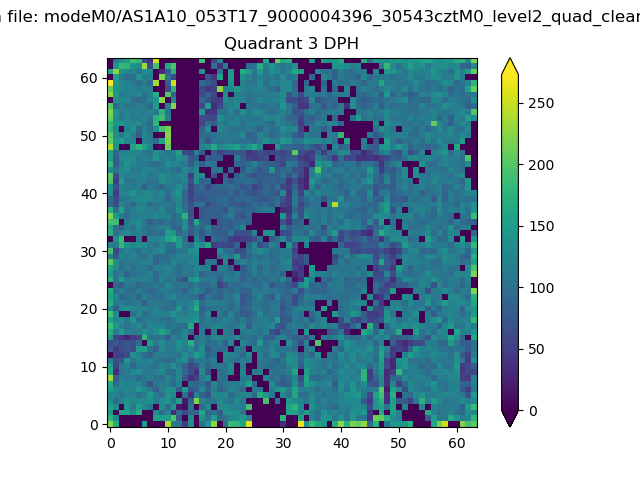 |
 |
Quadrant C |
| Plot type | Count rate plots | Images |
|---|---|---|
| Comparison with Poisson distribution Blue bars denote a histogram of data divided into 1 sec bins. Red curve is a Poisson curve with rate = median count rate of data. |
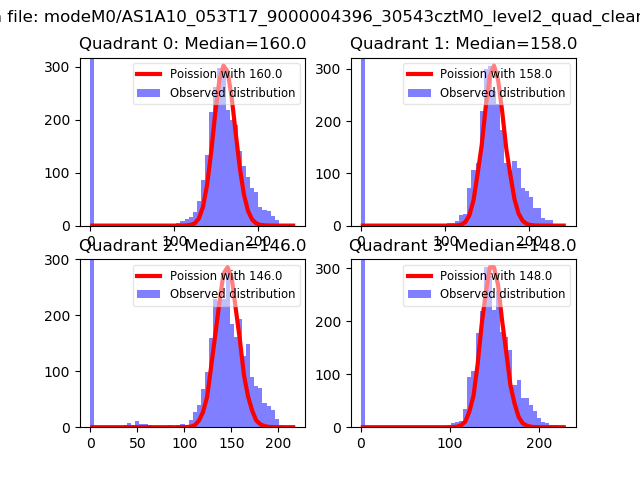 |
 |
| Quadrant-wise count rates Data is divided into 100 sec bins |
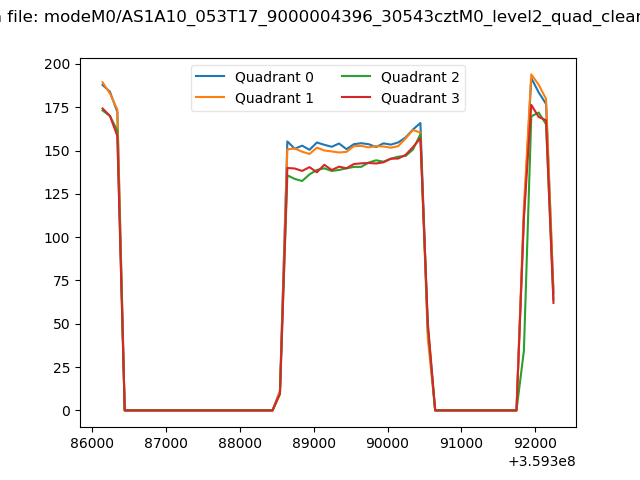 |
|
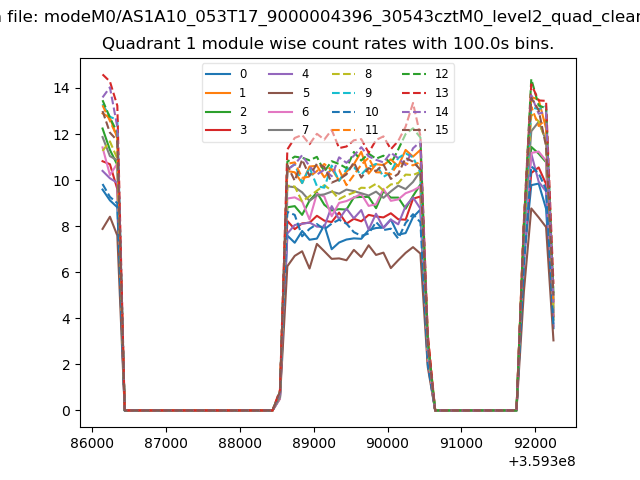
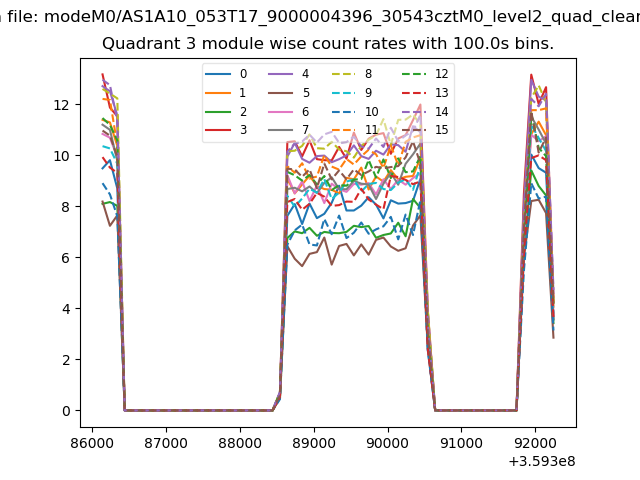
| Module-wise count rates for Quadrant A Data is divided into 100 sec bins |
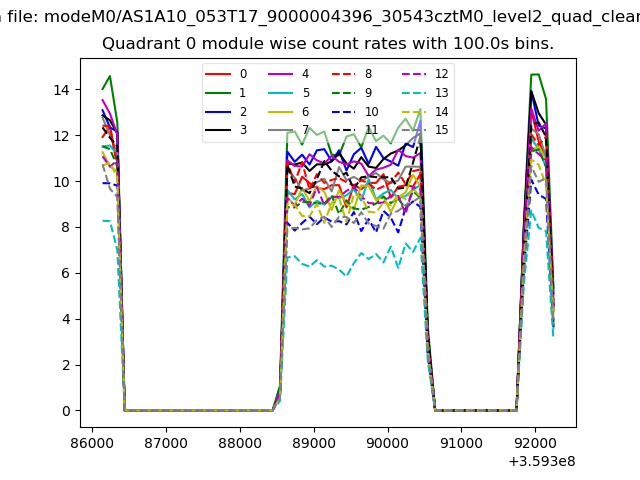 |
 |
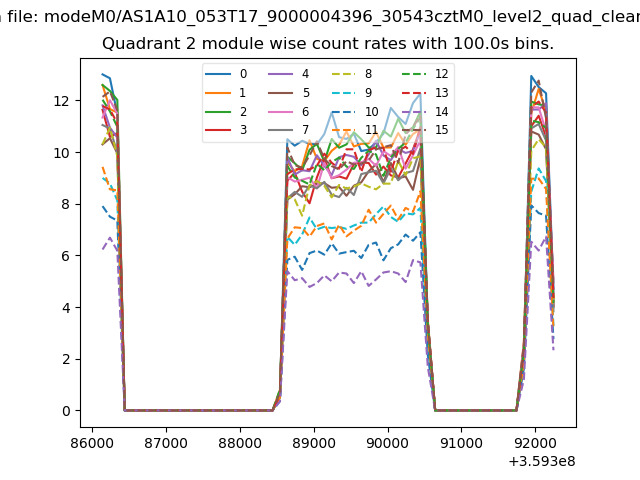
| Module-wise count rates for Quadrant B Data is divided into 100 sec bins |
 |
 |
| Module-wise count rates for Quadrant C Data is divided into 100 sec bins |
 |
 |
| Module-wise count rates for Quadrant D Data is divided into 100 sec bins |
 |
 |
| Parameter | Plot |
|---|---|
| CZT HV Monitor | 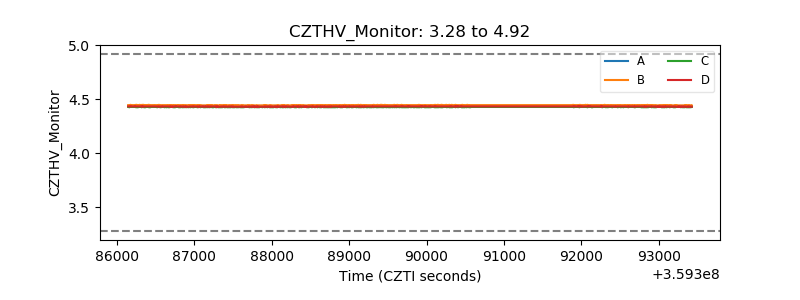 |
| D_VDD | 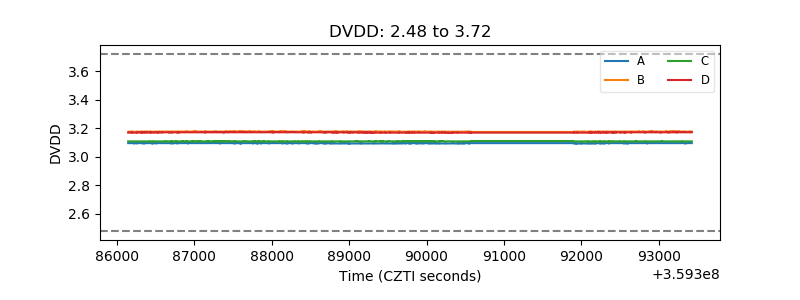 |
| Temperature 1 | 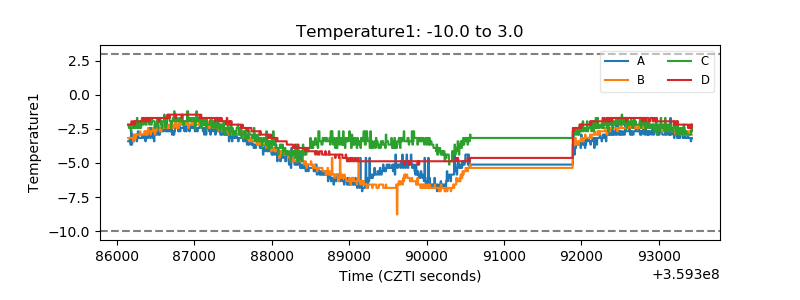 |
| Veto HV Monitor | 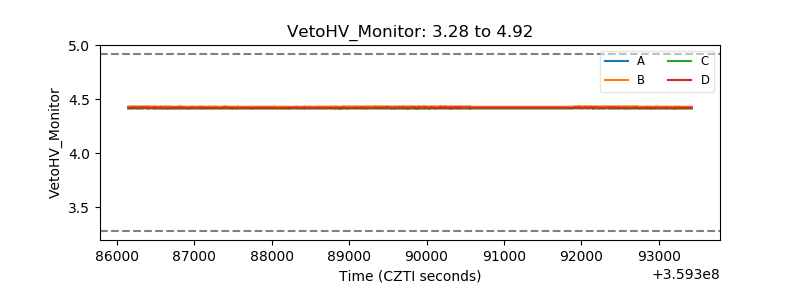 |
| Veto LLD | 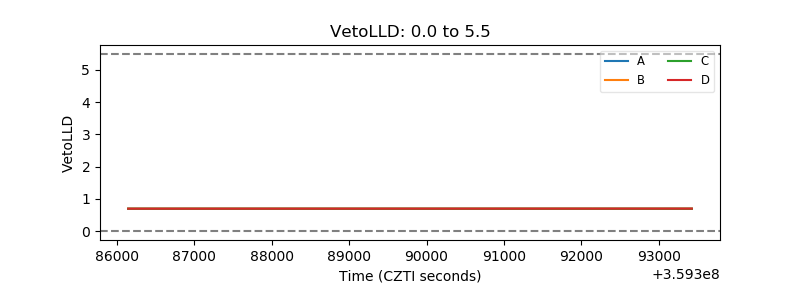 |
| Alpha Counter | 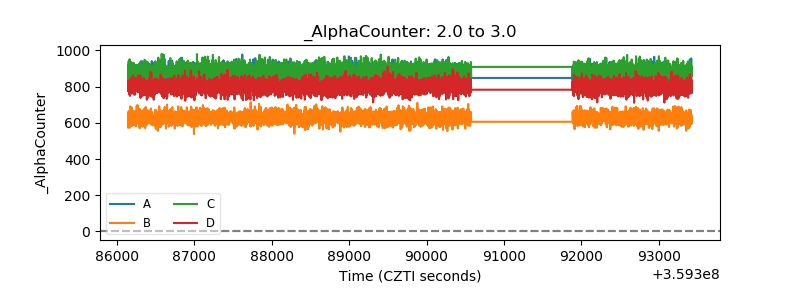 |
| _CPM_Rate | 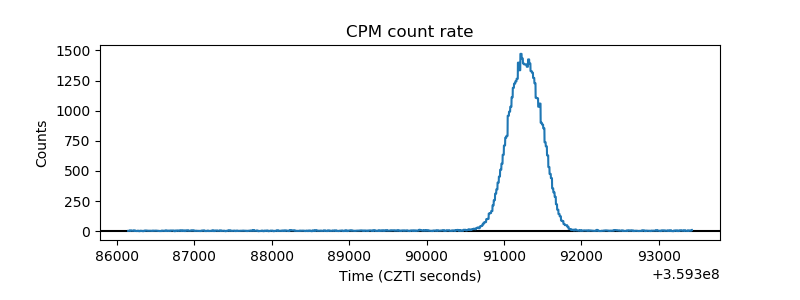 |
| CZT Counter | 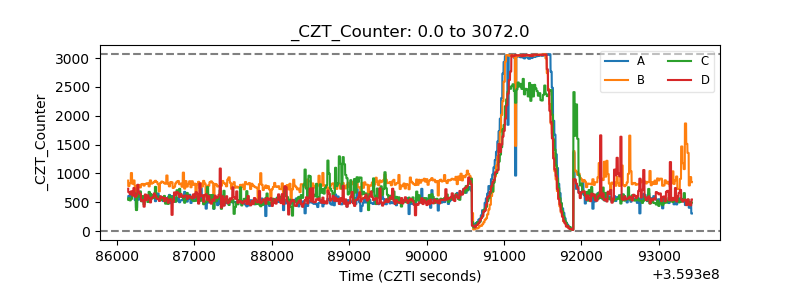 |
| +2.5 Volts monitor | 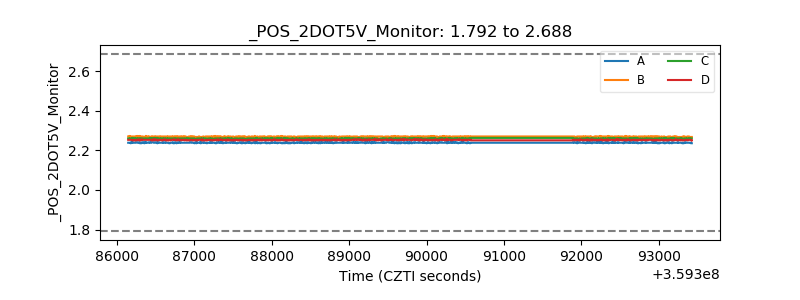 |
| +5 Volts monitor |  |
| _ROLL_ROT | 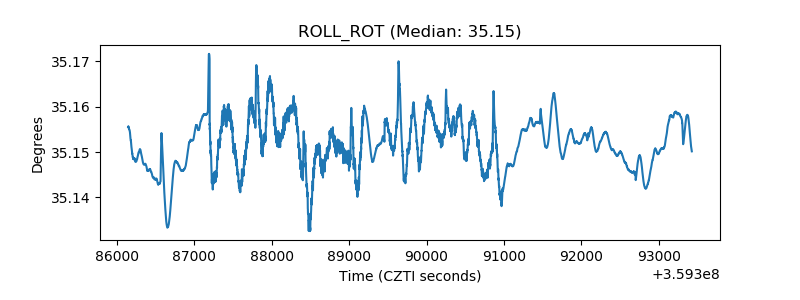 |
| _Roll_DEC |  |
| _Roll_RA | 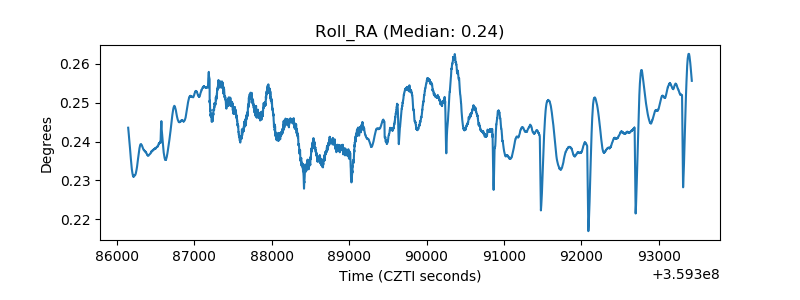 |
| Veto Counter | 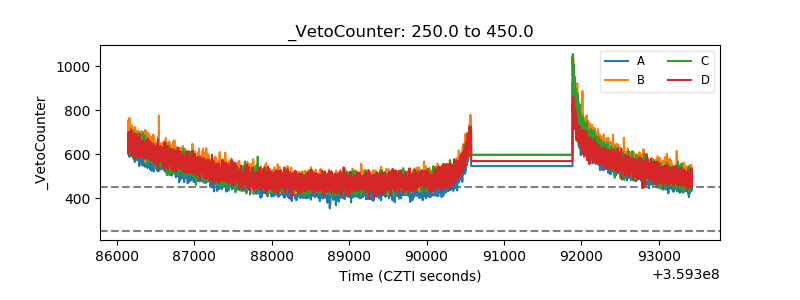 |