| Param | Original file | Final file |
|---|---|---|
| Filename | modeM0/AS1A10_053T17_9000004396_30544cztM0_level2.evt | modeM0/AS1A10_053T17_9000004396_30544cztM0_level2_quad_clean.evt |
| Size (bytes) | 589,792,320 | 60,707,520 |
| Size | 562.5 MB | 57.9 MB |
| Events in quadrant A | 3,161,604 | 374,939 |
| Events in quadrant B | 6,595,606 | 345,354 |
| Events in quadrant C | 3,350,540 | 349,693 |
| Events in quadrant D | 4,343,627 | 343,858 |
| Mode M9 | |||
|---|---|---|---|
| Quadrant | BADHDUFLAG | Total packets | Discarded packets |
| A | 0 | 11 | 0 |
| B | 0 | 11 | 0 |
| C | 0 | 11 | 0 |
| D | 0 | 11 | 0 |
| Mode SS | |||
|---|---|---|---|
| Quadrant | BADHDUFLAG | Total packets | Discarded packets |
| A | 0 | 124 | 0 |
| B | 0 | 124 | 0 |
| C | 0 | 124 | 0 |
| D | 0 | 124 | 0 |
| Mode M0 | |||
|---|---|---|---|
| Quadrant | BADHDUFLAG | Total packets | Discarded packets |
| A | 0 | 12736 | 1 |
| B | 0 | 23591 | 2 |
| C | 0 | 13364 | 1 |
| D | 0 | 16723 | 1 |
| Quadrant | Total seconds | Saturated seconds | Saturation percentage |
|---|---|---|---|
| A | 6065 | 110 | 1.813685% |
| B | 6065 | 912 | 15.037098% |
| C | 6065 | 209 | 3.446002% |
| D | 6065 | 158 | 2.605111% |
Noise dominated data is calculated using 1-second bins in cleaned event files. If a bin has >2000 counts, and if more than 50% of those come from <1% of pixels, then it is considered to be noise-dominated and hence unusable.
| Quadrant | # 1 sec bins | Bins with >0 counts | Bins with >2000 counts | High rate bins dominated by noise | Noise dominated (total time) | Noise dominated (detector-on time) | Marked lightcurve |
|---|---|---|---|---|---|---|---|
| A | 7185 | 6066 | 2 | 2 | 0.03% | 0.03% | 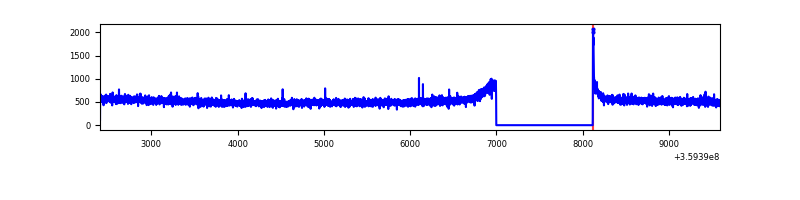 |
| B | 7185 | 6066 | 528 | 528 | 7.35% | 8.70% | 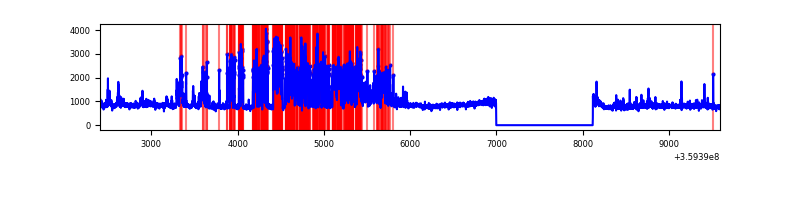 |
| C | 7185 | 6066 | 53 | 53 | 0.74% | 0.87% | 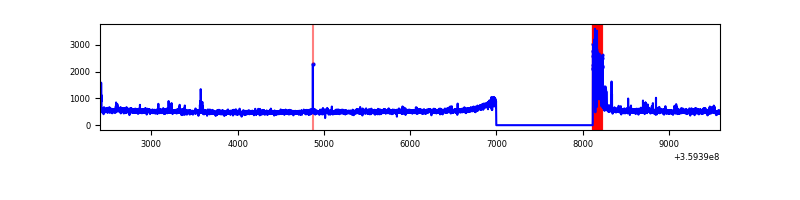 |
| D | 7185 | 6066 | 145 | 145 | 2.02% | 2.39% | 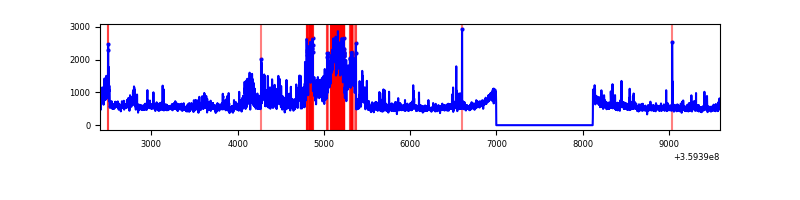 |
Top three noisy pixels from each quadrant. If the there are fewer than three noisy pixels in the level2.evt file, extra rows are filled as -1
| Pixel properties | Quadrant properties | ||||||
|---|---|---|---|---|---|---|---|
| Quadrant | DetID | PixID | Counts | Sigma | Mean | Median | Sigma |
| A | 8 | 192 | 13621 | 79.66 | 816 | 801 | 160.9 |
| A | 13 | 254 | 10513 | 60.35 | 816 | 801 | 160.9 |
| A | 3 | 137 | 7895 | 44.08 | 816 | 801 | 160.9 |
| B | 6 | 36 | 1908709 | 12954.65 | 769 | 750 | 147.3 |
| B | 6 | 159 | 1612723 | 10944.97 | 769 | 750 | 147.3 |
| B | 3 | 209 | 35395 | 235.23 | 769 | 750 | 147.3 |
| C | 0 | 10 | 230937 | 1331.02 | 753 | 762 | 172.9 |
| C | 14 | 238 | 123963 | 712.43 | 753 | 762 | 172.9 |
| C | 3 | 233 | 42012 | 238.53 | 753 | 762 | 172.9 |
| D | 12 | 227 | 1048850 | 5747.37 | 780 | 761 | 182.4 |
| D | 8 | 195 | 238755 | 1305.08 | 780 | 761 | 182.4 |
| D | 1 | 52 | 54940 | 297.1 | 780 | 761 | 182.4 |
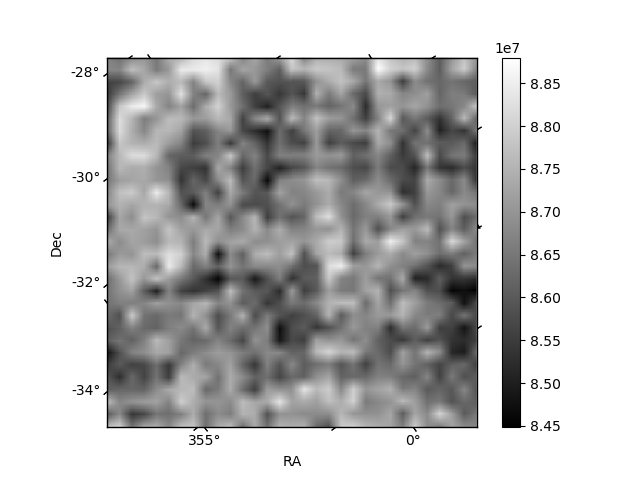
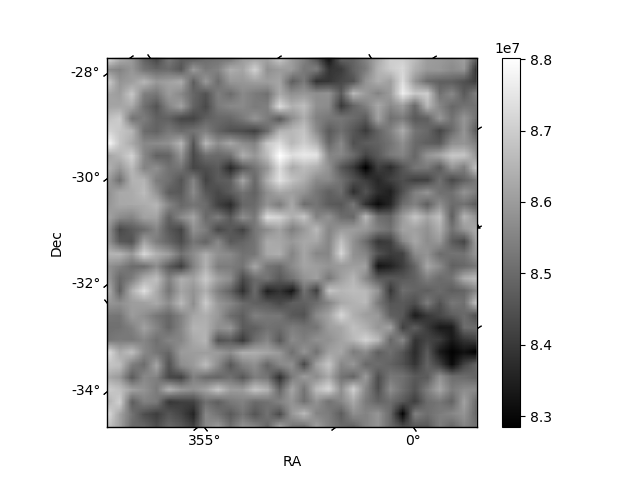
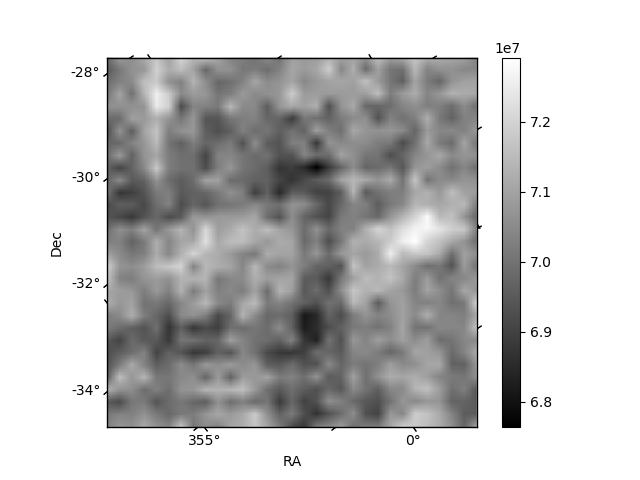
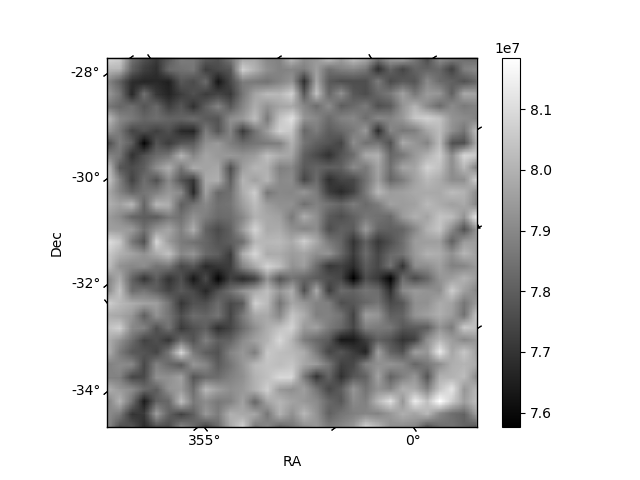
Histogram calculated using DETX and DETY for each event in the final _common_clean file
| Quadrant A | 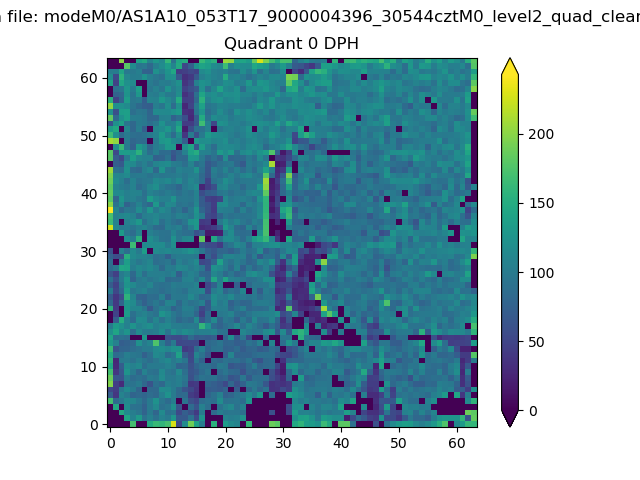 |
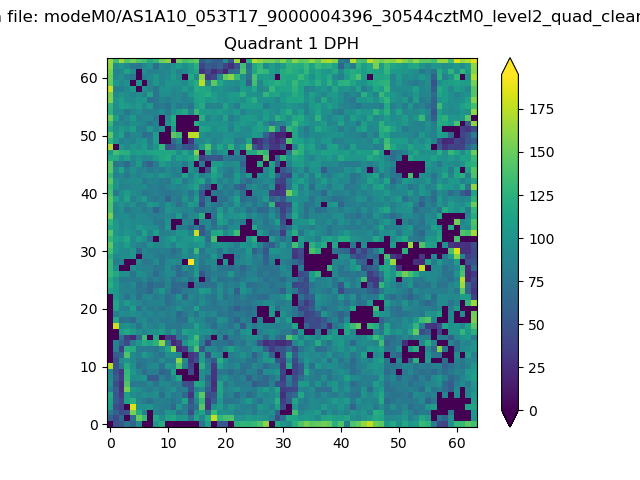 |
Quadrant B |
|---|---|---|---|
| Quadrant D | 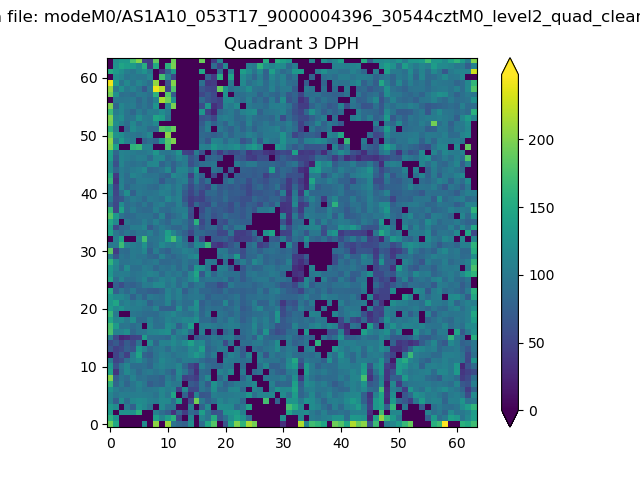 |
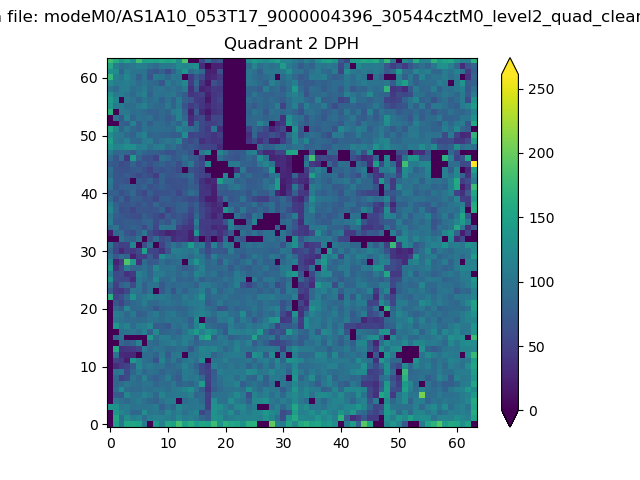 |
Quadrant C |
| Plot type | Count rate plots | Images |
|---|---|---|
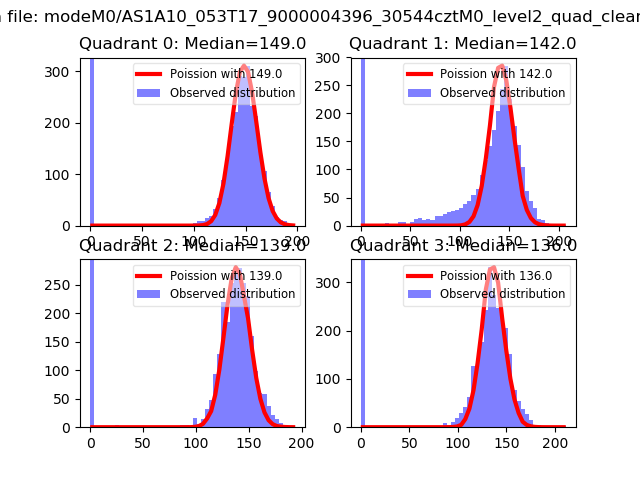
| Comparison with Poisson distribution Blue bars denote a histogram of data divided into 1 sec bins. Red curve is a Poisson curve with rate = median count rate of data. |
 |
 |
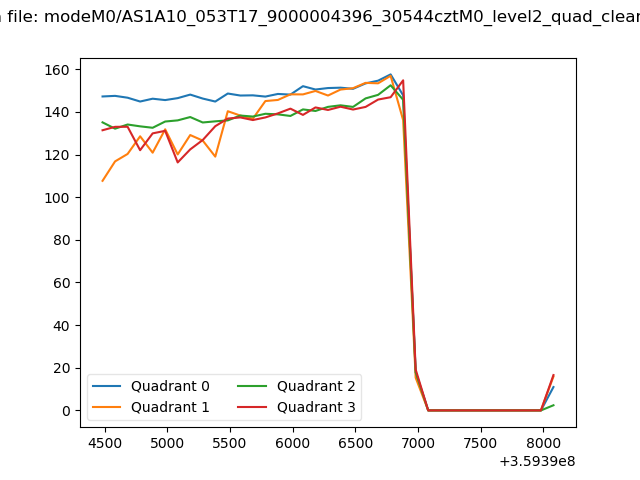
| Quadrant-wise count rates Data is divided into 100 sec bins |
 |
|
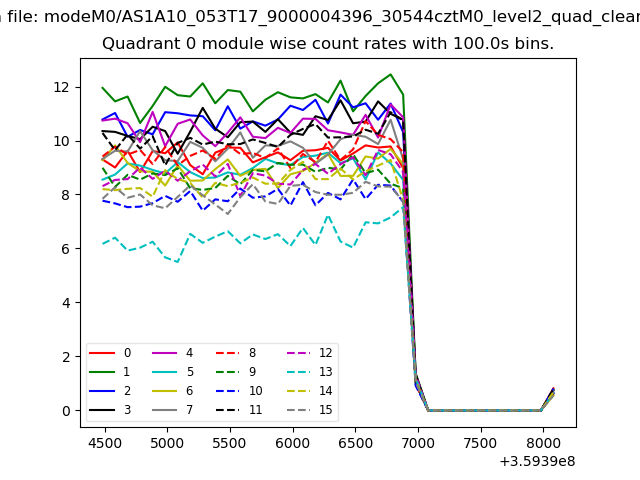
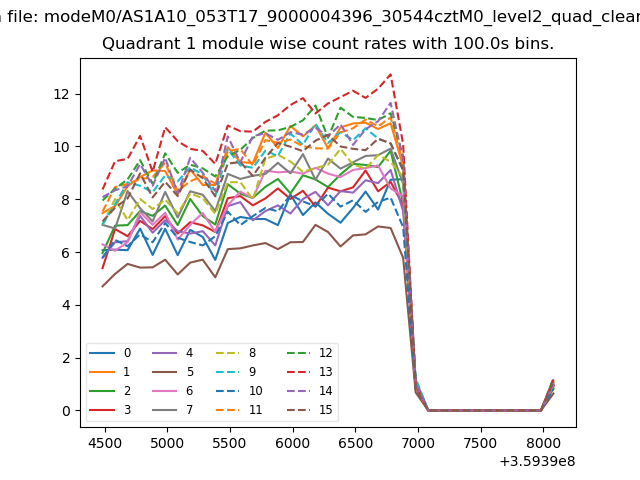
| Module-wise count rates for Quadrant A Data is divided into 100 sec bins |
 |
 |
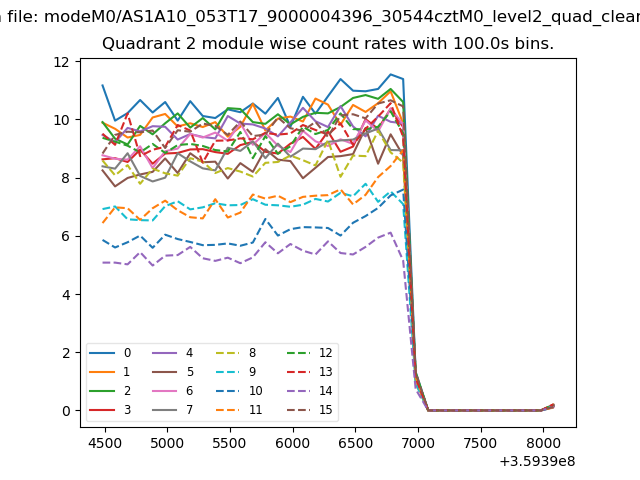
| Module-wise count rates for Quadrant B Data is divided into 100 sec bins |
 |
 |
| Module-wise count rates for Quadrant C Data is divided into 100 sec bins |
 |
 |
| Module-wise count rates for Quadrant D Data is divided into 100 sec bins |
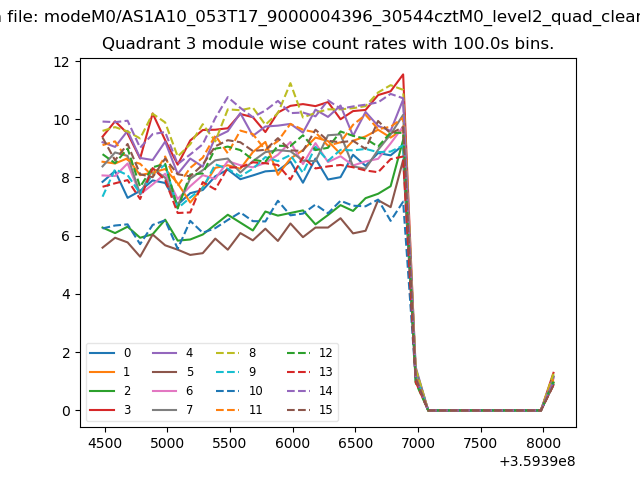 |
 |
| Parameter | Plot |
|---|---|
| CZT HV Monitor | 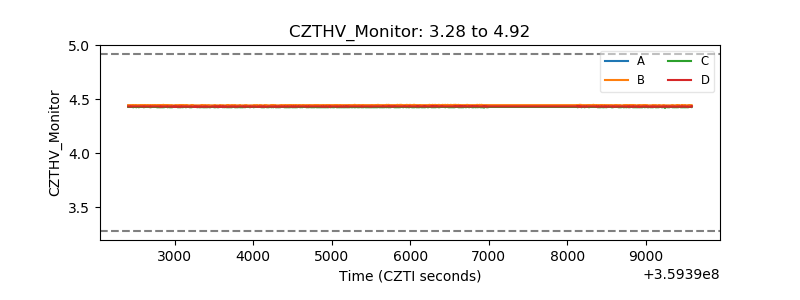 |
| D_VDD | 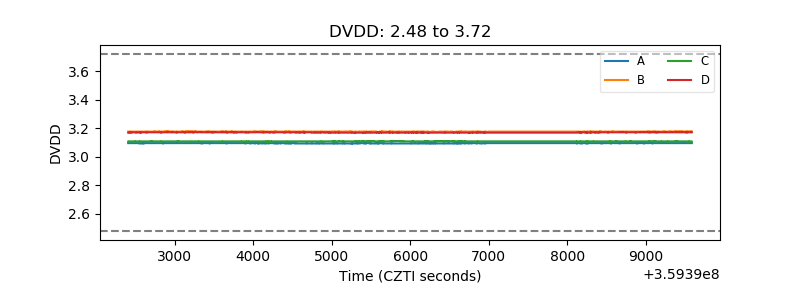 |
| Temperature 1 | 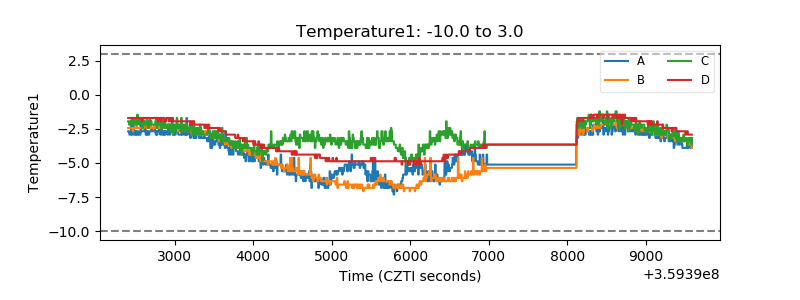 |
| Veto HV Monitor | 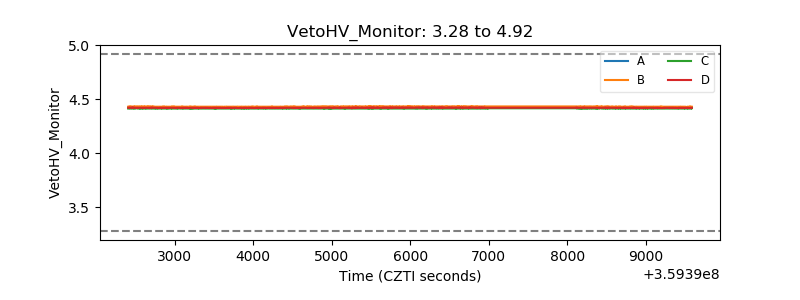 |
| Veto LLD | 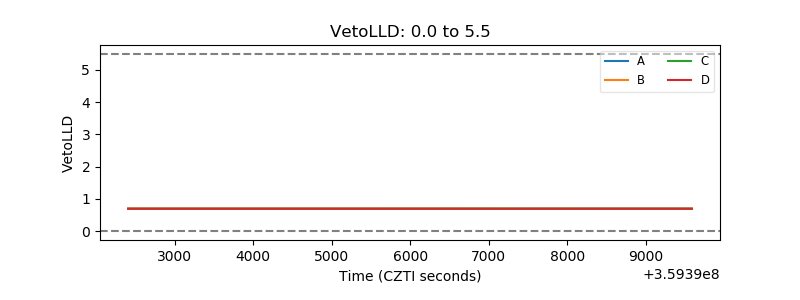 |
| Alpha Counter | 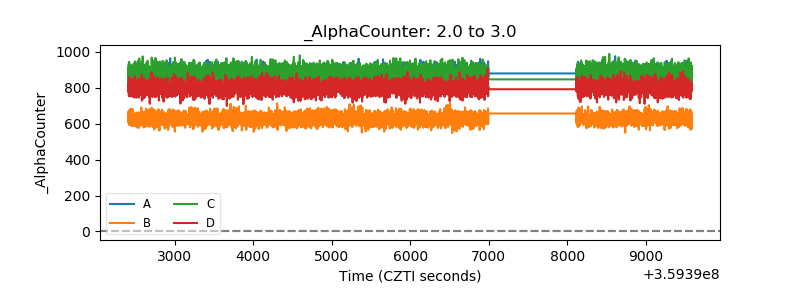 |
| _CPM_Rate | 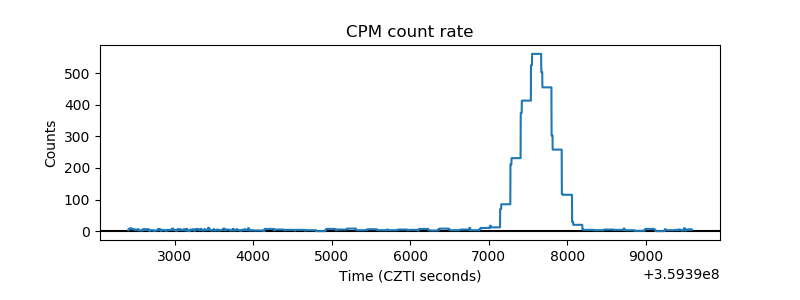 |
| CZT Counter | 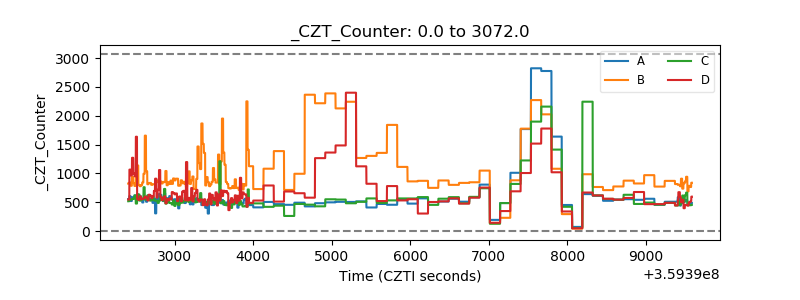 |
| +2.5 Volts monitor |  |
| +5 Volts monitor | 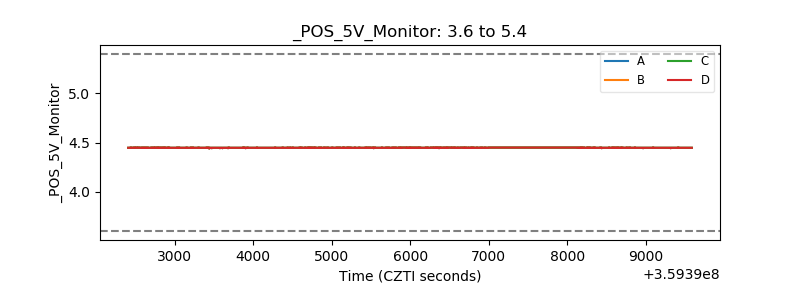 |
| _ROLL_ROT |  |
| _Roll_DEC |  |
| _Roll_RA | 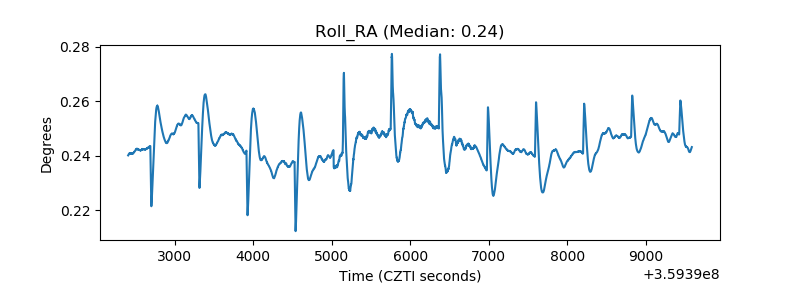 |
| Veto Counter | 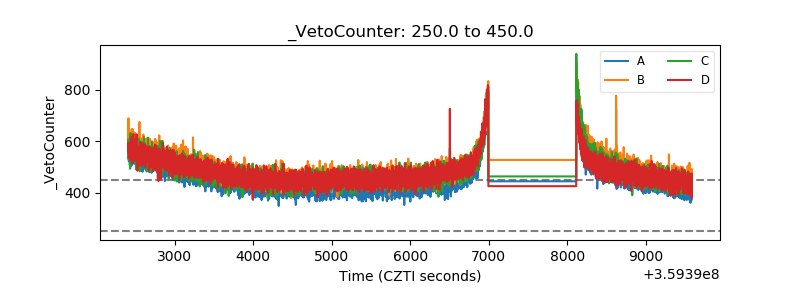 |