| Param | Original file | Final file |
|---|---|---|
| Filename | modeM0/AS1A10_053T17_9000004396_30545cztM0_level2.evt | modeM0/AS1A10_053T17_9000004396_30545cztM0_level2_quad_clean.evt |
| Size (bytes) | 528,338,880 | 72,371,520 |
| Size | 503.9 MB | 69.0 MB |
| Events in quadrant A | 3,137,045 | 451,801 |
| Events in quadrant B | 5,059,033 | 445,528 |
| Events in quadrant C | 3,277,579 | 427,285 |
| Events in quadrant D | 4,099,295 | 426,425 |
| Mode M9 | |||
|---|---|---|---|
| Quadrant | BADHDUFLAG | Total packets | Discarded packets |
| A | 0 | 8 | 0 |
| B | 0 | 8 | 0 |
| C | 0 | 8 | 0 |
| D | 0 | 8 | 0 |
| Mode SS | |||
|---|---|---|---|
| Quadrant | BADHDUFLAG | Total packets | Discarded packets |
| A | 0 | 128 | 0 |
| B | 0 | 128 | 0 |
| C | 0 | 128 | 0 |
| D | 0 | 128 | 0 |
| Mode M0 | |||
|---|---|---|---|
| Quadrant | BADHDUFLAG | Total packets | Discarded packets |
| A | 0 | 13049 | 1 |
| B | 0 | 19413 | 1 |
| C | 0 | 13430 | 1 |
| D | 0 | 15947 | 1 |
| Quadrant | Total seconds | Saturated seconds | Saturation percentage |
|---|---|---|---|
| A | 6309 | 86 | 1.363132% |
| B | 6310 | 165 | 2.614897% |
| C | 6310 | 161 | 2.551506% |
| D | 6310 | 348 | 5.515055% |
Noise dominated data is calculated using 1-second bins in cleaned event files. If a bin has >2000 counts, and if more than 50% of those come from <1% of pixels, then it is considered to be noise-dominated and hence unusable.
| Quadrant | # 1 sec bins | Bins with >0 counts | Bins with >2000 counts | High rate bins dominated by noise | Noise dominated (total time) | Noise dominated (detector-on time) | Marked lightcurve |
|---|---|---|---|---|---|---|---|
| A | 7109 | 6309 | 0 | 0 | 0.00% | 0.00% |  |
| B | 7110 | 6310 | 17 | 17 | 0.24% | 0.27% |  |
| C | 7110 | 6310 | 35 | 35 | 0.49% | 0.55% |  |
| D | 7110 | 6310 | 239 | 239 | 3.36% | 3.79% |  |
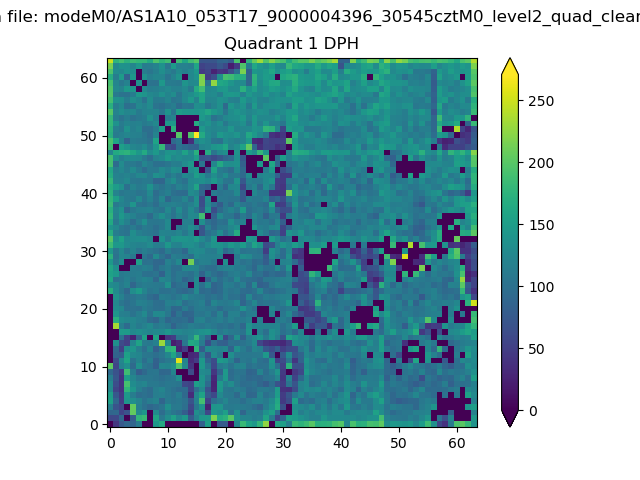
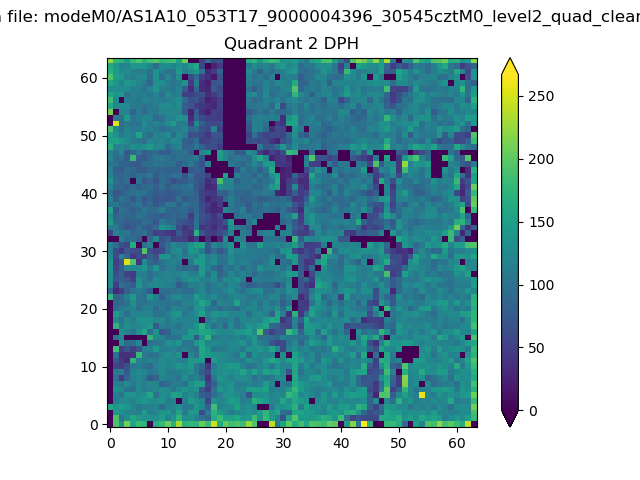
Top three noisy pixels from each quadrant. If the there are fewer than three noisy pixels in the level2.evt file, extra rows are filled as -1
| Pixel properties | Quadrant properties | ||||||
|---|---|---|---|---|---|---|---|
| Quadrant | DetID | PixID | Counts | Sigma | Mean | Median | Sigma |
| A | 8 | 192 | 12596 | 73.0 | 810 | 795 | 161.7 |
| A | 13 | 254 | 11410 | 65.66 | 810 | 795 | 161.7 |
| A | 3 | 137 | 8022 | 44.7 | 810 | 795 | 161.7 |
| B | 6 | 159 | 1770963 | 11543.42 | 793 | 775 | 153.4 |
| B | 6 | 36 | 60858 | 391.8 | 793 | 775 | 153.4 |
| B | 4 | 171 | 51220 | 328.95 | 793 | 775 | 153.4 |
| C | 0 | 10 | 133846 | 750.87 | 756 | 760 | 177.2 |
| C | 14 | 238 | 131605 | 738.22 | 756 | 760 | 177.2 |
| C | 3 | 233 | 38402 | 212.37 | 756 | 760 | 177.2 |
| D | 7 | 238 | 706642 | 3914.27 | 766 | 747 | 180.3 |
| D | 8 | 195 | 242450 | 1340.27 | 766 | 747 | 180.3 |
| D | 1 | 52 | 111728 | 615.4 | 766 | 747 | 180.3 |
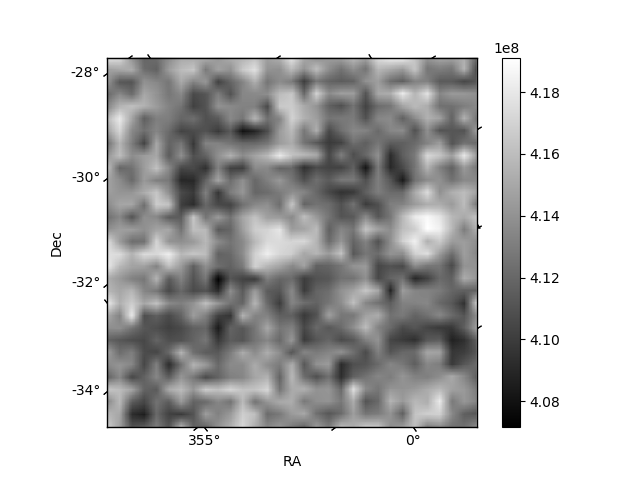
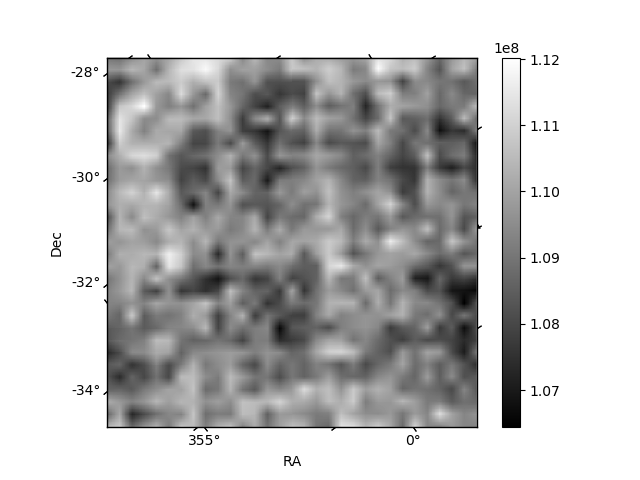
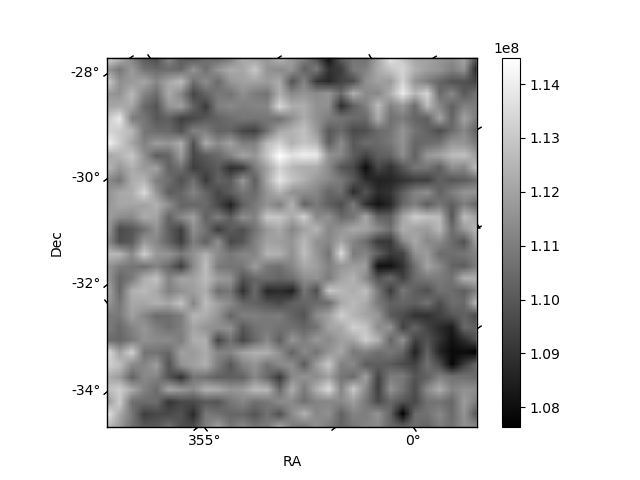
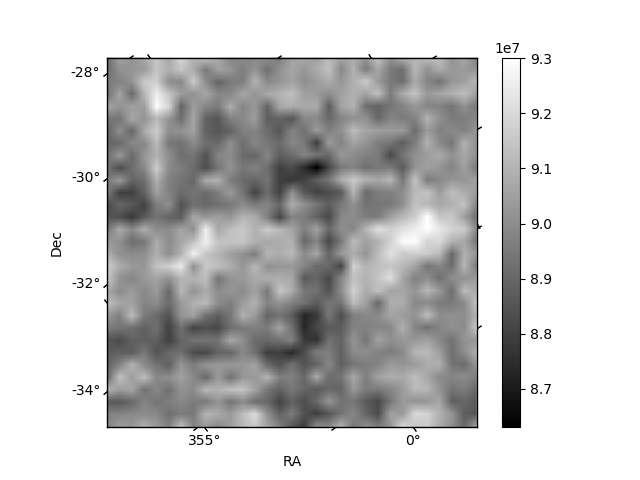
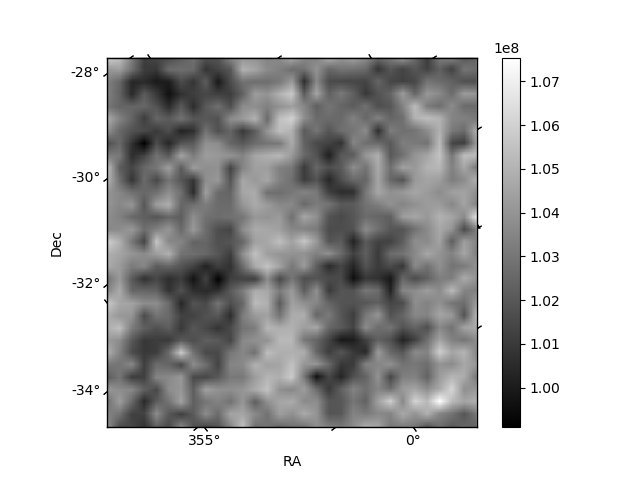
Histogram calculated using DETX and DETY for each event in the final _common_clean file
| Quadrant A | 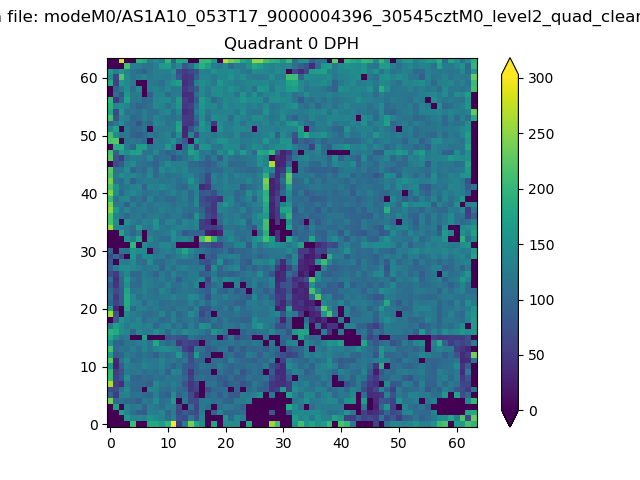 |
 |
Quadrant B |
|---|---|---|---|
| Quadrant D | 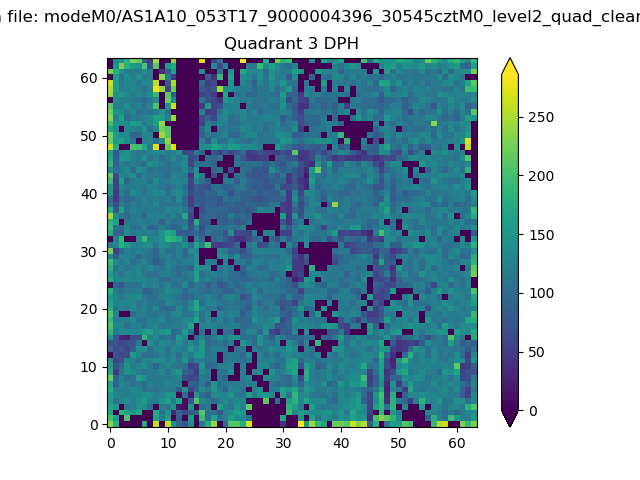 |
 |
Quadrant C |
| Plot type | Count rate plots | Images |
|---|---|---|
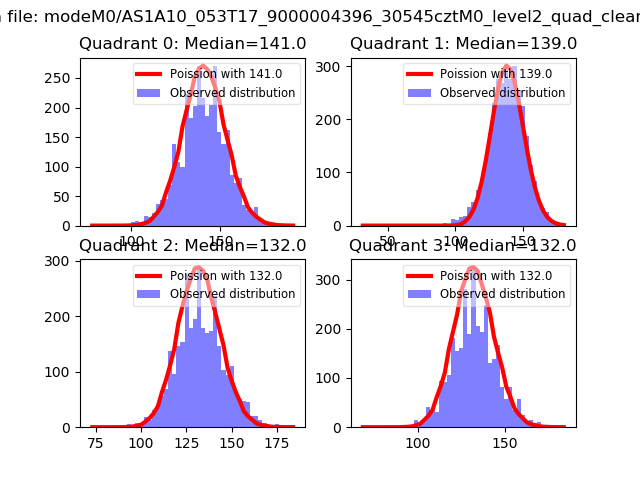
| Comparison with Poisson distribution Blue bars denote a histogram of data divided into 1 sec bins. Red curve is a Poisson curve with rate = median count rate of data. |
 |
 |
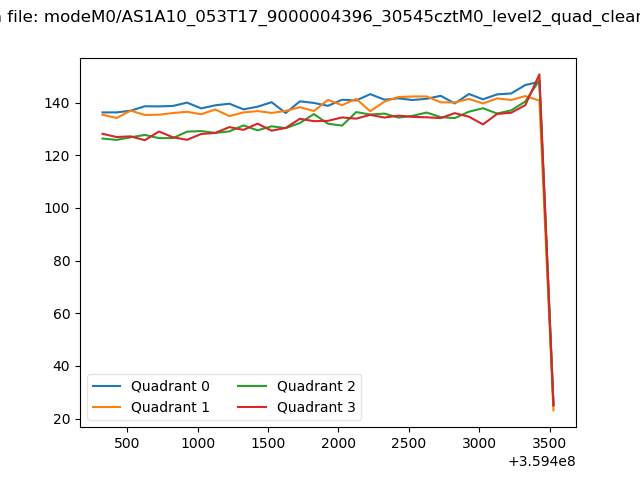
| Quadrant-wise count rates Data is divided into 100 sec bins |
 |
|
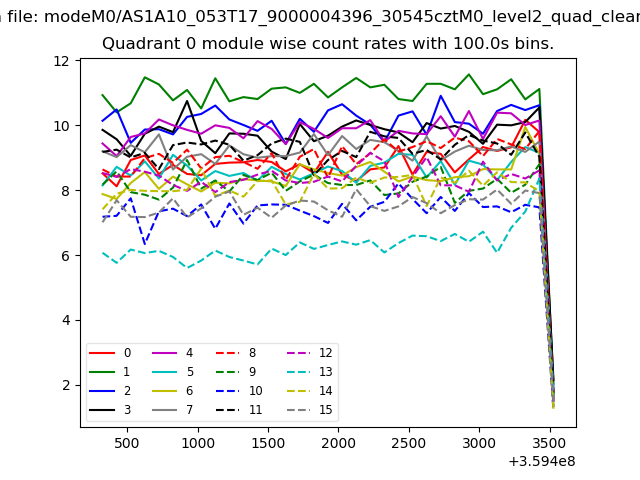
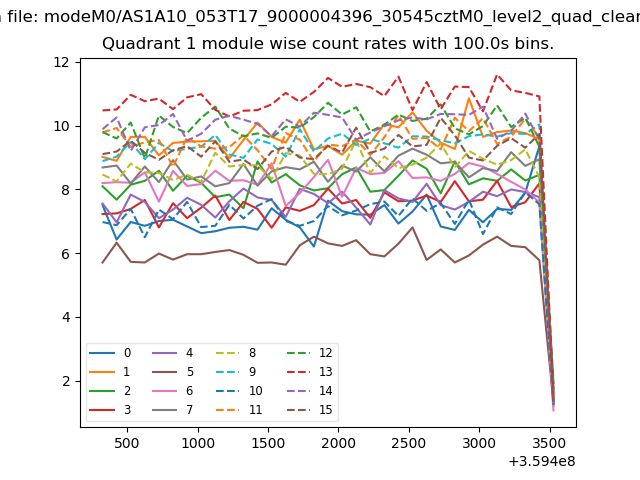
| Module-wise count rates for Quadrant A Data is divided into 100 sec bins |
 |
 |
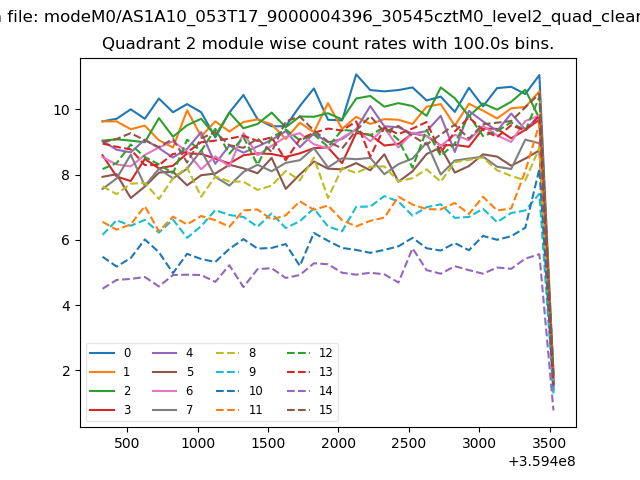
| Module-wise count rates for Quadrant B Data is divided into 100 sec bins |
 |
 |
| Module-wise count rates for Quadrant C Data is divided into 100 sec bins |
 |
 |
| Module-wise count rates for Quadrant D Data is divided into 100 sec bins |
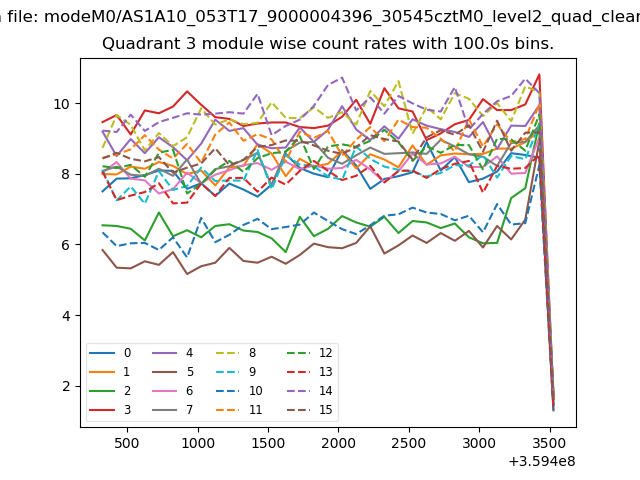 |
 |
| Parameter | Plot |
|---|---|
| CZT HV Monitor | 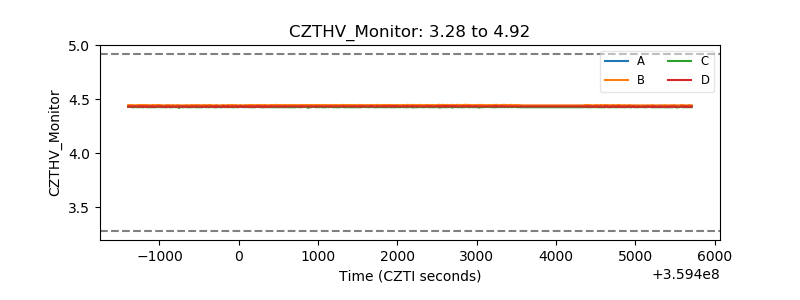 |
| D_VDD | 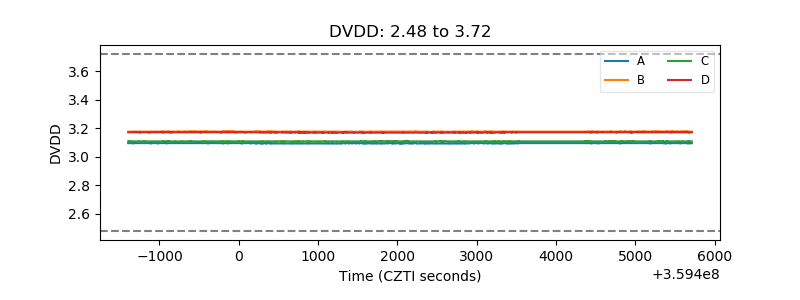 |
| Temperature 1 | 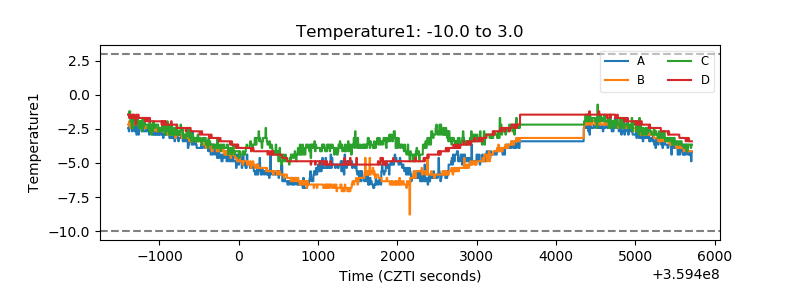 |
| Veto HV Monitor | 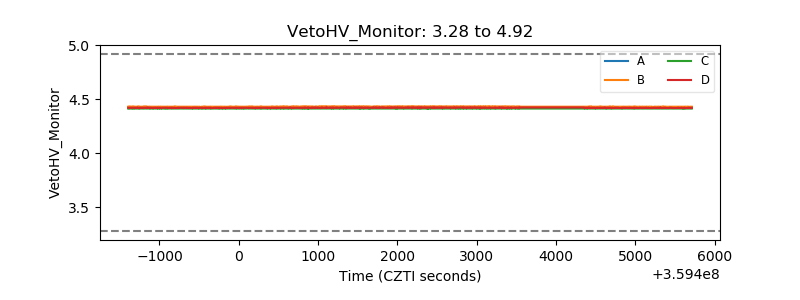 |
| Veto LLD | 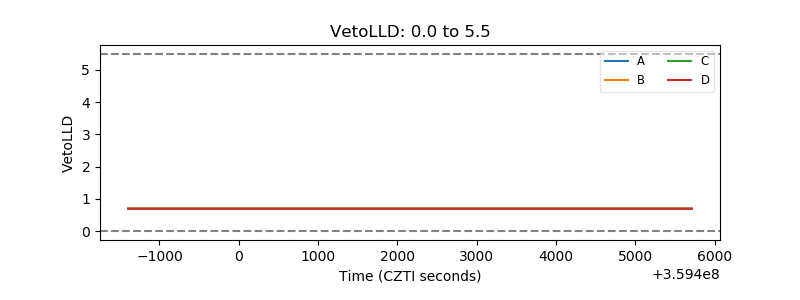 |
| Alpha Counter | 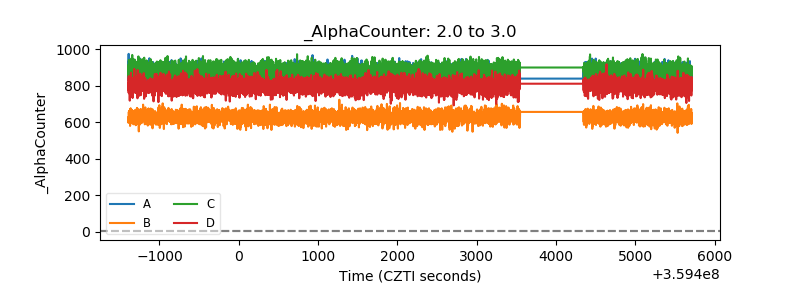 |
| _CPM_Rate | 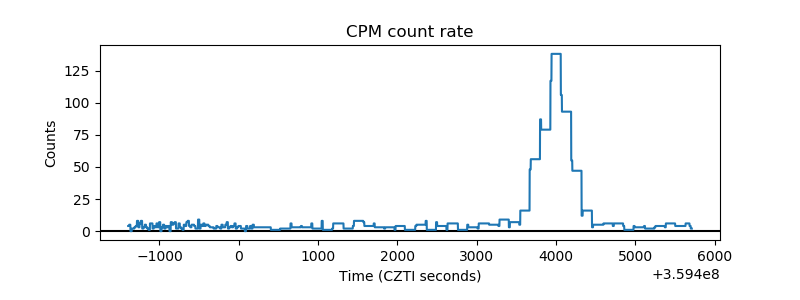 |
| CZT Counter | 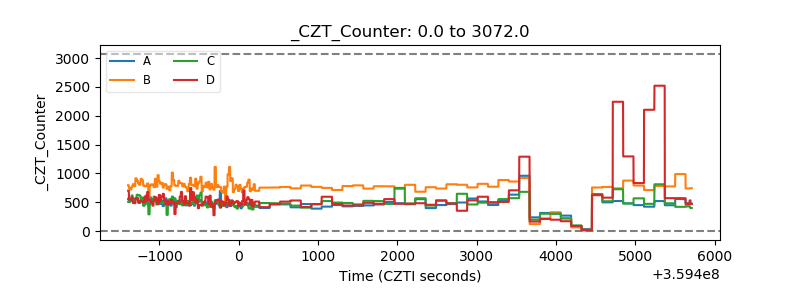 |
| +2.5 Volts monitor |  |
| +5 Volts monitor | 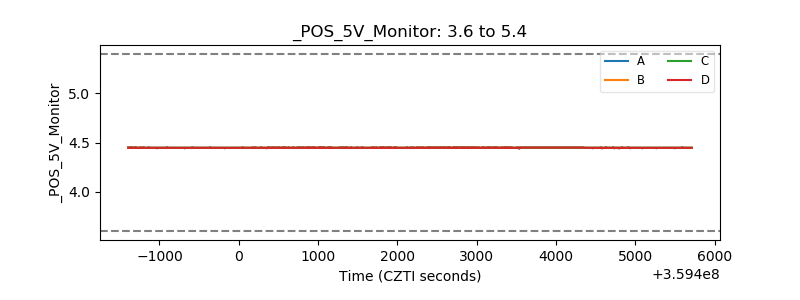 |
| _ROLL_ROT | 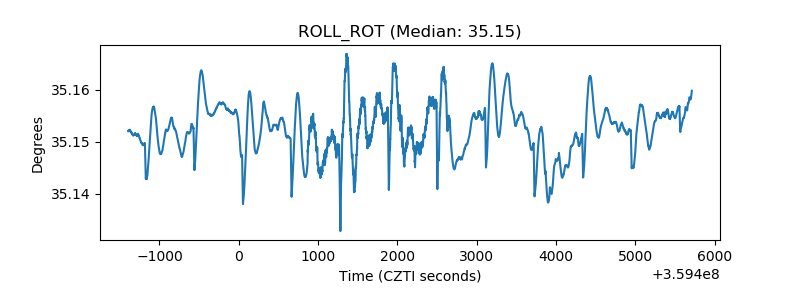 |
| _Roll_DEC | 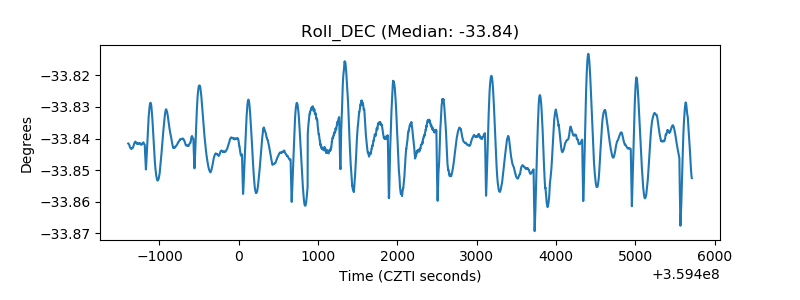 |
| _Roll_RA | 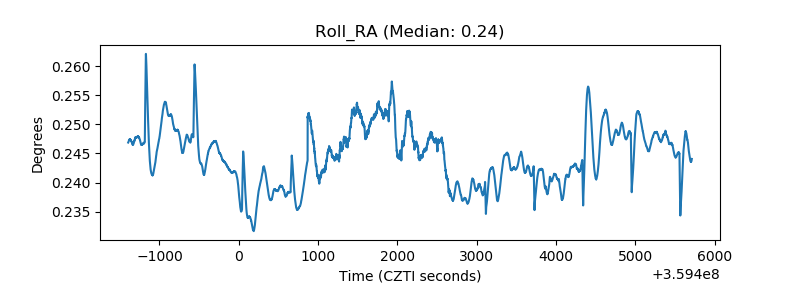 |
| Veto Counter | 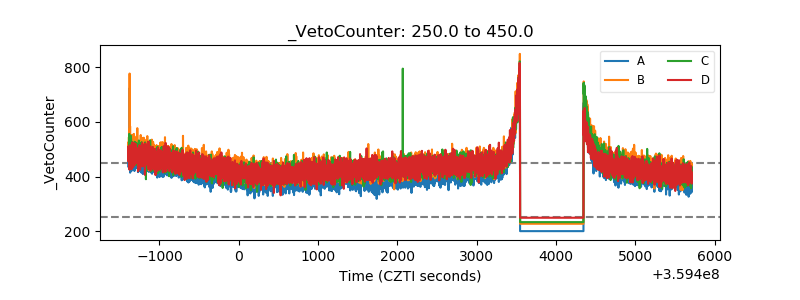 |