| Param | Original file | Final file |
|---|---|---|
| Filename | modeM0/AS1A10_053T17_9000004396_30546cztM0_level2.evt | modeM0/AS1A10_053T17_9000004396_30546cztM0_level2_quad_clean.evt |
| Size (bytes) | 214,787,520 | 15,543,360 |
| Size | 204.8 MB | 14.8 MB |
| Events in quadrant A | 1,180,820 | 76,827 |
| Events in quadrant B | 1,865,326 | 76,077 |
| Events in quadrant C | 1,279,529 | 71,112 |
| Events in quadrant D | 2,012,630 | 71,499 |
| Mode M9 | |||
|---|---|---|---|
| Quadrant | BADHDUFLAG | Total packets | Discarded packets |
| A | 0 | 5 | 0 |
| B | 0 | 6 | 0 |
| C | 0 | 6 | 0 |
| D | 0 | 6 | 0 |
| Mode SS | |||
|---|---|---|---|
| Quadrant | BADHDUFLAG | Total packets | Discarded packets |
| A | 0 | 50 | 0 |
| B | 0 | 50 | 0 |
| C | 0 | 50 | 0 |
| D | 0 | 50 | 0 |
| Mode M0 | |||
|---|---|---|---|
| Quadrant | BADHDUFLAG | Total packets | Discarded packets |
| A | 0 | 4999 | 1 |
| B | 0 | 7373 | 1 |
| C | 0 | 5318 | 1 |
| D | 0 | 7545 | 1 |
| Quadrant | Total seconds | Saturated seconds | Saturation percentage |
|---|---|---|---|
| A | 2418 | 19 | 0.785773% |
| B | 2418 | 48 | 1.985112% |
| C | 2418 | 99 | 4.094293% |
| D | 2418 | 314 | 12.985939% |
Noise dominated data is calculated using 1-second bins in cleaned event files. If a bin has >2000 counts, and if more than 50% of those come from <1% of pixels, then it is considered to be noise-dominated and hence unusable.
| Quadrant | # 1 sec bins | Bins with >0 counts | Bins with >2000 counts | High rate bins dominated by noise | Noise dominated (total time) | Noise dominated (detector-on time) | Marked lightcurve |
|---|---|---|---|---|---|---|---|
| A | 2417 | 2417 | 0 | 0 | 0.00% | 0.00% | 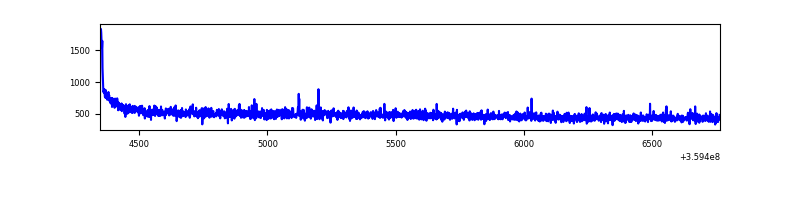 |
| B | 2417 | 2417 | 2 | 2 | 0.08% | 0.08% | 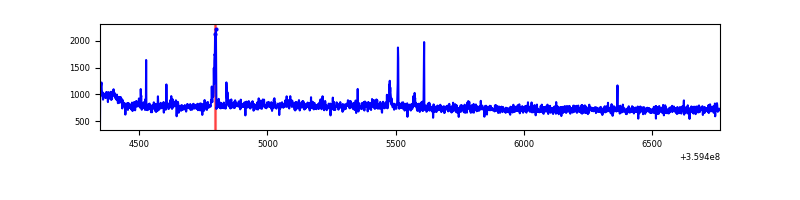 |
| C | 2417 | 2417 | 35 | 35 | 1.45% | 1.45% | 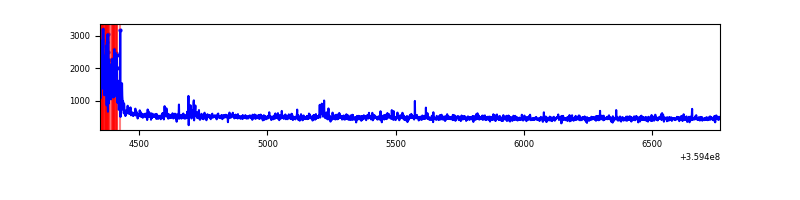 |
| D | 2417 | 2417 | 238 | 238 | 9.85% | 9.85% | 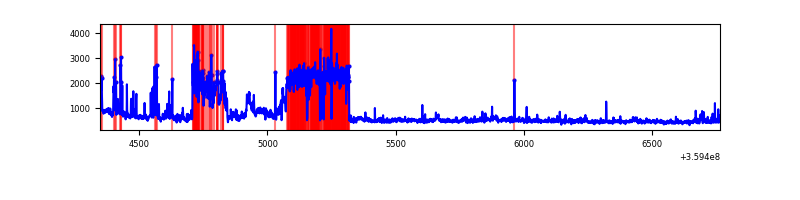 |
Top three noisy pixels from each quadrant. If the there are fewer than three noisy pixels in the level2.evt file, extra rows are filled as -1
| Pixel properties | Quadrant properties | ||||||
|---|---|---|---|---|---|---|---|
| Quadrant | DetID | PixID | Counts | Sigma | Mean | Median | Sigma |
| A | 8 | 192 | 11860 | 184.3 | 303 | 296 | 62.7 |
| A | 13 | 254 | 4680 | 69.87 | 303 | 296 | 62.7 |
| A | 3 | 137 | 3029 | 43.56 | 303 | 296 | 62.7 |
| B | 6 | 159 | 656023 | 11057.83 | 297 | 289 | 59.3 |
| B | 5 | 172 | 21556 | 358.63 | 297 | 289 | 59.3 |
| B | 12 | 111 | 7064 | 114.25 | 297 | 289 | 59.3 |
| C | 0 | 10 | 132869 | 2027.95 | 274 | 275 | 65.4 |
| C | 14 | 238 | 54573 | 830.46 | 274 | 275 | 65.4 |
| C | 14 | 254 | 12915 | 193.32 | 274 | 275 | 65.4 |
| D | 7 | 238 | 703137 | 10373.06 | 275 | 267 | 67.8 |
| D | 8 | 195 | 113651 | 1673.34 | 275 | 267 | 67.8 |
| D | 1 | 52 | 68654 | 1009.27 | 275 | 267 | 67.8 |
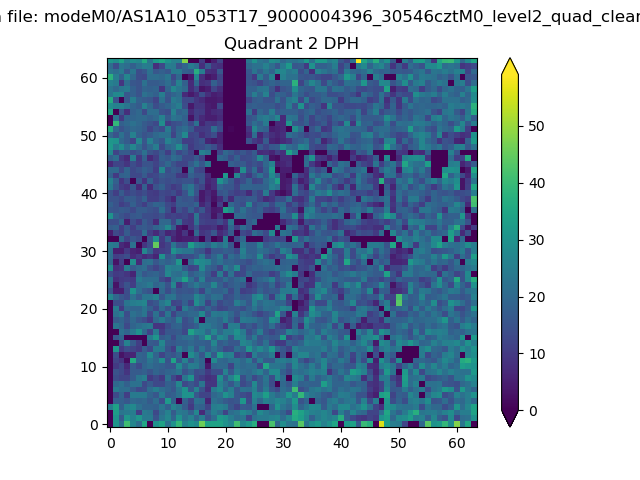
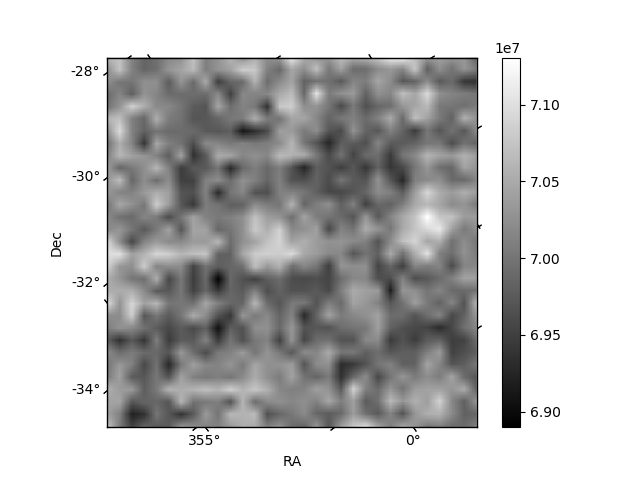
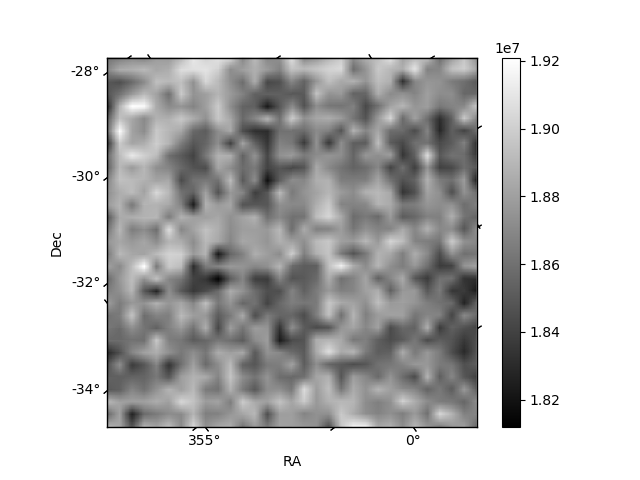
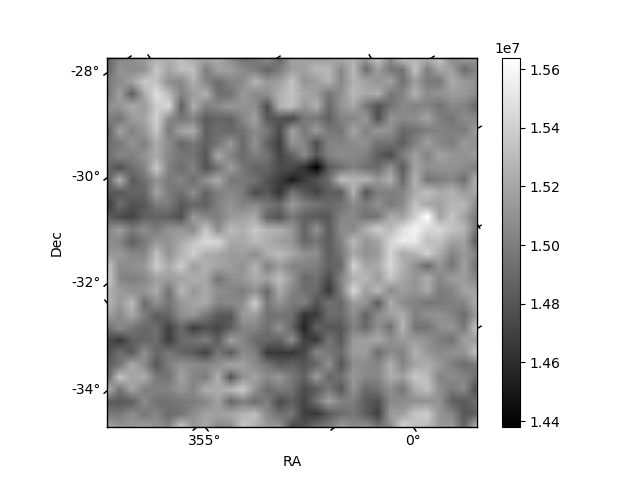
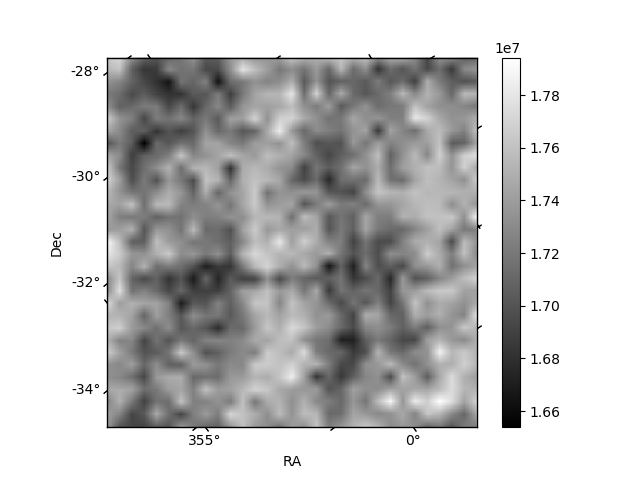
Histogram calculated using DETX and DETY for each event in the final _common_clean file
| Quadrant A | 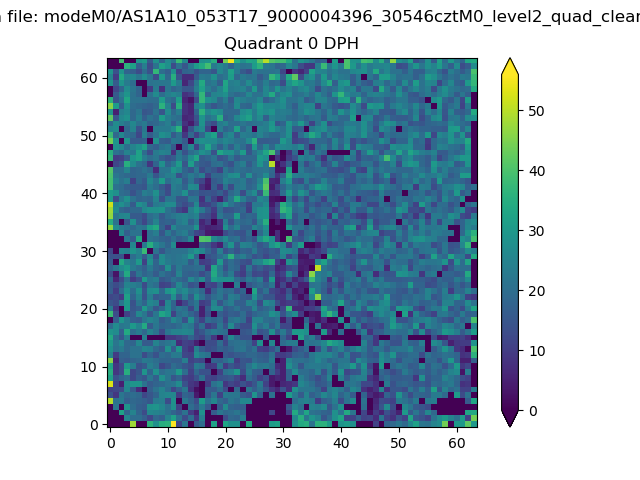 |
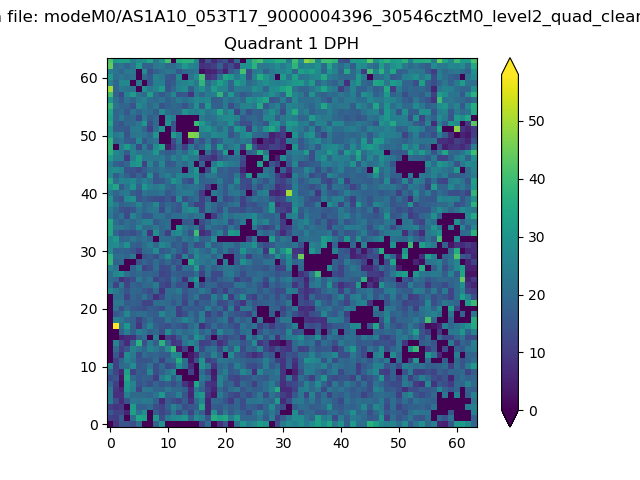 |
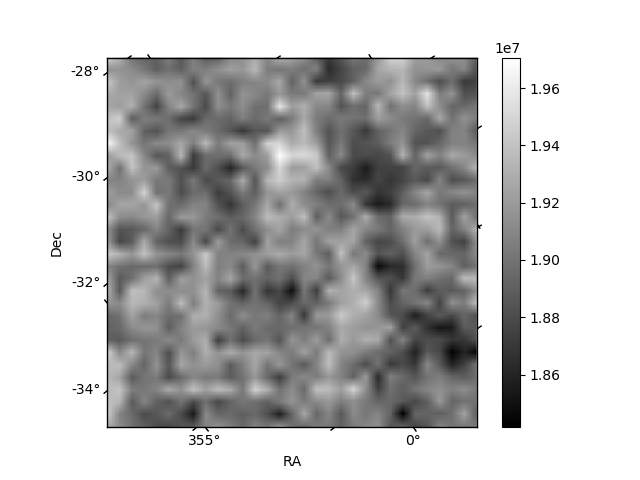
Quadrant B |
|---|---|---|---|
| Quadrant D | 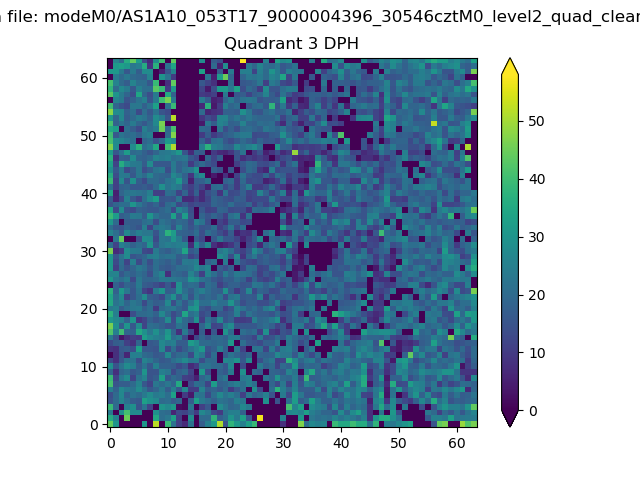 |
 |
Quadrant C |
| Plot type | Count rate plots | Images |
|---|---|---|
| Comparison with Poisson distribution Blue bars denote a histogram of data divided into 1 sec bins. Red curve is a Poisson curve with rate = median count rate of data. |
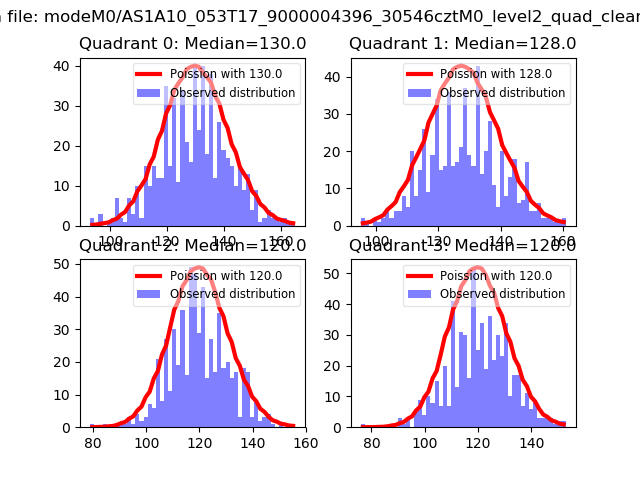 |
 |
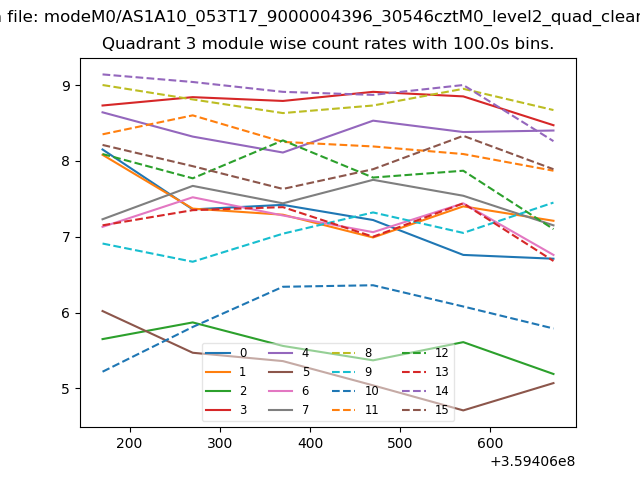
| Quadrant-wise count rates Data is divided into 100 sec bins |
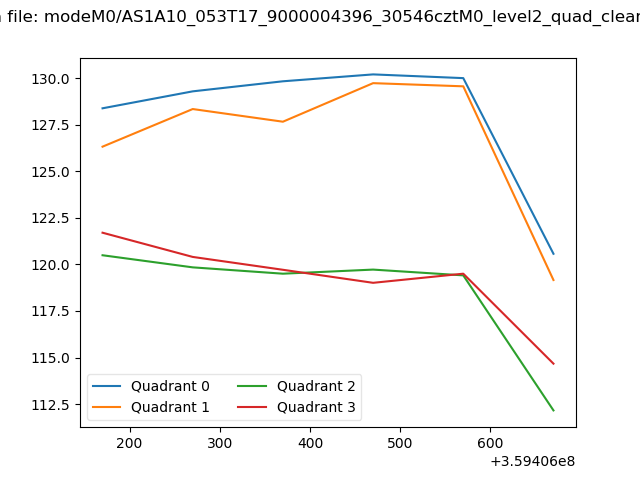 |
|
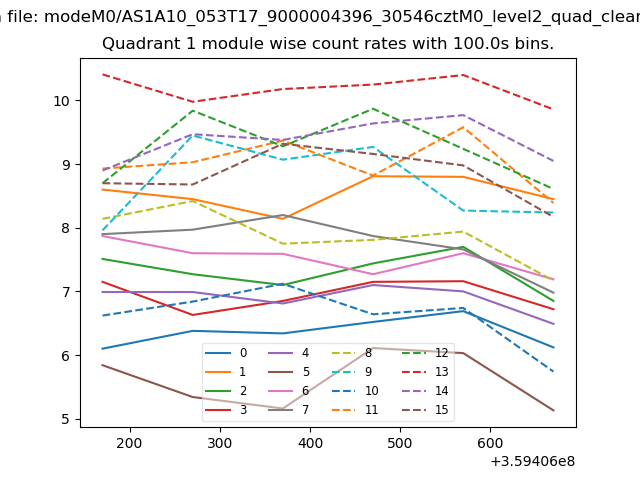
| Module-wise count rates for Quadrant A Data is divided into 100 sec bins |
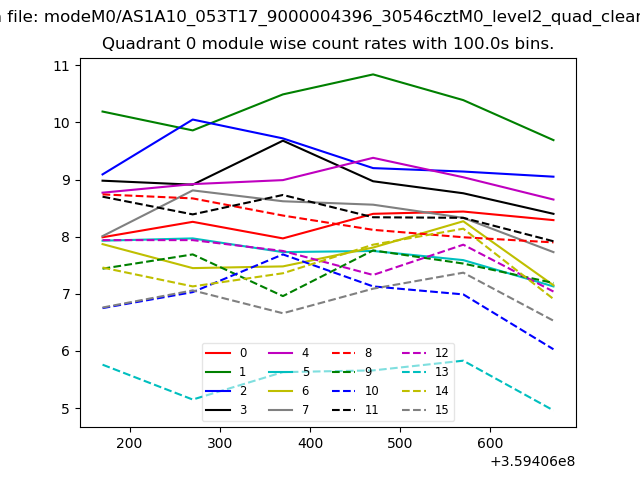 |
 |
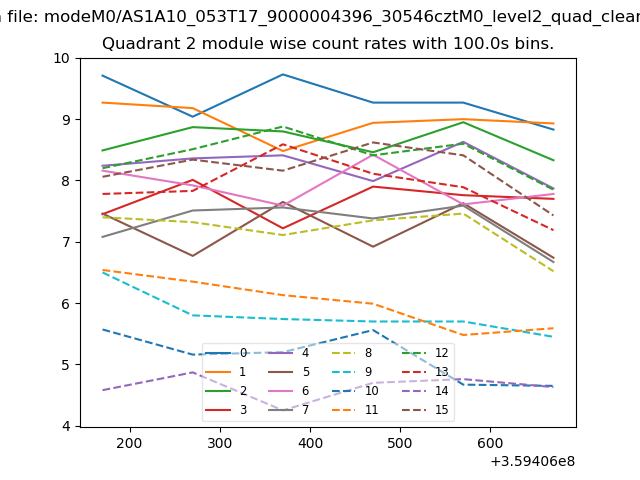
| Module-wise count rates for Quadrant B Data is divided into 100 sec bins |
 |
 |
| Module-wise count rates for Quadrant C Data is divided into 100 sec bins |
 |
 |
| Module-wise count rates for Quadrant D Data is divided into 100 sec bins |
 |
 |
| Parameter | Plot |
|---|---|
| CZT HV Monitor | 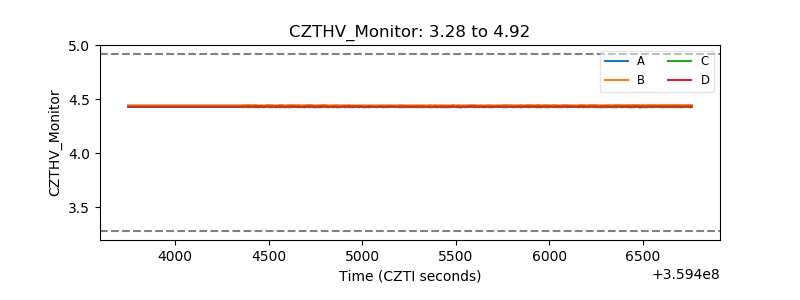 |
| D_VDD | 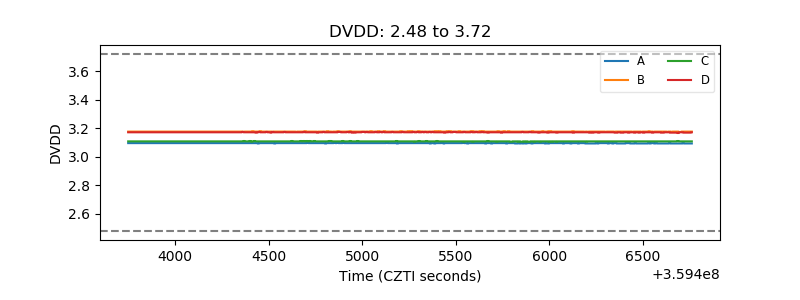 |
| Temperature 1 | 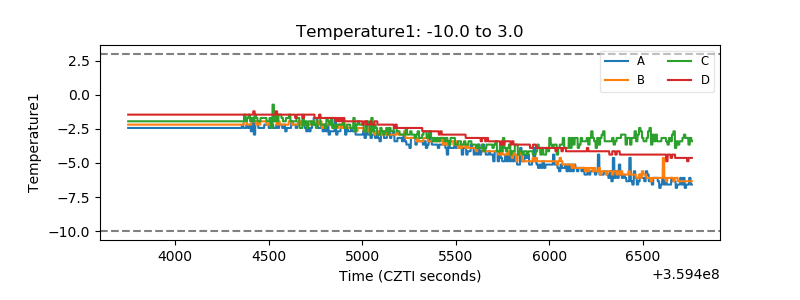 |
| Veto HV Monitor | 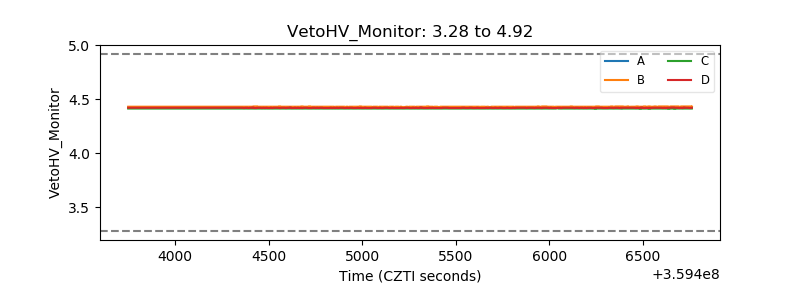 |
| Veto LLD | 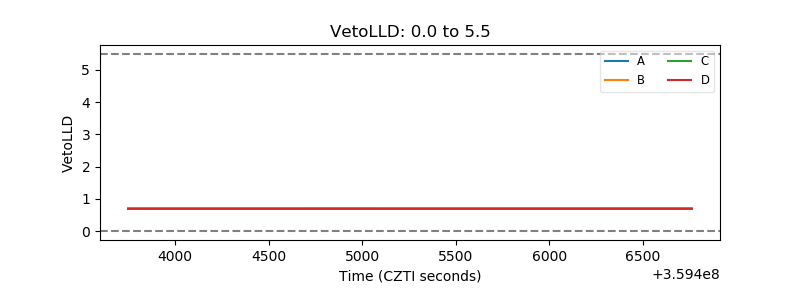 |
| Alpha Counter | 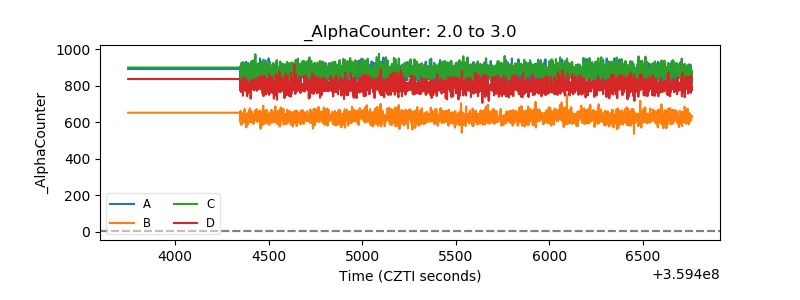 |
| _CPM_Rate | 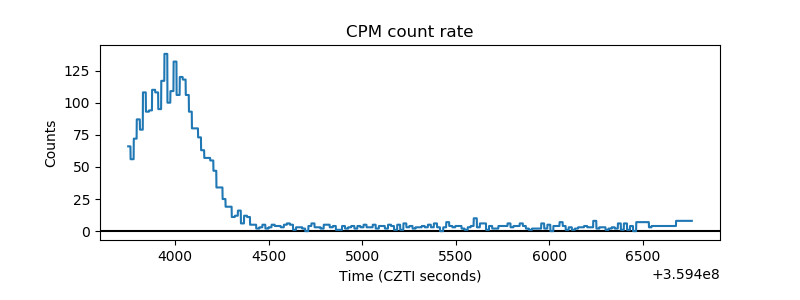 |
| CZT Counter | 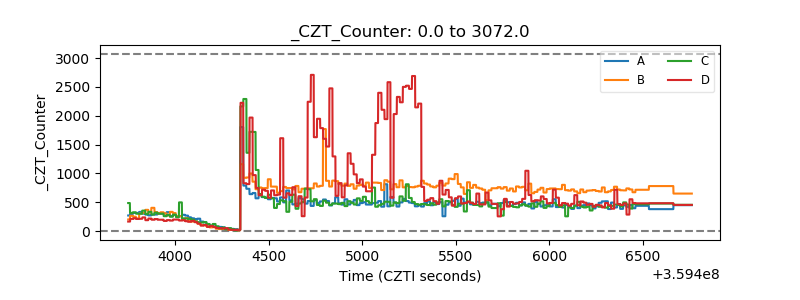 |
| +2.5 Volts monitor |  |
| +5 Volts monitor | 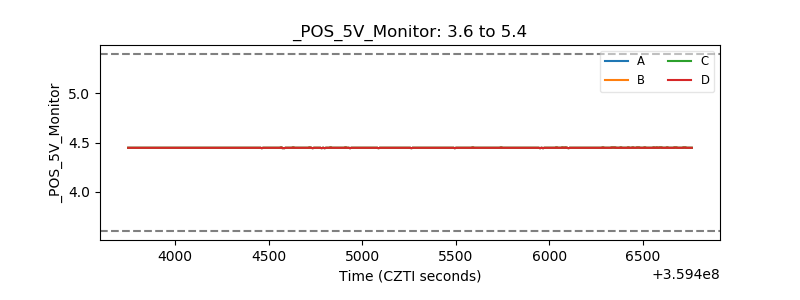 |
| _ROLL_ROT | 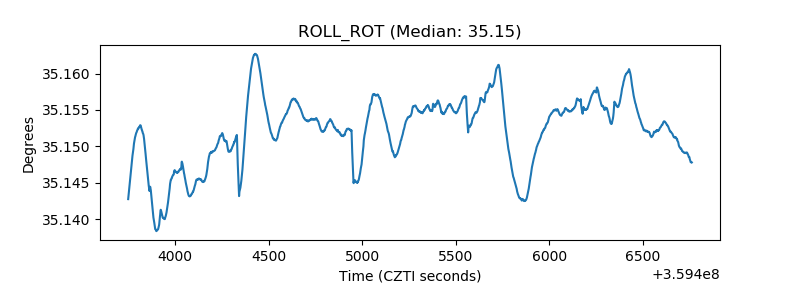 |
| _Roll_DEC | 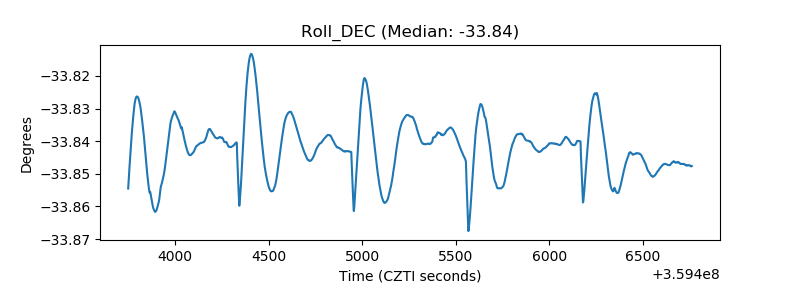 |
| _Roll_RA | 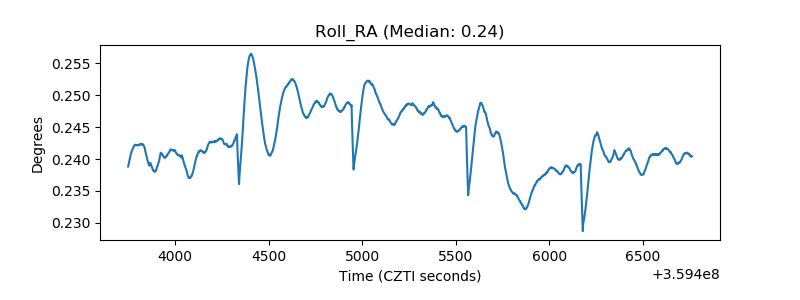 |
| Veto Counter | 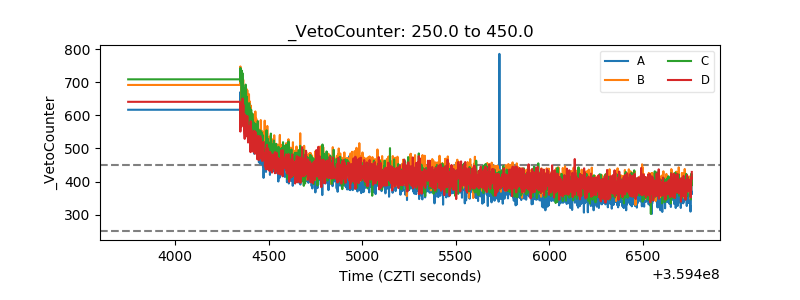 |