| Param | Original file | Final file |
|---|---|---|
| Filename | modeM0/AS1A10_053T20_9000004398cztM0_level2.fits | modeM0/AS1A10_053T20_9000004398cztM0_level2_quad_clean.evt |
| Size (bytes) | 231,612,480 | 252,028,800 |
| Size | 220.9 MB | 240.4 MB |
| Events in quadrant A | 1,443,248 | 1,593,055 |
| Events in quadrant B | 1,334,920 | 1,554,407 |
| Events in quadrant C | 1,354,570 | 1,486,957 |
| Events in quadrant D | 1,202,638 | 1,320,012 |
| Mode M0 | |||
|---|---|---|---|
| Quadrant | BADHDUFLAG | Total packets | Discarded packets |
| A | 0 | 50175 | 0 |
| B | 0 | 74932 | 0 |
| C | 0 | 54000 | 0 |
| D | 0 | 63980 | 0 |
| Mode M9 | |||
|---|---|---|---|
| Quadrant | BADHDUFLAG | Total packets | Discarded packets |
| A | 0 | 14 | 0 |
| B | 0 | 14 | 0 |
| C | 0 | 14 | 0 |
| D | 0 | 14 | 0 |
| Mode SS | |||
|---|---|---|---|
| Quadrant | BADHDUFLAG | Total packets | Discarded packets |
| A | 0 | 498 | 0 |
| B | 0 | 498 | 0 |
| C | 0 | 498 | 0 |
| D | 0 | 498 | 0 |
| Quadrant | Total seconds | Saturated seconds | Saturation percentage |
|---|---|---|---|
| A | 24392 | 242 | 0.992129% |
| B | 24392 | 632 | 2.591013% |
| C | 24392 | 952 | 3.902919% |
| D | 24392 | 1457 | 5.973270% |
Noise dominated data is calculated using 1-second bins in cleaned event files. If a bin has >2000 counts, and if more than 50% of those come from <1% of pixels, then it is considered to be noise-dominated and hence unusable.
| Quadrant | # 1 sec bins | Bins with >0 counts | Bins with >2000 counts | High rate bins dominated by noise | Noise dominated (total time) | Noise dominated (detector-on time) | Marked lightcurve |
|---|---|---|---|---|---|---|---|
| A | 25822 | 24392 | 0 | 0 | 0.00% | 0.00% | 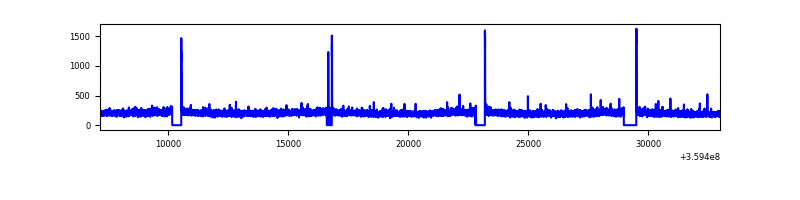 |
| B | 25822 | 24388 | 0 | 0 | 0.00% | 0.00% | 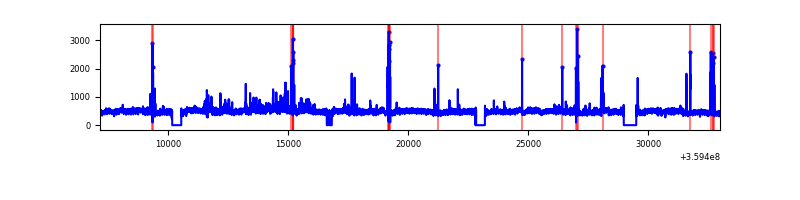 |
| C | 25822 | 24373 | 0 | 0 | 0.00% | 0.00% |  |
| D | 25822 | 24387 | 0 | 0 | 0.00% | 0.00% |  |
Top three noisy pixels from each quadrant. If the there are fewer than three noisy pixels in the level2.evt file, extra rows are filled as -1
| Pixel properties | Quadrant properties | ||||||
|---|---|---|---|---|---|---|---|
| Quadrant | DetID | PixID | Counts | Sigma | Mean | Median | Sigma |
| A | 0 | 29 | 1353 | 10.57 | 376 | 352 | 94.7 |
| A | 7 | 110 | 1113 | 8.04 | 376 | 352 | 94.7 |
| A | 9 | 19 | 1058 | 7.46 | 376 | 352 | 94.7 |
| B | 2 | 9 | 1117 | 10.67 | 352 | 335 | 73.3 |
| B | 14 | 254 | 915 | 7.91 | 352 | 335 | 73.3 |
| B | 2 | 8 | 904 | 7.76 | 352 | 335 | 73.3 |
| C | 1 | 80 | 1044 | 7.77 | 357 | 334 | 91.4 |
| C | 1 | 81 | 1042 | 7.75 | 357 | 334 | 91.4 |
| C | 3 | 187 | 990 | 7.18 | 357 | 334 | 91.4 |
| D | 15 | 46 | 931 | 6.65 | 342 | 311 | 93.3 |
| D | 3 | 14 | 875 | 6.05 | 342 | 311 | 93.3 |
| D | 4 | 160 | 841 | 5.68 | 342 | 311 | 93.3 |
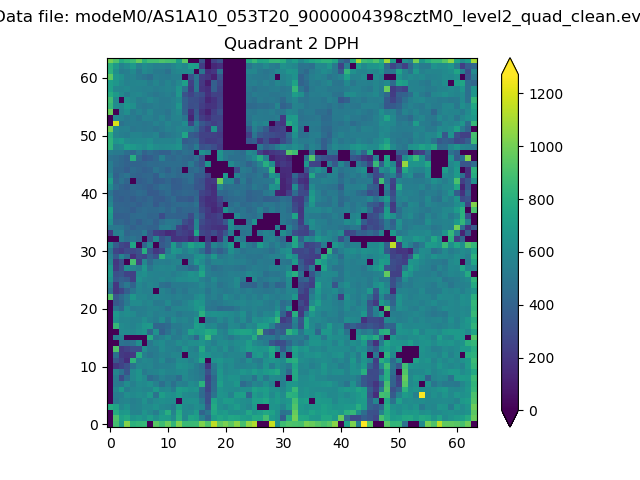
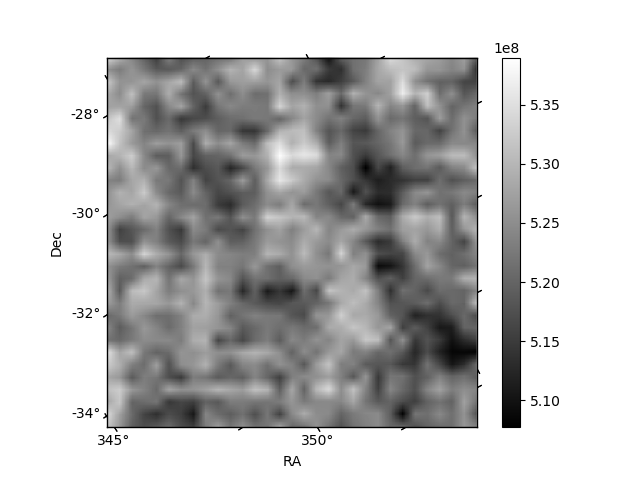
Histogram calculated using DETX and DETY for each event in the final _common_clean file
| Quadrant A |  |
 |
Quadrant B |
|---|---|---|---|
| Quadrant D |  |
 |
Quadrant C |
| Plot type | Count rate plots | Images |
|---|---|---|
| Comparison with Poisson distribution Blue bars denote a histogram of data divided into 1 sec bins. Red curve is a Poisson curve with rate = median count rate of data. |
 |
 |
| Quadrant-wise count rates Data is divided into 100 sec bins |
 |
|
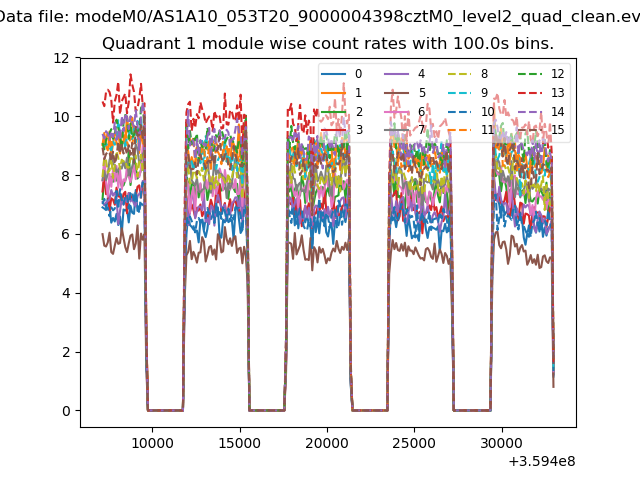
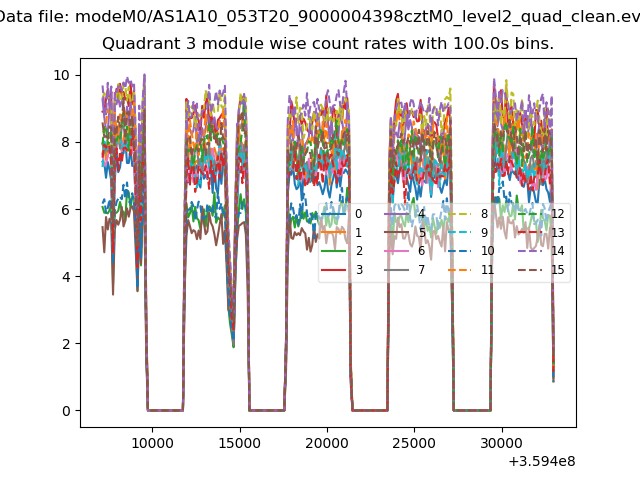
| Module-wise count rates for Quadrant A Data is divided into 100 sec bins |
 |
 |
| Module-wise count rates for Quadrant B Data is divided into 100 sec bins |
 |
 |
| Module-wise count rates for Quadrant C Data is divided into 100 sec bins |
 |
 |
| Module-wise count rates for Quadrant D Data is divided into 100 sec bins |
 |
 |
| Parameter | Plot |
|---|---|
| CZT HV Monitor | 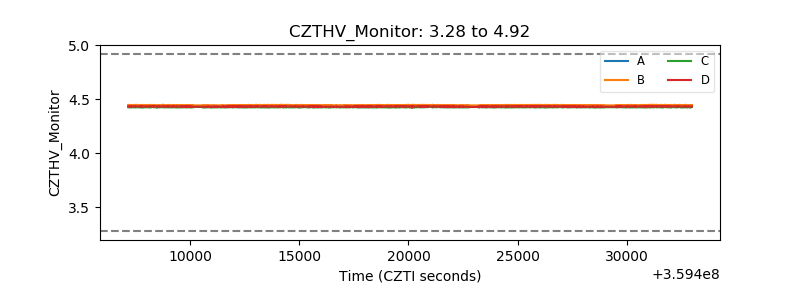 |
| D_VDD | 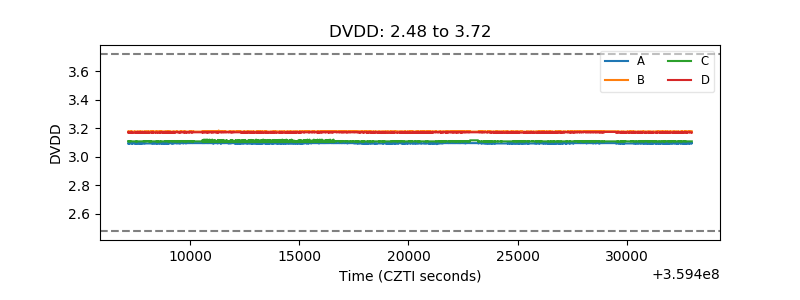 |
| Temperature 1 | 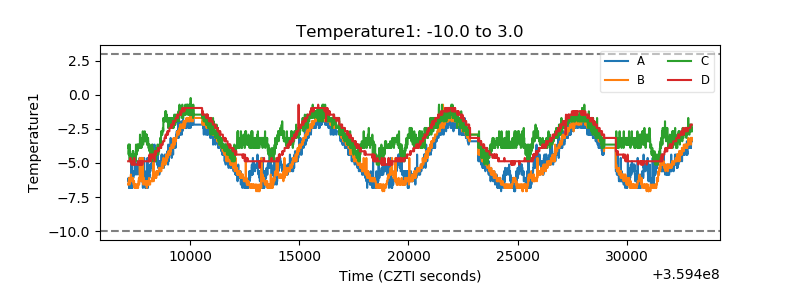 |
| Veto HV Monitor |  |
| Veto LLD | 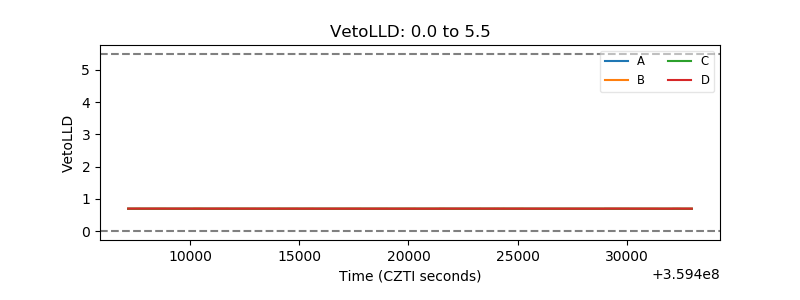 |
| Alpha Counter | 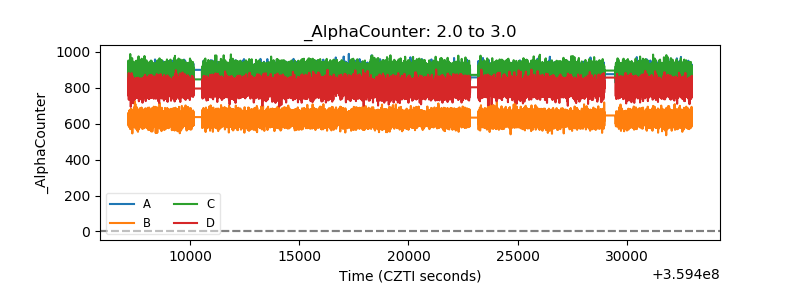 |
| _CPM_Rate | 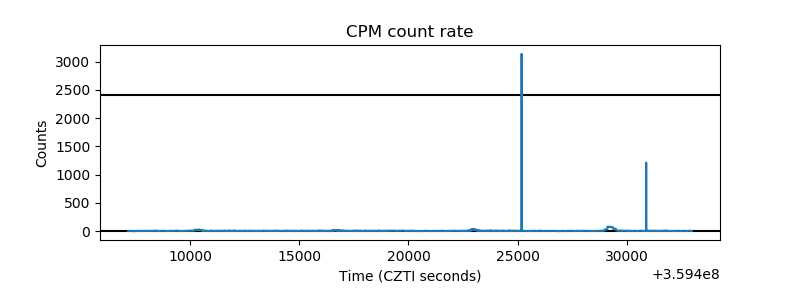 |
| CZT Counter |  |
| +2.5 Volts monitor |  |
| +5 Volts monitor |  |
| _ROLL_ROT | 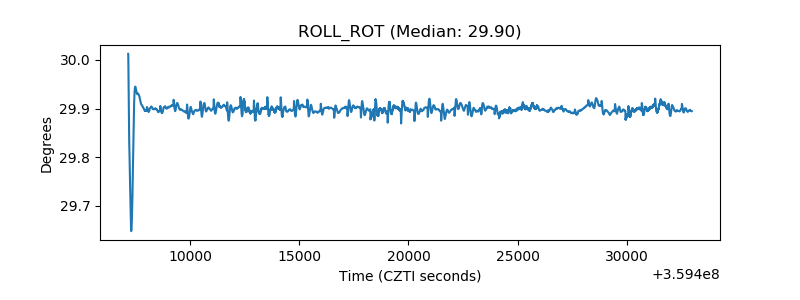 |
| _Roll_DEC | 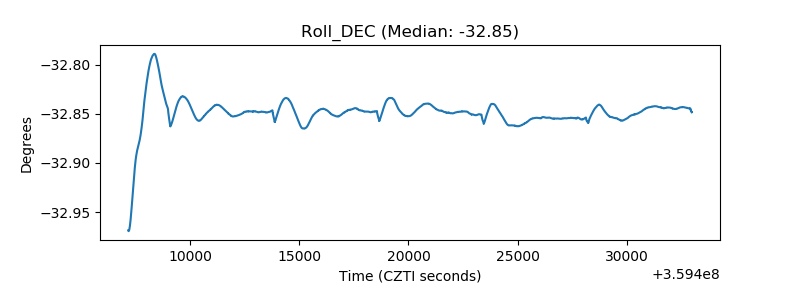 |
| _Roll_RA |  |
| Veto Counter |  |