| Param | Original file | Final file |
|---|---|---|
| Filename | modeM0/AS1A10_053T20_9000004398_30546cztM0_level2.evt | modeM0/AS1A10_053T20_9000004398_30546cztM0_level2_quad_clean.evt |
| Size (bytes) | 401,140,800 | 56,327,040 |
| Size | 382.6 MB | 53.7 MB |
| Events in quadrant A | 2,246,339 | 361,093 |
| Events in quadrant B | 3,606,677 | 357,538 |
| Events in quadrant C | 2,353,029 | 343,968 |
| Events in quadrant D | 3,635,374 | 325,075 |
| Mode M0 | |||
|---|---|---|---|
| Quadrant | BADHDUFLAG | Total packets | Discarded packets |
| A | 0 | 9422 | 1 |
| B | 0 | 13839 | 1 |
| C | 0 | 9664 | 1 |
| D | 0 | 13593 | 1 |
| Mode M9 | |||
|---|---|---|---|
| Quadrant | BADHDUFLAG | Total packets | Discarded packets |
| A | 0 | 3 | 0 |
| B | 0 | 3 | 0 |
| C | 0 | 3 | 0 |
| D | 0 | 3 | 0 |
| Mode SS | |||
|---|---|---|---|
| Quadrant | BADHDUFLAG | Total packets | Discarded packets |
| A | 0 | 94 | 0 |
| B | 0 | 94 | 0 |
| C | 0 | 94 | 0 |
| D | 0 | 94 | 0 |
| Quadrant | Total seconds | Saturated seconds | Saturation percentage |
|---|---|---|---|
| A | 4511 | 66 | 1.463090% |
| B | 4511 | 140 | 3.103525% |
| C | 4511 | 148 | 3.280869% |
| D | 4511 | 490 | 10.862337% |
Noise dominated data is calculated using 1-second bins in cleaned event files. If a bin has >2000 counts, and if more than 50% of those come from <1% of pixels, then it is considered to be noise-dominated and hence unusable.
| Quadrant | # 1 sec bins | Bins with >0 counts | Bins with >2000 counts | High rate bins dominated by noise | Noise dominated (total time) | Noise dominated (detector-on time) | Marked lightcurve |
|---|---|---|---|---|---|---|---|
| A | 4891 | 4512 | 0 | 0 | 0.00% | 0.00% | 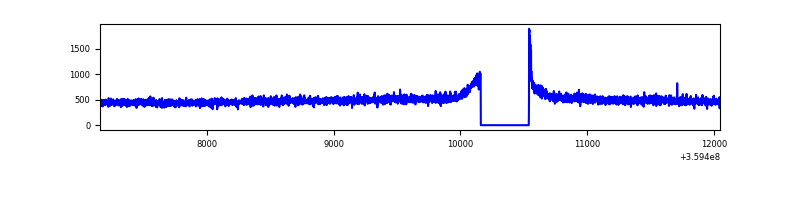 |
| B | 4891 | 4512 | 6 | 6 | 0.12% | 0.13% | 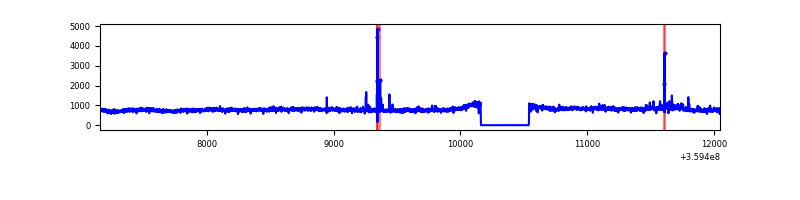 |
| C | 4891 | 4512 | 18 | 18 | 0.37% | 0.40% | 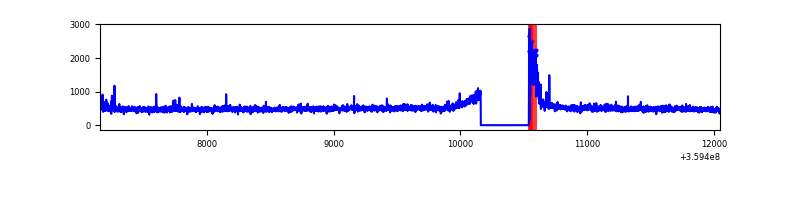 |
| D | 4891 | 4512 | 341 | 341 | 6.97% | 7.56% | 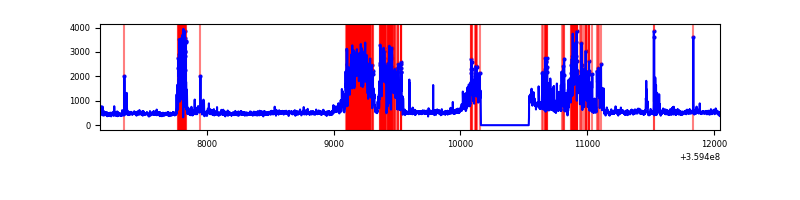 |
Top three noisy pixels from each quadrant. If the there are fewer than three noisy pixels in the level2.evt file, extra rows are filled as -1
| Pixel properties | Quadrant properties | ||||||
|---|---|---|---|---|---|---|---|
| Quadrant | DetID | PixID | Counts | Sigma | Mean | Median | Sigma |
| A | 8 | 192 | 18086 | 150.01 | 577 | 565 | 116.8 |
| A | 13 | 254 | 8268 | 65.95 | 577 | 565 | 116.8 |
| A | 3 | 137 | 5775 | 44.61 | 577 | 565 | 116.8 |
| B | 6 | 159 | 1287560 | 11726.98 | 565 | 551 | 109.7 |
| B | 6 | 36 | 41139 | 369.83 | 565 | 551 | 109.7 |
| B | 4 | 171 | 24411 | 217.41 | 565 | 551 | 109.7 |
| C | 0 | 10 | 105109 | 818.46 | 542 | 545 | 127.8 |
| C | 14 | 238 | 92606 | 720.6 | 542 | 545 | 127.8 |
| C | 3 | 233 | 21107 | 160.95 | 542 | 545 | 127.8 |
| D | 7 | 238 | 728323 | 5626.3 | 538 | 524 | 129.4 |
| D | 2 | 250 | 405474 | 3130.49 | 538 | 524 | 129.4 |
| D | 8 | 195 | 222033 | 1712.39 | 538 | 524 | 129.4 |
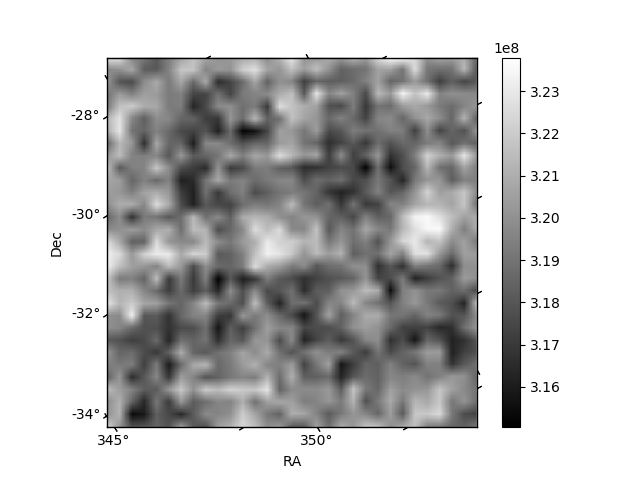
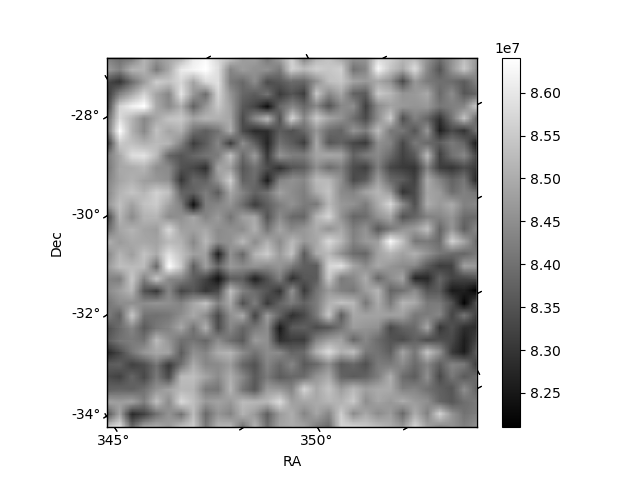
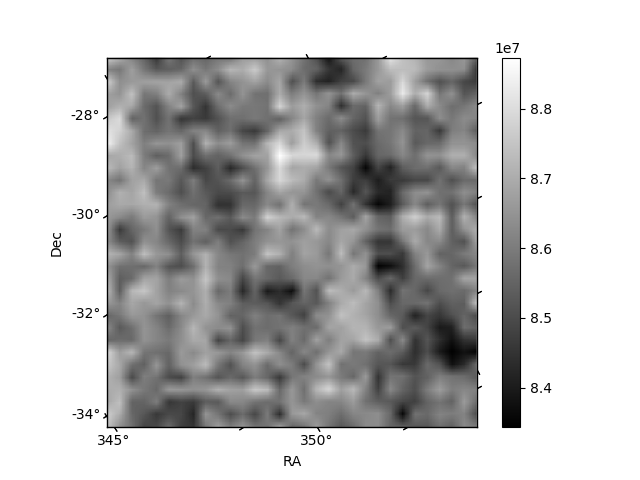
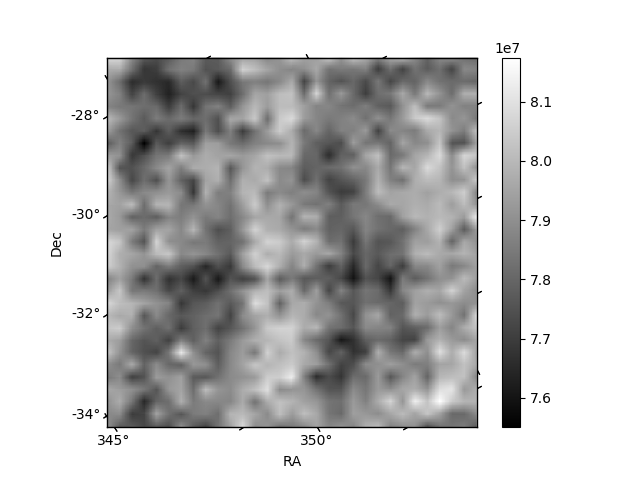
Histogram calculated using DETX and DETY for each event in the final _common_clean file
| Quadrant A | 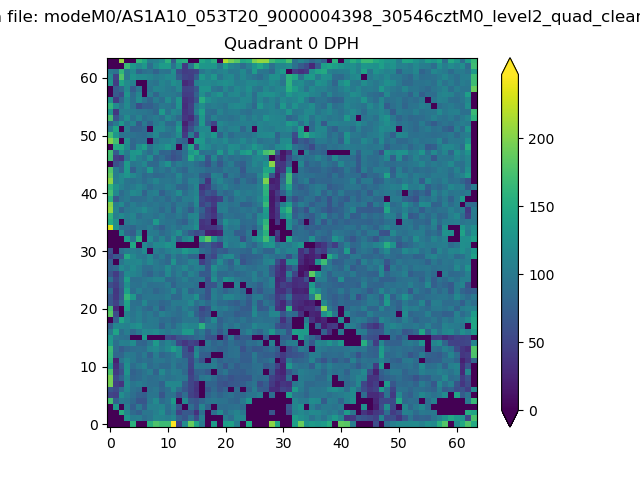 |
 |
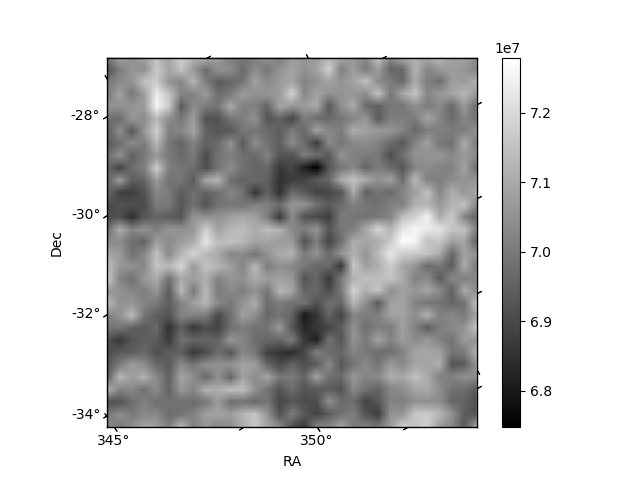
Quadrant B |
|---|---|---|---|
| Quadrant D | 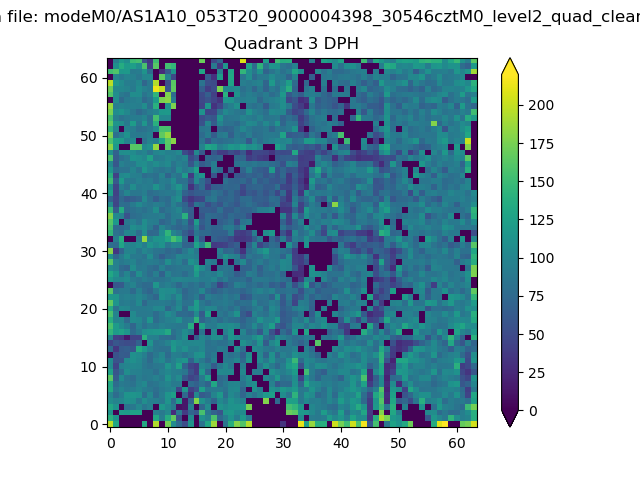 |
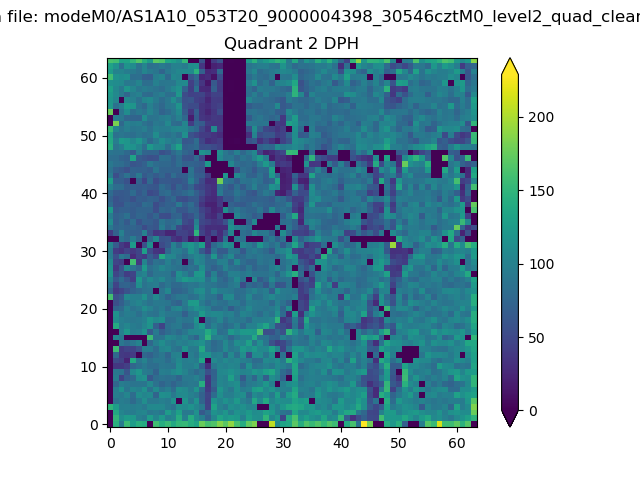 |
Quadrant C |
| Plot type | Count rate plots | Images |
|---|---|---|
| Comparison with Poisson distribution Blue bars denote a histogram of data divided into 1 sec bins. Red curve is a Poisson curve with rate = median count rate of data. |
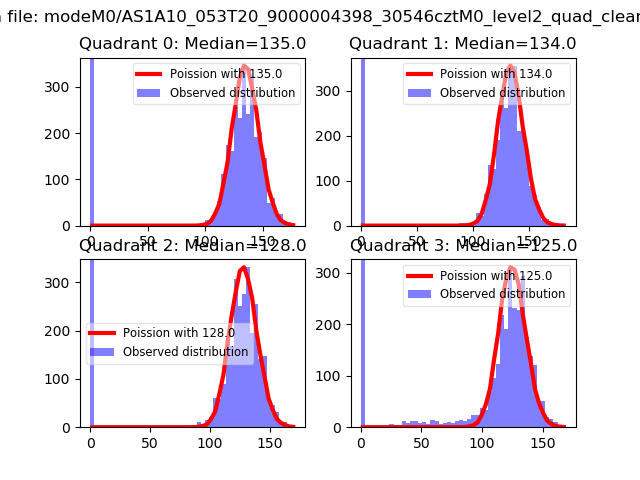 |
 |
| Quadrant-wise count rates Data is divided into 100 sec bins |
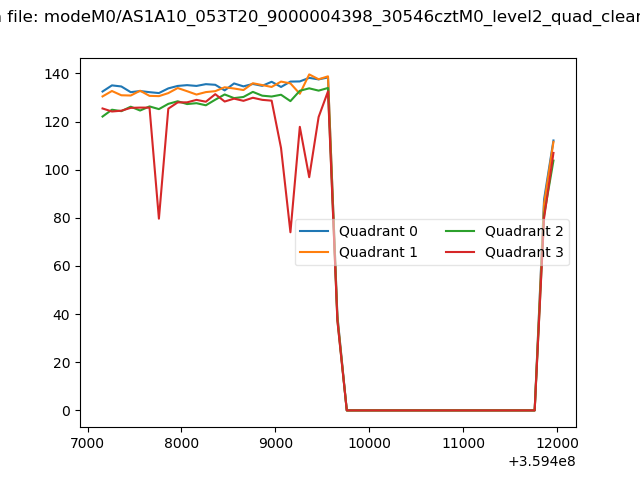 |
|
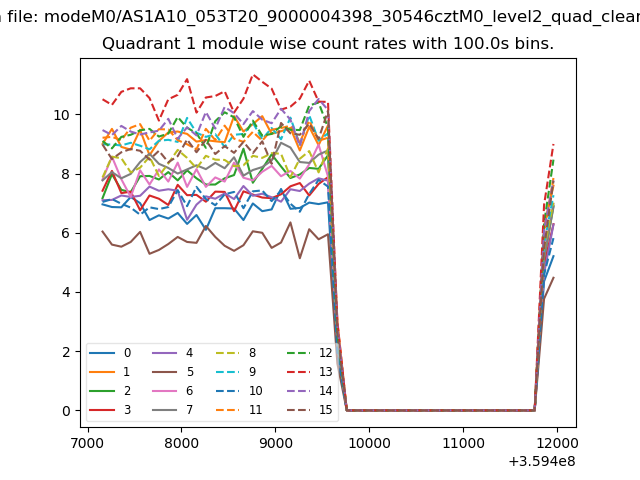
| Module-wise count rates for Quadrant A Data is divided into 100 sec bins |
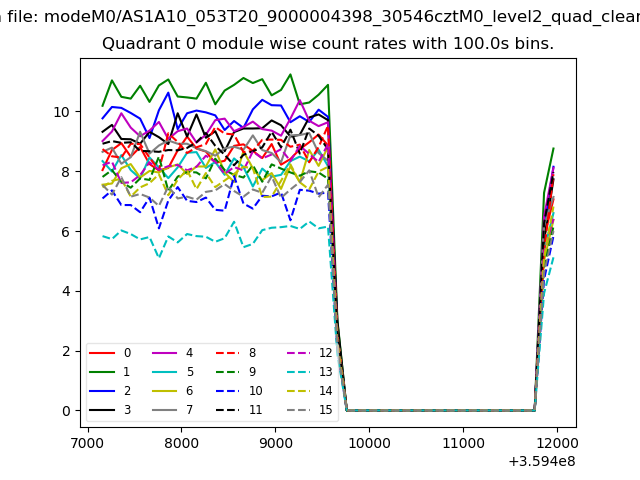 |
 |
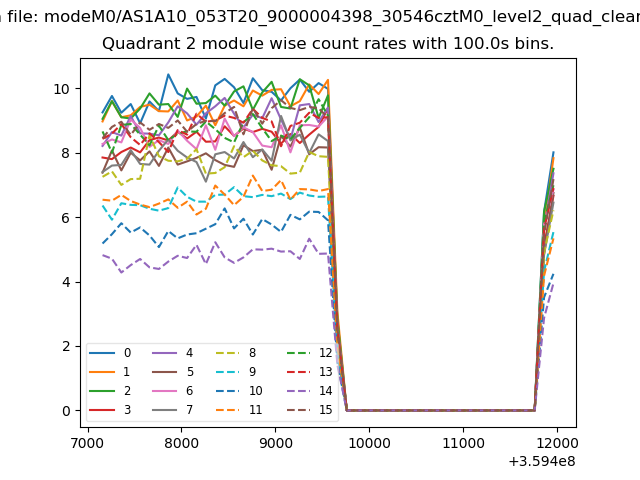
| Module-wise count rates for Quadrant B Data is divided into 100 sec bins |
 |
 |
| Module-wise count rates for Quadrant C Data is divided into 100 sec bins |
 |
 |
| Module-wise count rates for Quadrant D Data is divided into 100 sec bins |
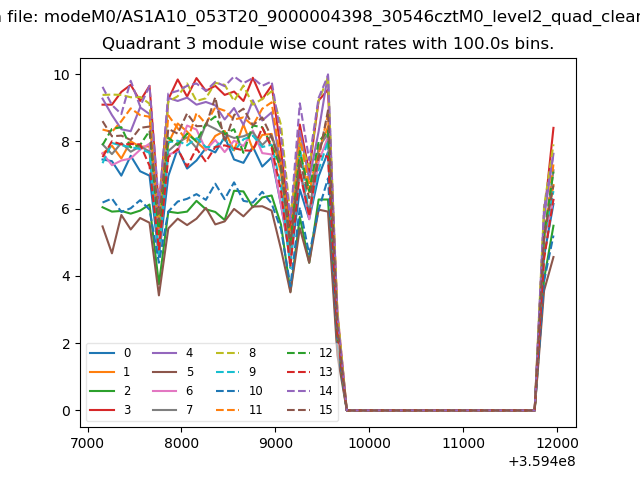 |
 |
| Parameter | Plot |
|---|---|
| CZT HV Monitor | 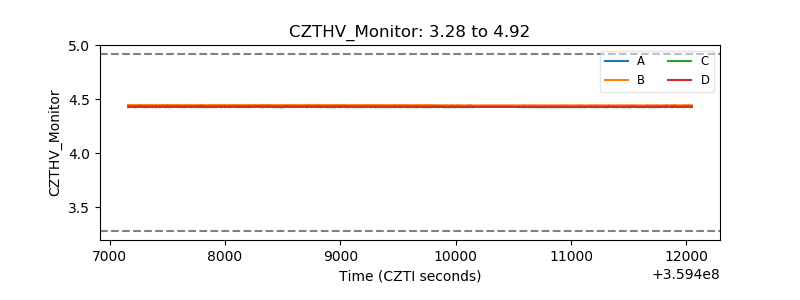 |
| D_VDD | 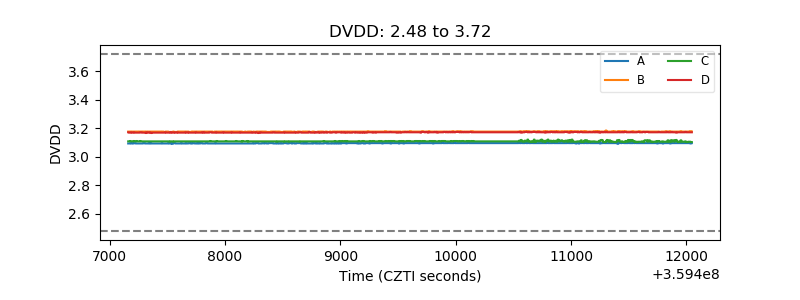 |
| Temperature 1 | 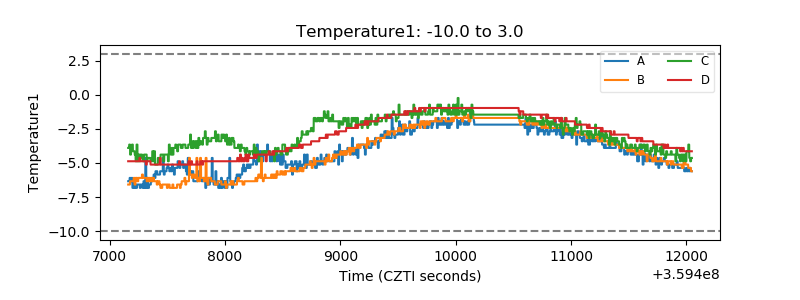 |
| Veto HV Monitor | 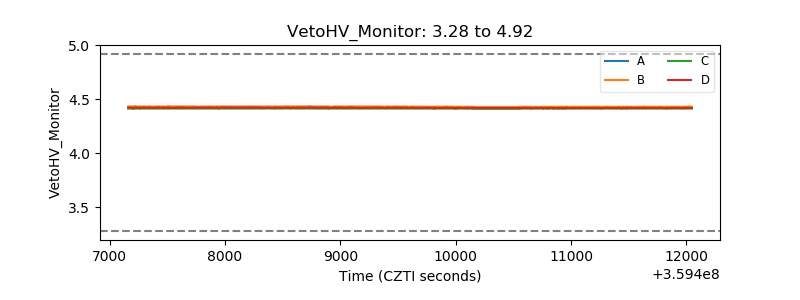 |
| Veto LLD | 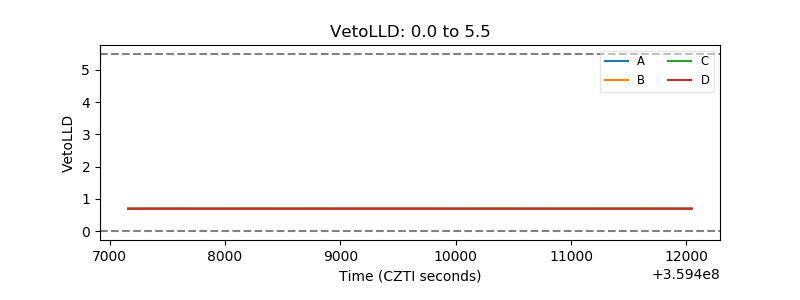 |
| Alpha Counter | 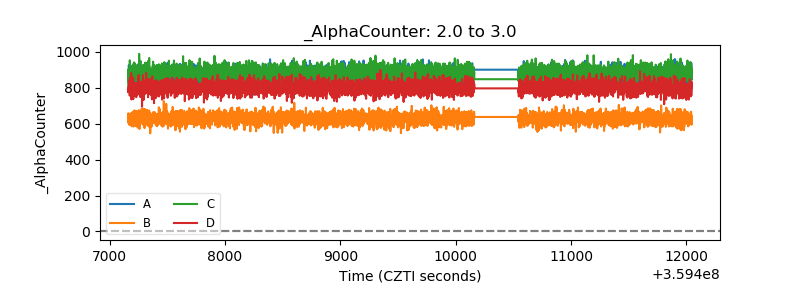 |
| _CPM_Rate | 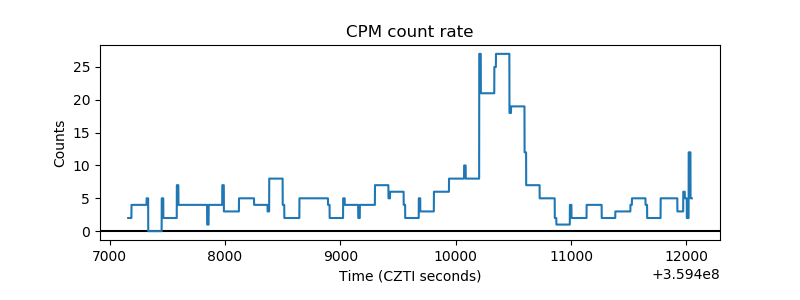 |
| CZT Counter | 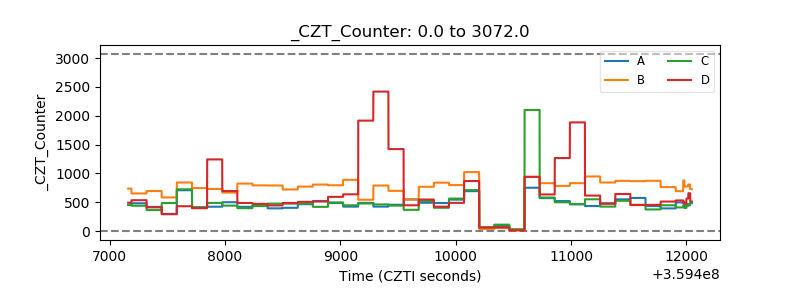 |
| +2.5 Volts monitor |  |
| +5 Volts monitor | 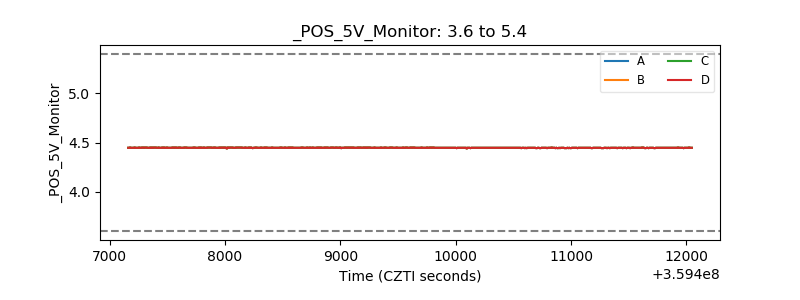 |
| _ROLL_ROT | 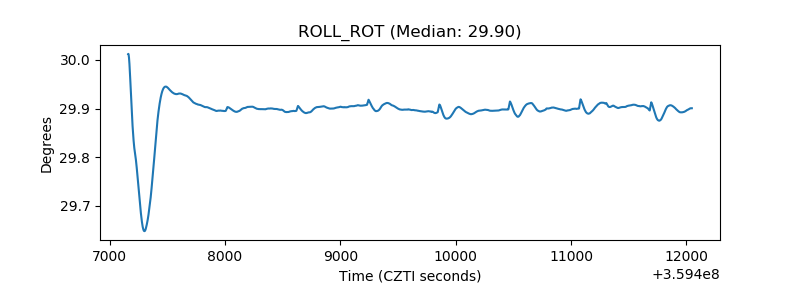 |
| _Roll_DEC | 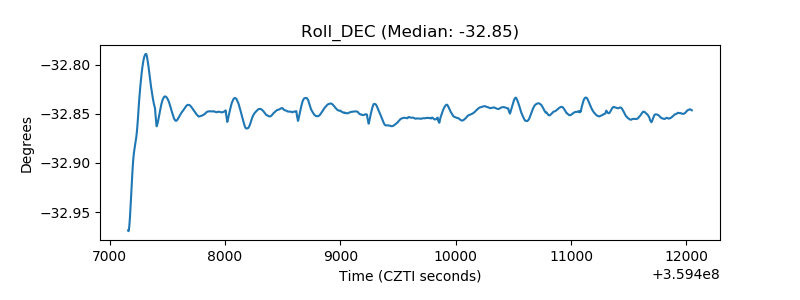 |
| _Roll_RA | 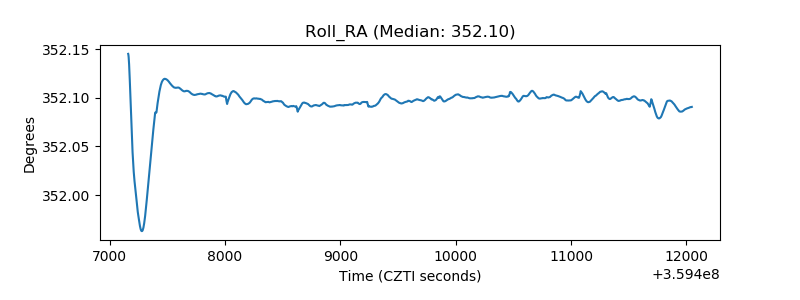 |
| Veto Counter | 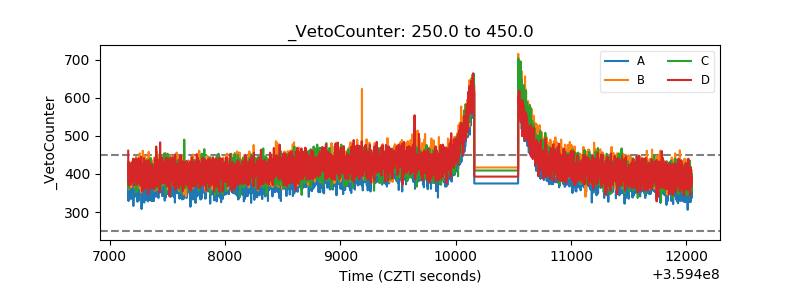 |