| Param | Original file | Final file |
|---|---|---|
| Filename | modeM0/AS1A10_053T20_9000004398_30548cztM0_level2.evt | modeM0/AS1A10_053T20_9000004398_30548cztM0_level2_quad_clean.evt |
| Size (bytes) | 630,227,520 | 96,707,520 |
| Size | 601.0 MB | 92.2 MB |
| Events in quadrant A | 3,526,514 | 622,298 |
| Events in quadrant B | 5,816,906 | 612,853 |
| Events in quadrant C | 4,486,483 | 592,817 |
| Events in quadrant D | 4,751,420 | 581,455 |
| Mode M0 | |||
|---|---|---|---|
| Quadrant | BADHDUFLAG | Total packets | Discarded packets |
| A | 0 | 15218 | 1 |
| B | 0 | 22686 | 1 |
| C | 0 | 17969 | 1 |
| D | 0 | 18958 | 1 |
| Mode M9 | |||
|---|---|---|---|
| Quadrant | BADHDUFLAG | Total packets | Discarded packets |
| A | 0 | 4 | 0 |
| B | 0 | 4 | 0 |
| C | 0 | 4 | 0 |
| D | 0 | 4 | 0 |
| Mode SS | |||
|---|---|---|---|
| Quadrant | BADHDUFLAG | Total packets | Discarded packets |
| A | 0 | 150 | 0 |
| B | 0 | 150 | 0 |
| C | 0 | 150 | 0 |
| D | 0 | 150 | 0 |
| Quadrant | Total seconds | Saturated seconds | Saturation percentage |
|---|---|---|---|
| A | 7466 | 37 | 0.495580% |
| B | 7466 | 129 | 1.727833% |
| C | 7467 | 477 | 6.388108% |
| D | 7467 | 246 | 3.294496% |
Noise dominated data is calculated using 1-second bins in cleaned event files. If a bin has >2000 counts, and if more than 50% of those come from <1% of pixels, then it is considered to be noise-dominated and hence unusable.
| Quadrant | # 1 sec bins | Bins with >0 counts | Bins with >2000 counts | High rate bins dominated by noise | Noise dominated (total time) | Noise dominated (detector-on time) | Marked lightcurve |
|---|---|---|---|---|---|---|---|
| A | 7846 | 7468 | 1 | 1 | 0.01% | 0.01% | 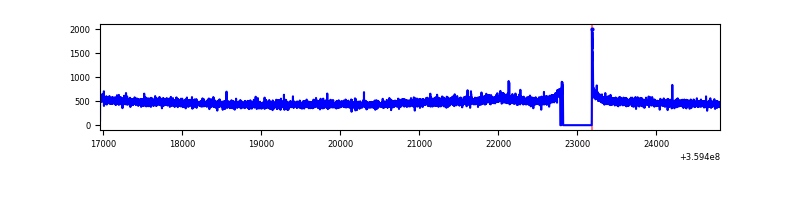 |
| B | 7846 | 7468 | 23 | 23 | 0.29% | 0.31% | 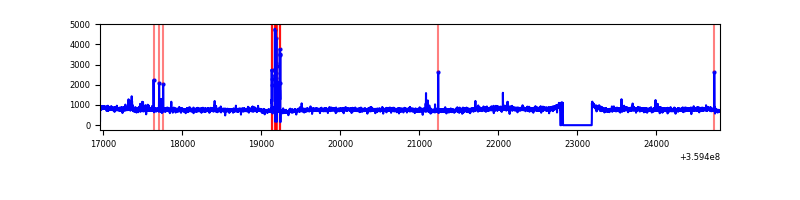 |
| C | 7847 | 7469 | 307 | 307 | 3.91% | 4.11% | 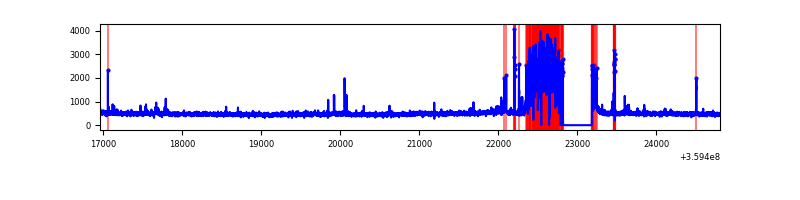 |
| D | 7847 | 7468 | 156 | 156 | 1.99% | 2.09% | 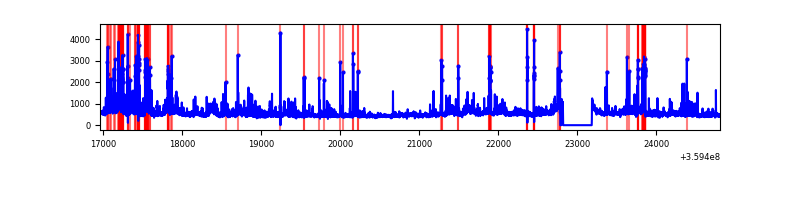 |
Top three noisy pixels from each quadrant. If the there are fewer than three noisy pixels in the level2.evt file, extra rows are filled as -1
| Pixel properties | Quadrant properties | ||||||
|---|---|---|---|---|---|---|---|
| Quadrant | DetID | PixID | Counts | Sigma | Mean | Median | Sigma |
| A | 8 | 192 | 17608 | 91.29 | 909 | 890 | 183.1 |
| A | 13 | 254 | 13346 | 68.02 | 909 | 890 | 183.1 |
| A | 3 | 137 | 9293 | 45.89 | 909 | 890 | 183.1 |
| B | 6 | 159 | 2162075 | 12364.37 | 897 | 875 | 174.8 |
| B | 4 | 171 | 71150 | 402.05 | 897 | 875 | 174.8 |
| B | 6 | 36 | 22727 | 125.02 | 897 | 875 | 174.8 |
| C | 10 | 22 | 938472 | 4786.68 | 834 | 838 | 195.9 |
| C | 14 | 238 | 134714 | 683.44 | 834 | 838 | 195.9 |
| C | 0 | 10 | 84576 | 427.49 | 834 | 838 | 195.9 |
| D | 1 | 52 | 1020431 | 4897.15 | 870 | 847 | 208.2 |
| D | 8 | 195 | 204009 | 975.8 | 870 | 847 | 208.2 |
| D | 13 | 104 | 109351 | 521.15 | 870 | 847 | 208.2 |
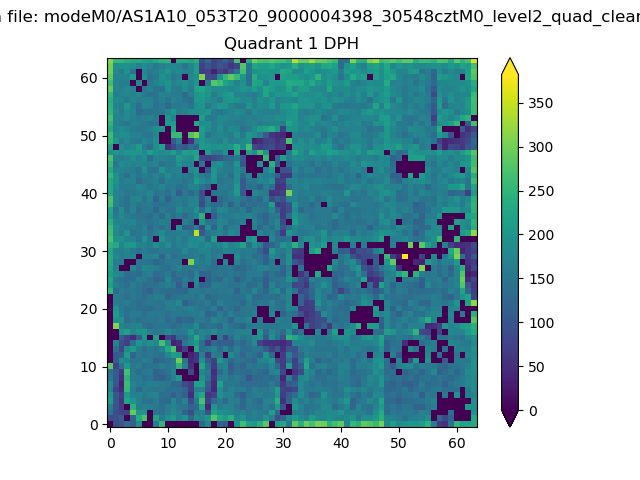
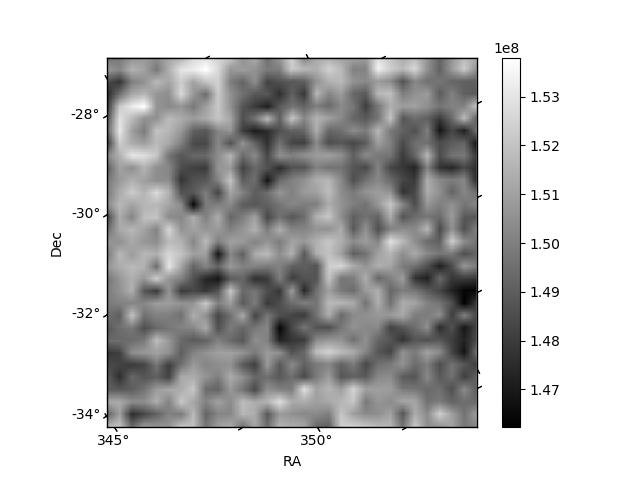
Histogram calculated using DETX and DETY for each event in the final _common_clean file
| Quadrant A |  |
 |
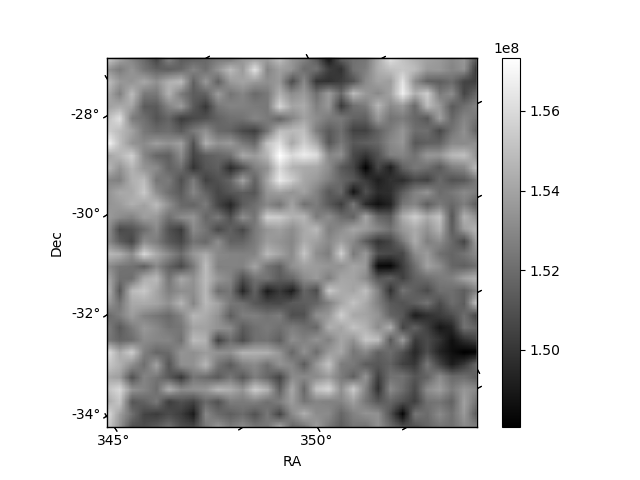
Quadrant B |
|---|---|---|---|
| Quadrant D |  |
 |
Quadrant C |
| Plot type | Count rate plots | Images |
|---|---|---|
| Comparison with Poisson distribution Blue bars denote a histogram of data divided into 1 sec bins. Red curve is a Poisson curve with rate = median count rate of data. |
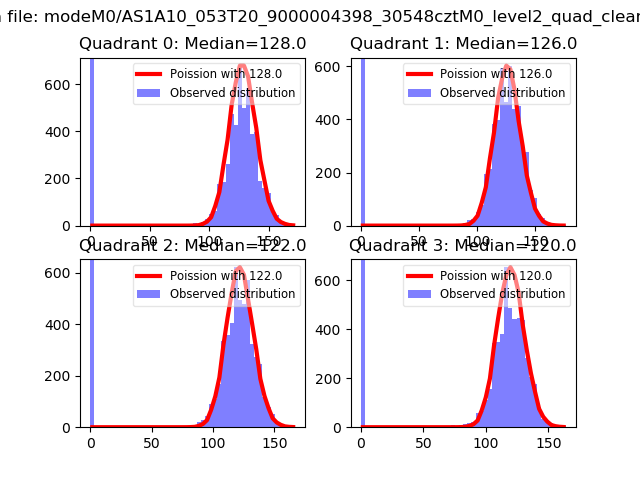 |
 |
| Quadrant-wise count rates Data is divided into 100 sec bins |
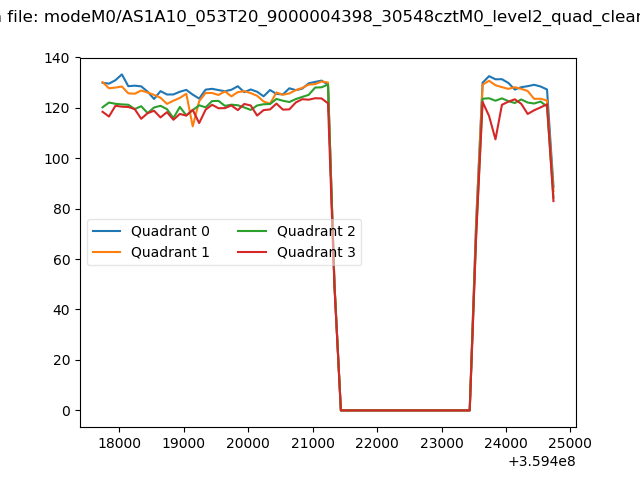 |
|
| Module-wise count rates for Quadrant A Data is divided into 100 sec bins |
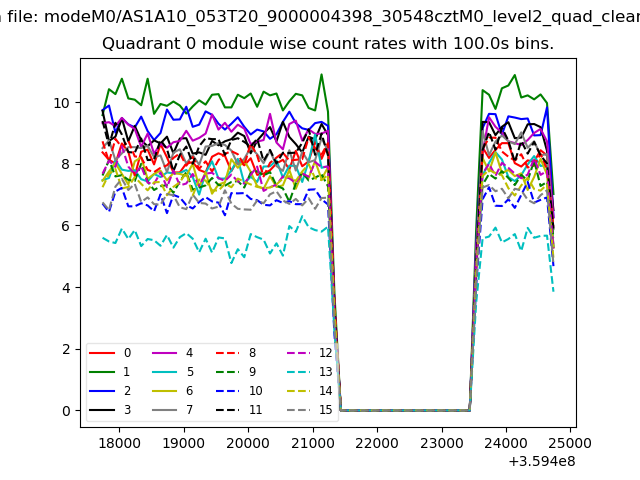 |
 |
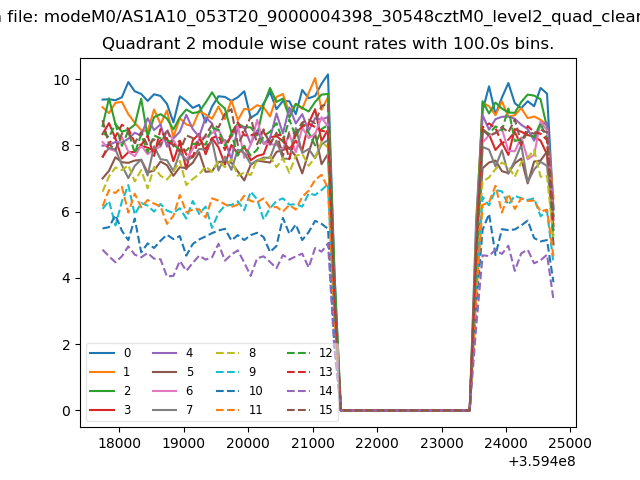
| Module-wise count rates for Quadrant B Data is divided into 100 sec bins |
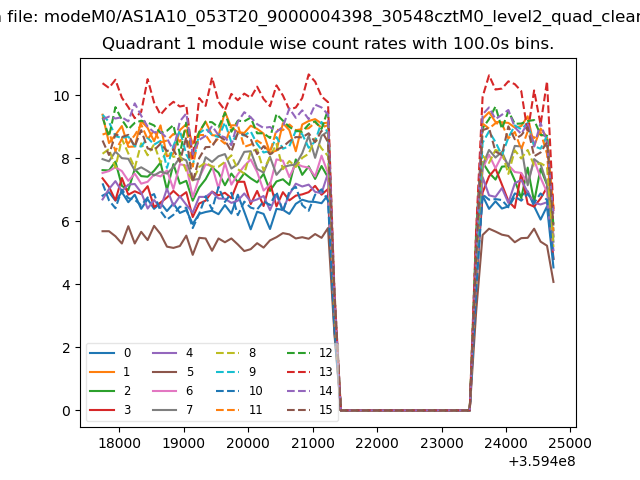 |
 |
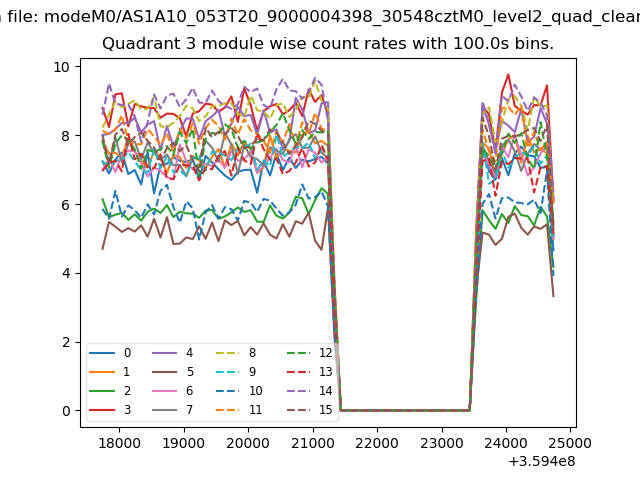
| Module-wise count rates for Quadrant C Data is divided into 100 sec bins |
 |
 |
| Module-wise count rates for Quadrant D Data is divided into 100 sec bins |
 |
 |
| Parameter | Plot |
|---|---|
| CZT HV Monitor | 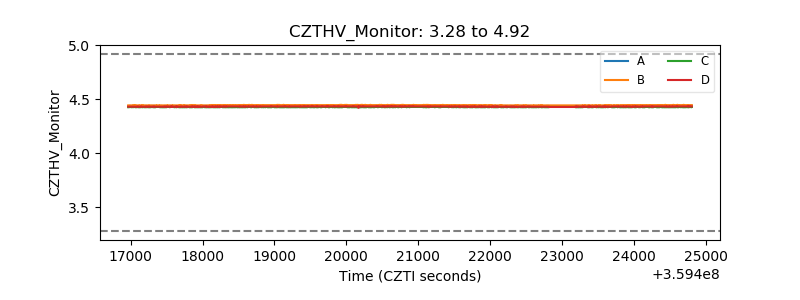 |
| D_VDD | 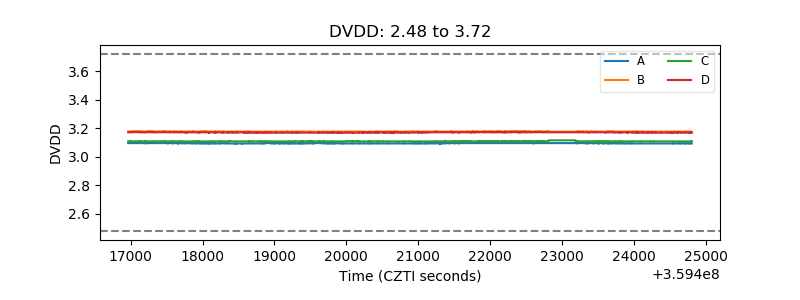 |
| Temperature 1 | 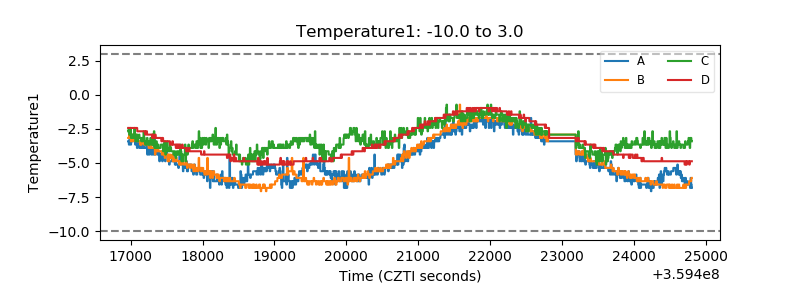 |
| Veto HV Monitor | 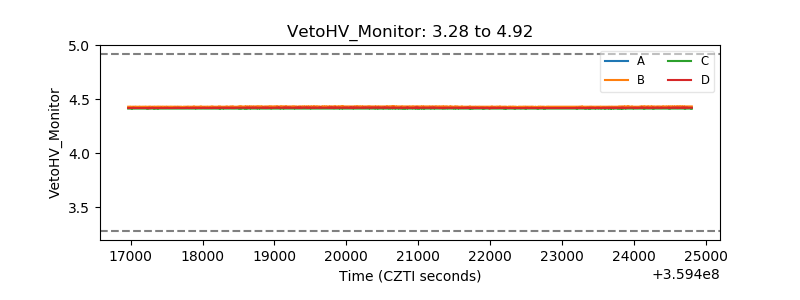 |
| Veto LLD | 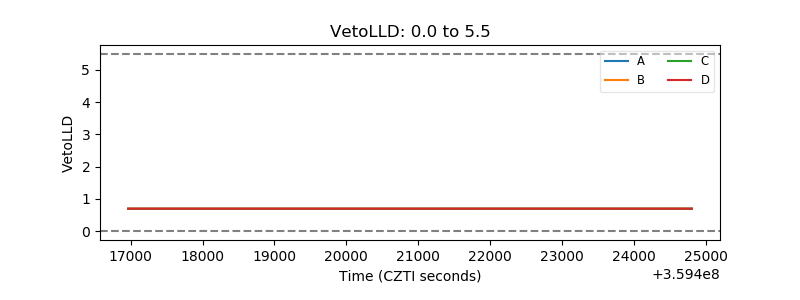 |
| Alpha Counter | 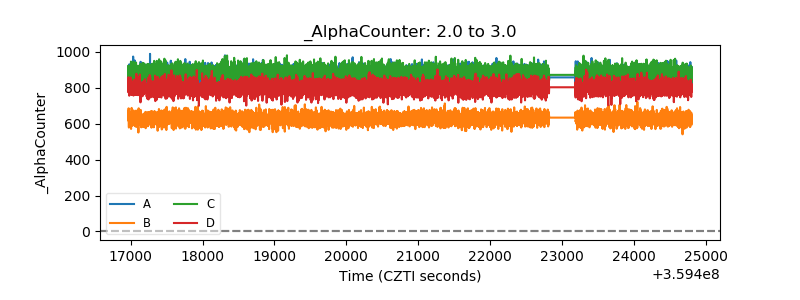 |
| _CPM_Rate | 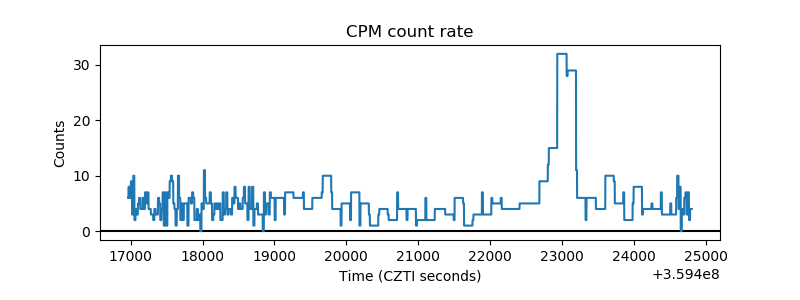 |
| CZT Counter |  |
| +2.5 Volts monitor |  |
| +5 Volts monitor |  |
| _ROLL_ROT | 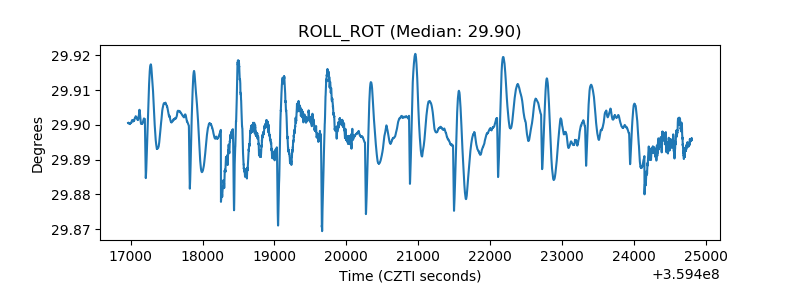 |
| _Roll_DEC | 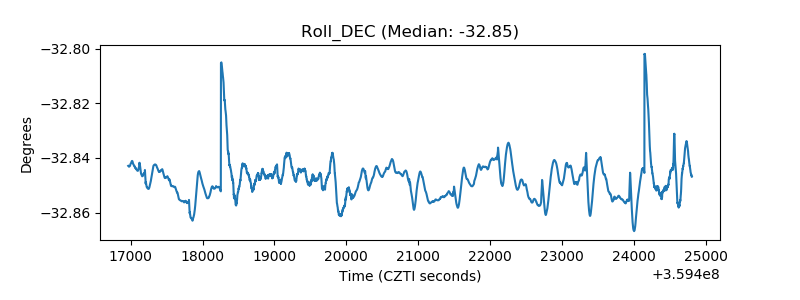 |
| _Roll_RA | 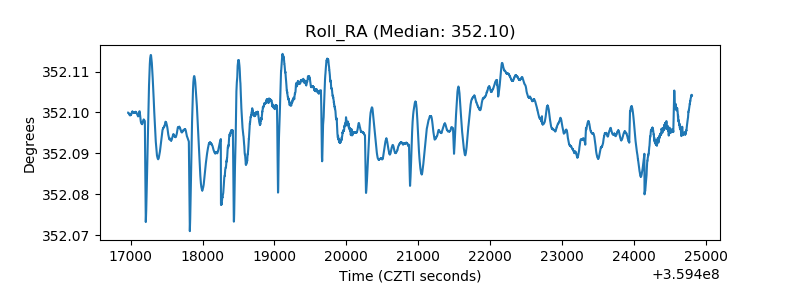 |
| Veto Counter | 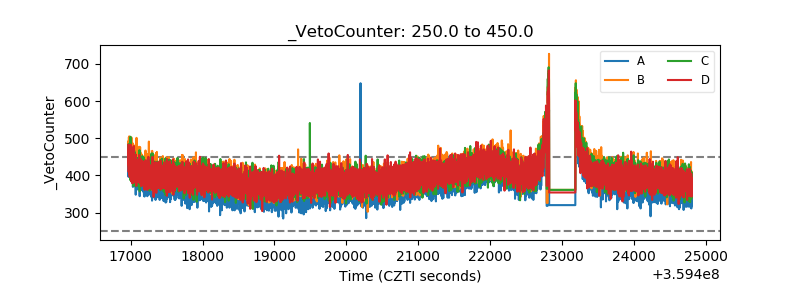 |