| Param | Original file | Final file |
|---|---|---|
| Filename | modeM0/AS1A10_053T20_9000004398_30550cztM0_level2.evt | modeM0/AS1A10_053T20_9000004398_30550cztM0_level2_quad_clean.evt |
| Size (bytes) | 717,557,760 | 136,569,600 |
| Size | 684.3 MB | 130.2 MB |
| Events in quadrant A | 4,312,134 | 897,172 |
| Events in quadrant B | 7,154,743 | 887,183 |
| Events in quadrant C | 4,800,721 | 857,767 |
| Events in quadrant D | 4,836,087 | 850,842 |
| Mode M0 | |||
|---|---|---|---|
| Quadrant | BADHDUFLAG | Total packets | Discarded packets |
| A | 0 | 18953 | 2 |
| B | 0 | 28261 | 2 |
| C | 0 | 19898 | 2 |
| D | 0 | 20403 | 2 |
| Mode M9 | |||
|---|---|---|---|
| Quadrant | BADHDUFLAG | Total packets | Discarded packets |
| A | 0 | 6 | 0 |
| B | 0 | 7 | 0 |
| C | 0 | 7 | 0 |
| D | 0 | 7 | 0 |
| Mode SS | |||
|---|---|---|---|
| Quadrant | BADHDUFLAG | Total packets | Discarded packets |
| A | 0 | 188 | 0 |
| B | 0 | 188 | 0 |
| C | 0 | 188 | 0 |
| D | 0 | 188 | 0 |
| Quadrant | Total seconds | Saturated seconds | Saturation percentage |
|---|---|---|---|
| A | 9273 | 60 | 0.647040% |
| B | 9273 | 191 | 2.059743% |
| C | 9273 | 199 | 2.146015% |
| D | 9273 | 106 | 1.143104% |
Noise dominated data is calculated using 1-second bins in cleaned event files. If a bin has >2000 counts, and if more than 50% of those come from <1% of pixels, then it is considered to be noise-dominated and hence unusable.
| Quadrant | # 1 sec bins | Bins with >0 counts | Bins with >2000 counts | High rate bins dominated by noise | Noise dominated (total time) | Noise dominated (detector-on time) | Marked lightcurve |
|---|---|---|---|---|---|---|---|
| A | 9793 | 9274 | 3 | 3 | 0.03% | 0.03% | 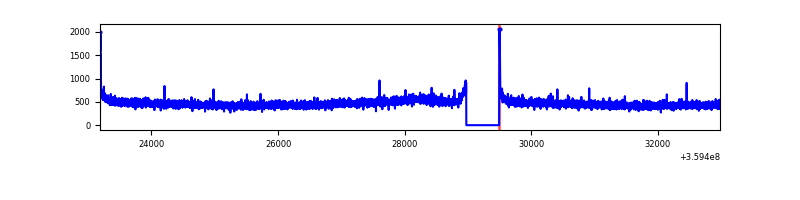 |
| B | 9793 | 9274 | 36 | 36 | 0.37% | 0.39% | 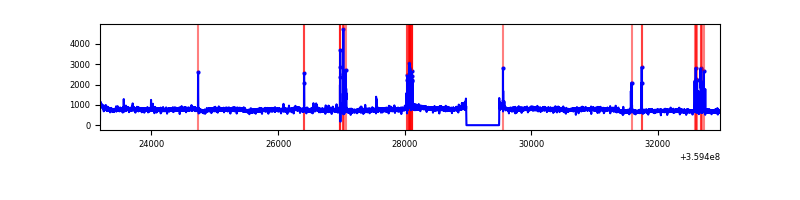 |
| C | 9793 | 9274 | 31 | 31 | 0.32% | 0.33% | 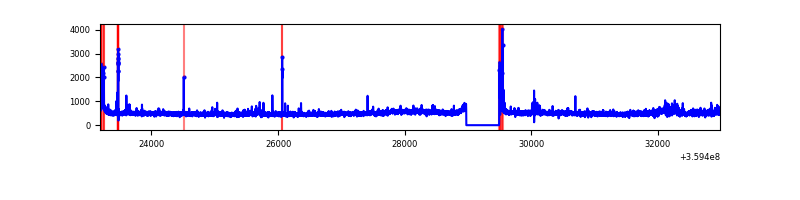 |
| D | 9793 | 9274 | 67 | 67 | 0.68% | 0.72% | 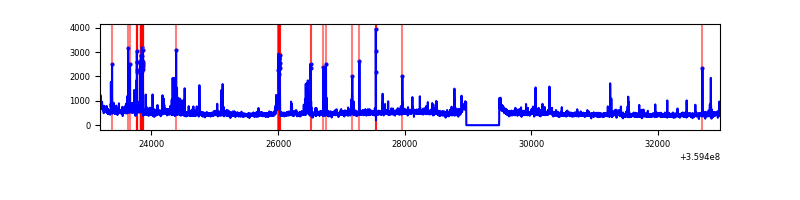 |
Top three noisy pixels from each quadrant. If the there are fewer than three noisy pixels in the level2.evt file, extra rows are filled as -1
| Pixel properties | Quadrant properties | ||||||
|---|---|---|---|---|---|---|---|
| Quadrant | DetID | PixID | Counts | Sigma | Mean | Median | Sigma |
| A | 8 | 192 | 35357 | 153.66 | 1109 | 1085 | 223.0 |
| A | 13 | 254 | 16989 | 71.31 | 1109 | 1085 | 223.0 |
| A | 3 | 137 | 11352 | 46.03 | 1109 | 1085 | 223.0 |
| B | 6 | 159 | 2669399 | 12682.87 | 1089 | 1060 | 210.4 |
| B | 6 | 36 | 82402 | 386.63 | 1089 | 1060 | 210.4 |
| B | 4 | 171 | 65814 | 307.78 | 1089 | 1060 | 210.4 |
| C | 14 | 238 | 176353 | 706.23 | 1058 | 1064 | 248.2 |
| C | 0 | 10 | 155162 | 620.86 | 1058 | 1064 | 248.2 |
| C | 8 | 229 | 135158 | 540.26 | 1058 | 1064 | 248.2 |
| D | 1 | 52 | 396430 | 1546.12 | 1077 | 1051 | 255.7 |
| D | 8 | 195 | 147810 | 573.9 | 1077 | 1051 | 255.7 |
| D | 2 | 250 | 93116 | 360.02 | 1077 | 1051 | 255.7 |
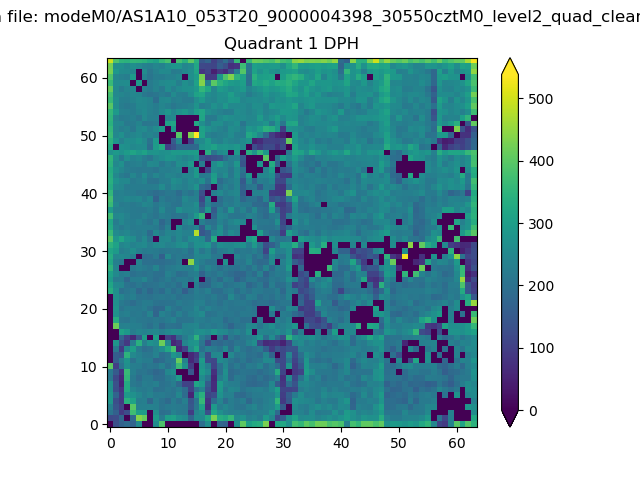
Histogram calculated using DETX and DETY for each event in the final _common_clean file
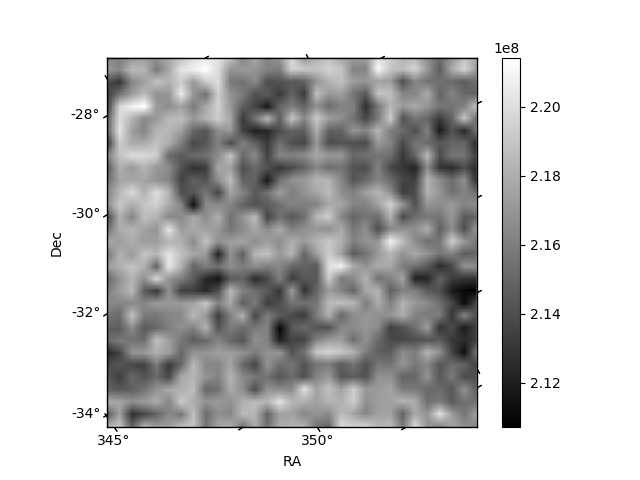
| Quadrant A |  |
 |
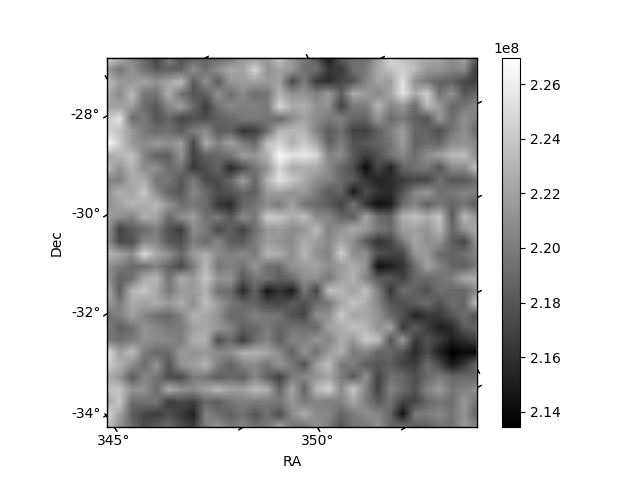
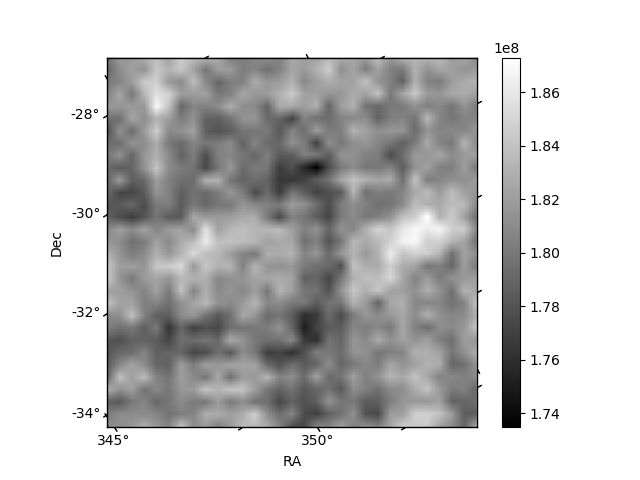
Quadrant B |
|---|---|---|---|
| Quadrant D | 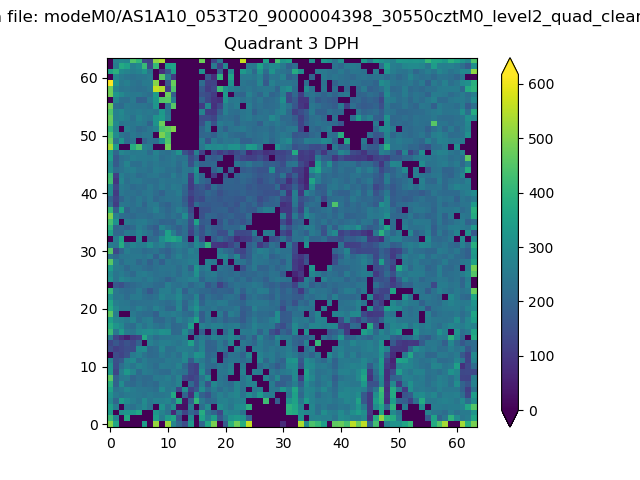 |
 |
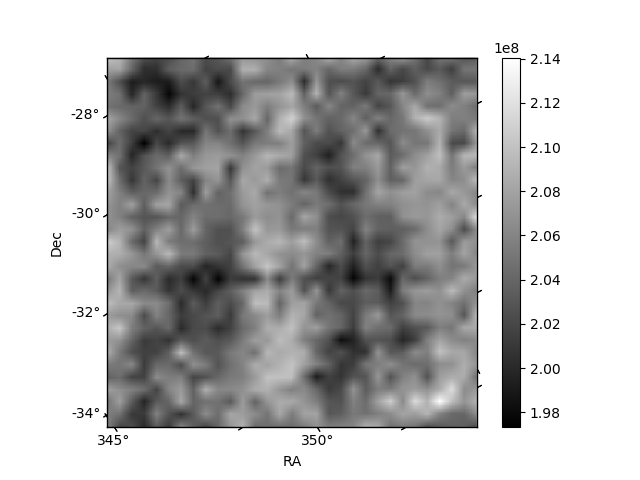
Quadrant C |
| Plot type | Count rate plots | Images |
|---|---|---|
| Comparison with Poisson distribution Blue bars denote a histogram of data divided into 1 sec bins. Red curve is a Poisson curve with rate = median count rate of data. |
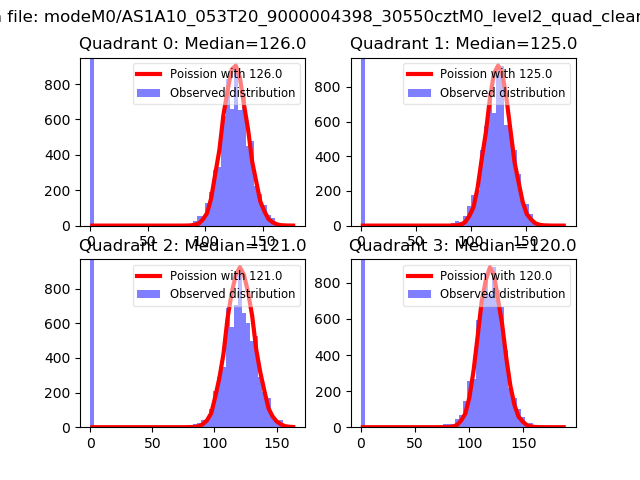 |
 |
| Quadrant-wise count rates Data is divided into 100 sec bins |
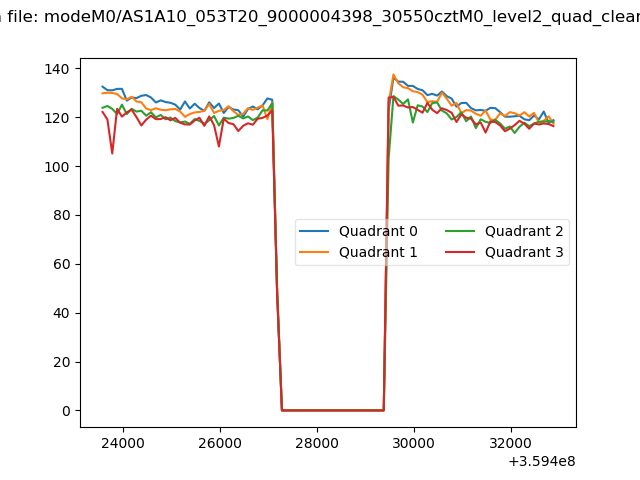 |
|
| Module-wise count rates for Quadrant A Data is divided into 100 sec bins |
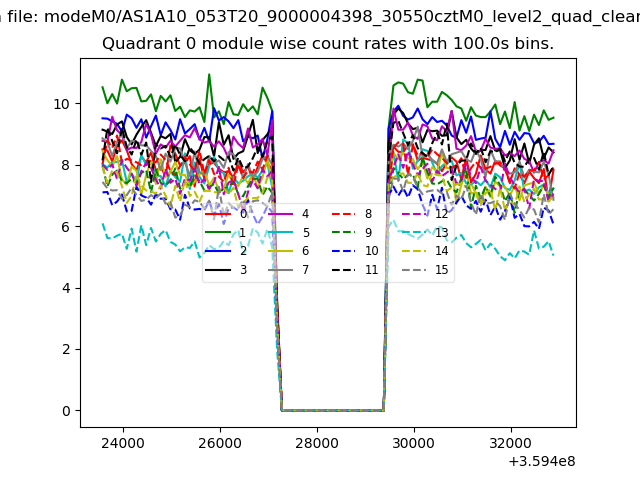 |
 |
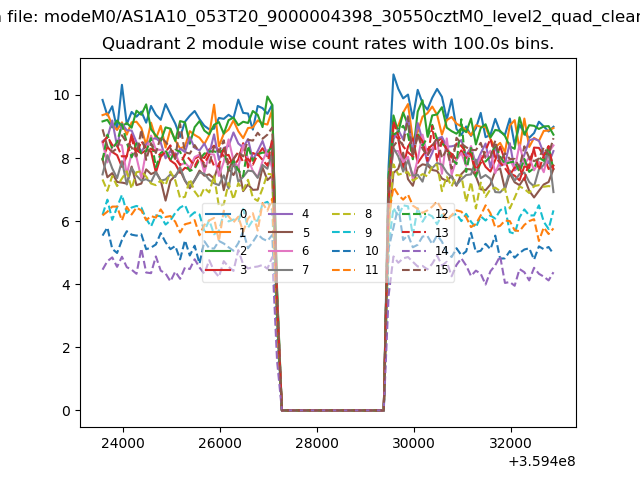
| Module-wise count rates for Quadrant B Data is divided into 100 sec bins |
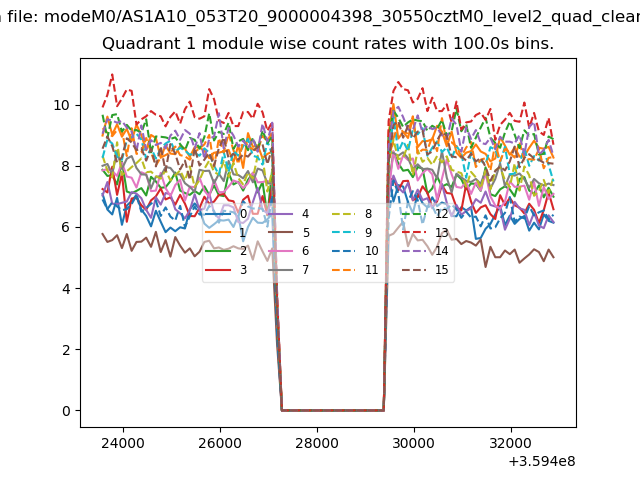 |
 |
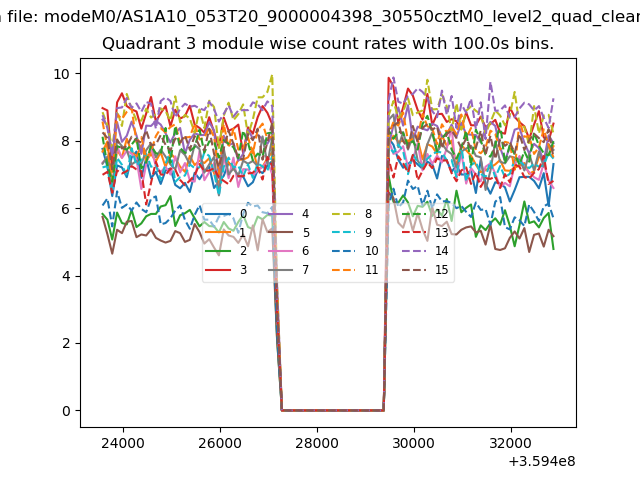
| Module-wise count rates for Quadrant C Data is divided into 100 sec bins |
 |
 |
| Module-wise count rates for Quadrant D Data is divided into 100 sec bins |
 |
 |
| Parameter | Plot |
|---|---|
| CZT HV Monitor | 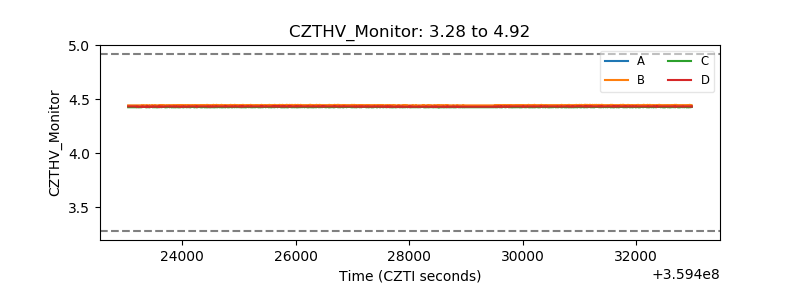 |
| D_VDD | 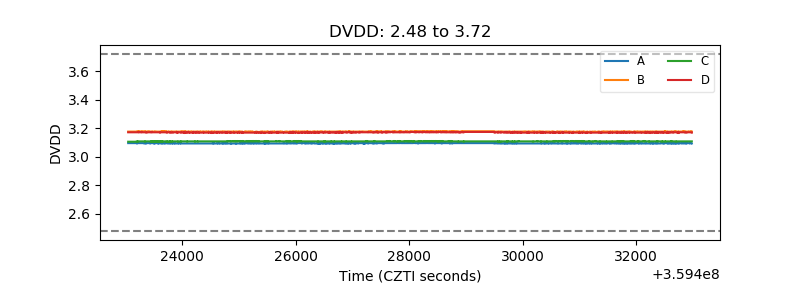 |
| Temperature 1 | 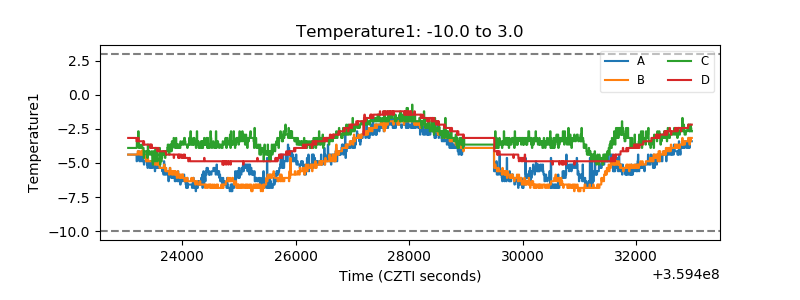 |
| Veto HV Monitor | 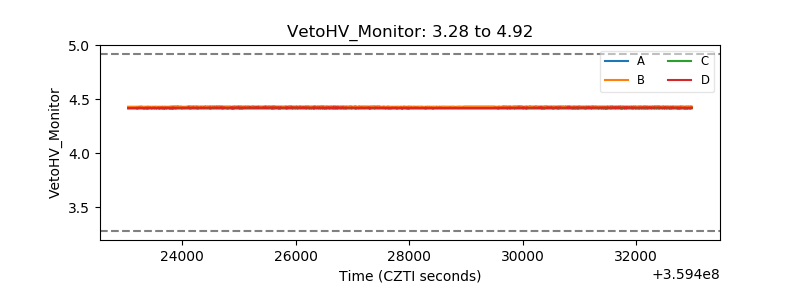 |
| Veto LLD | 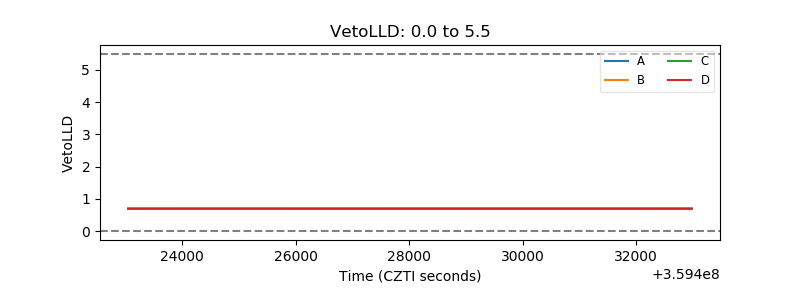 |
| Alpha Counter | 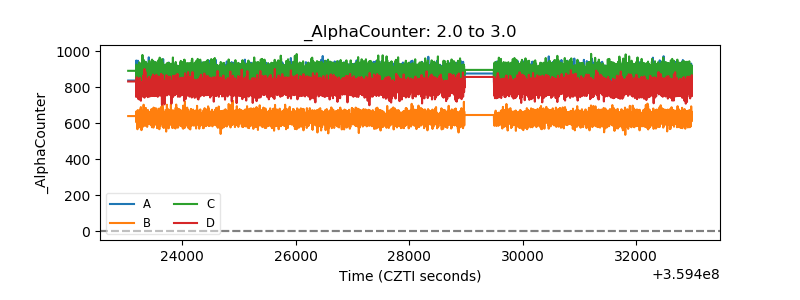 |
| _CPM_Rate | 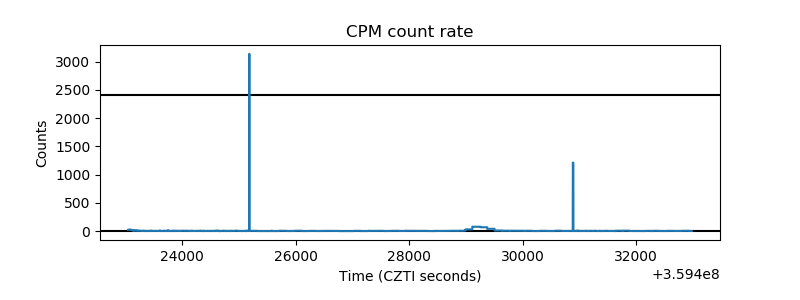 |
| CZT Counter |  |
| +2.5 Volts monitor |  |
| +5 Volts monitor |  |
| _ROLL_ROT | 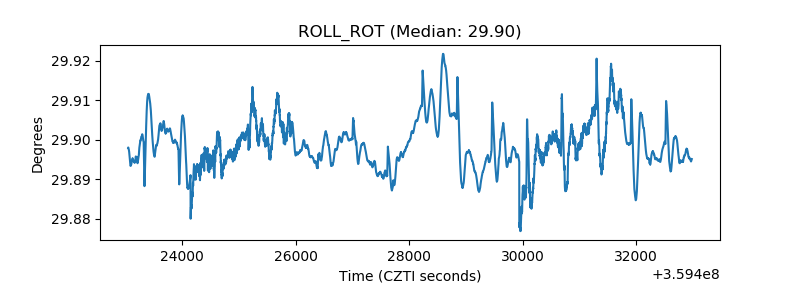 |
| _Roll_DEC | 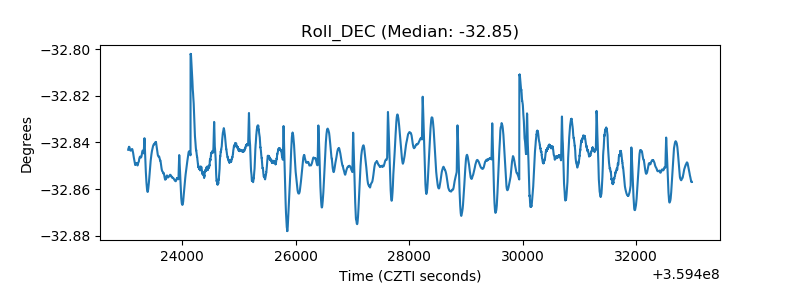 |
| _Roll_RA |  |
| Veto Counter | 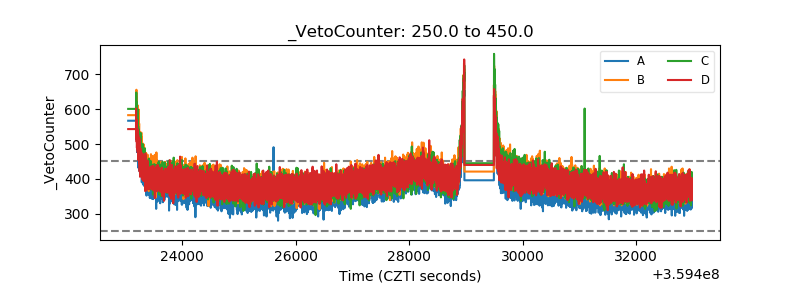 |