| Param | Original file | Final file |
|---|---|---|
| Filename | modeM0/AS1A10_055T01_9000004400cztM0_level2.fits | modeM0/AS1A10_055T01_9000004400cztM0_level2_quad_clean.evt |
| Size (bytes) | 527,904,000 | 401,440,320 |
| Size | 503.4 MB | 382.8 MB |
| Events in quadrant A | 3,372,744 | 2,312,672 |
| Events in quadrant B | 3,130,550 | 2,265,421 |
| Events in quadrant C | 3,183,970 | 2,142,766 |
| Events in quadrant D | 2,880,382 | 2,014,696 |
| Mode SS | |||
|---|---|---|---|
| Quadrant | BADHDUFLAG | Total packets | Discarded packets |
| A | 0 | 1018 | 0 |
| B | 0 | 1018 | 0 |
| C | 0 | 1018 | 0 |
| D | 0 | 1018 | 0 |
| Mode M0 | |||
|---|---|---|---|
| Quadrant | BADHDUFLAG | Total packets | Discarded packets |
| A | 0 | 108693 | 0 |
| B | 0 | 153924 | 0 |
| C | 0 | 112501 | 0 |
| D | 0 | 120387 | 0 |
| Mode M9 | |||
|---|---|---|---|
| Quadrant | BADHDUFLAG | Total packets | Discarded packets |
| A | 0 | 104 | 0 |
| B | 0 | 104 | 0 |
| C | 0 | 104 | 0 |
| D | 0 | 104 | 0 |
| Quadrant | Total seconds | Saturated seconds | Saturation percentage |
|---|---|---|---|
| A | 49834 | 830 | 1.665530% |
| B | 49834 | 1273 | 2.554481% |
| C | 49834 | 1657 | 3.325039% |
| D | 49834 | 844 | 1.693623% |
Noise dominated data is calculated using 1-second bins in cleaned event files. If a bin has >2000 counts, and if more than 50% of those come from <1% of pixels, then it is considered to be noise-dominated and hence unusable.
| Quadrant | # 1 sec bins | Bins with >0 counts | Bins with >2000 counts | High rate bins dominated by noise | Noise dominated (total time) | Noise dominated (detector-on time) | Marked lightcurve |
|---|---|---|---|---|---|---|---|
| A | 60244 | 49829 | 0 | 0 | 0.00% | 0.00% |  |
| B | 60244 | 49834 | 0 | 0 | 0.00% | 0.00% | 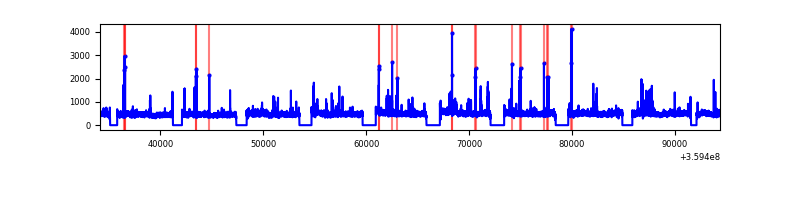 |
| C | 60244 | 49833 | 0 | 0 | 0.00% | 0.00% |  |
| D | 60244 | 49832 | 0 | 0 | 0.00% | 0.00% | 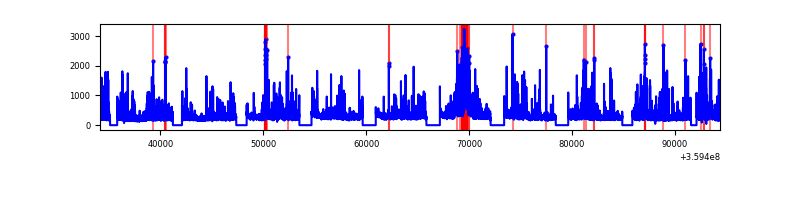 |
Top three noisy pixels from each quadrant. If the there are fewer than three noisy pixels in the level2.evt file, extra rows are filled as -1
| Pixel properties | Quadrant properties | ||||||
|---|---|---|---|---|---|---|---|
| Quadrant | DetID | PixID | Counts | Sigma | Mean | Median | Sigma |
| A | 7 | 110 | 2624 | 8.42 | 880 | 834 | 212.6 |
| A | 0 | 29 | 2622 | 8.41 | 880 | 834 | 212.6 |
| A | 9 | 19 | 2511 | 7.88 | 880 | 834 | 212.6 |
| B | 2 | 9 | 2470 | 10.31 | 829 | 798 | 162.2 |
| B | 3 | 80 | 2106 | 8.06 | 829 | 798 | 162.2 |
| B | 2 | 8 | 2063 | 7.8 | 829 | 798 | 162.2 |
| C | 1 | 81 | 2480 | 8.01 | 840 | 792 | 210.9 |
| C | 1 | 80 | 2393 | 7.59 | 840 | 792 | 210.9 |
| C | 12 | 241 | 2160 | 6.49 | 840 | 792 | 210.9 |
| D | 15 | 46 | 2142 | 6.46 | 822 | 754 | 214.7 |
| D | 3 | 14 | 2061 | 6.09 | 822 | 754 | 214.7 |
| D | 6 | 67 | 2040 | 5.99 | 822 | 754 | 214.7 |
Histogram calculated using DETX and DETY for each event in the final _common_clean file
| Quadrant A | 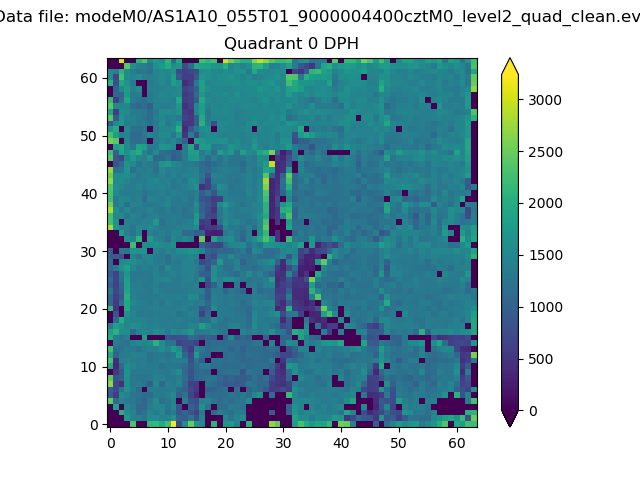 |
 |
Quadrant B |
|---|---|---|---|
| Quadrant D | 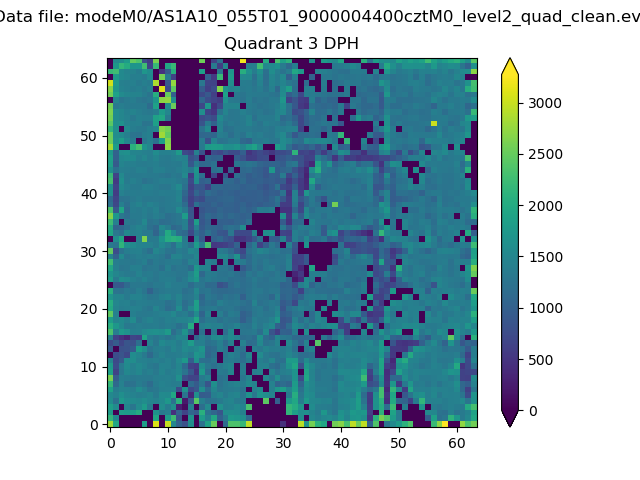 |
 |
Quadrant C |
| Plot type | Count rate plots | Images |
|---|---|---|
| Comparison with Poisson distribution Blue bars denote a histogram of data divided into 1 sec bins. Red curve is a Poisson curve with rate = median count rate of data. |
 |
 |
| Quadrant-wise count rates Data is divided into 100 sec bins |
 |
|
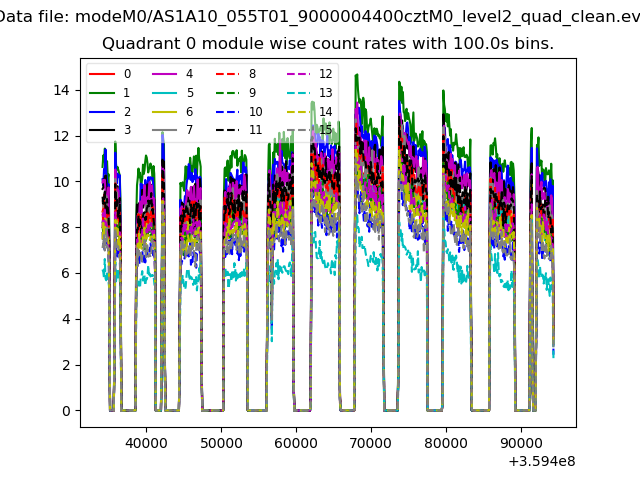
| Module-wise count rates for Quadrant A Data is divided into 100 sec bins |
 |
 |
| Module-wise count rates for Quadrant B Data is divided into 100 sec bins |
 |
 |
| Module-wise count rates for Quadrant C Data is divided into 100 sec bins |
 |
 |
| Module-wise count rates for Quadrant D Data is divided into 100 sec bins |
 |
 |
| Parameter | Plot |
|---|---|
| CZT HV Monitor |  |
| D_VDD | 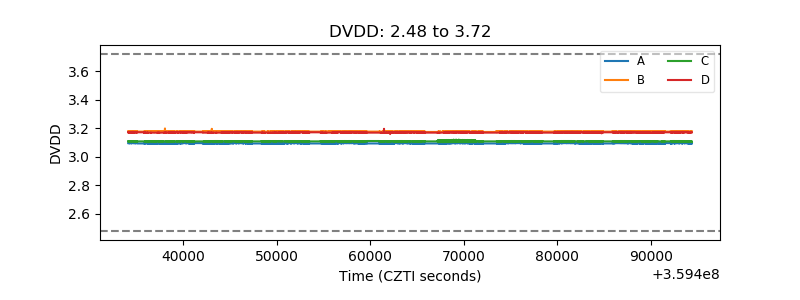 |
| Temperature 1 |  |
| Veto HV Monitor |  |
| Veto LLD |  |
| Alpha Counter |  |
| _CPM_Rate |  |
| CZT Counter |  |
| +2.5 Volts monitor |  |
| +5 Volts monitor |  |
| _ROLL_ROT | 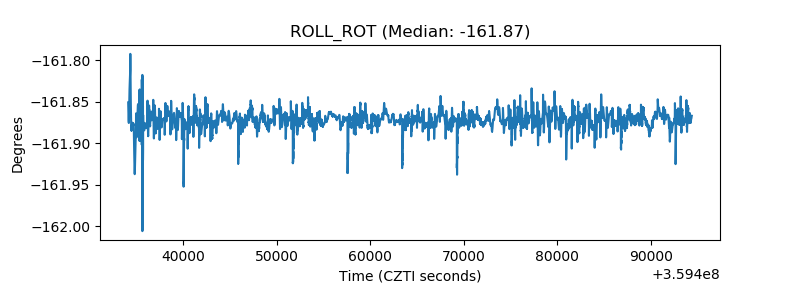 |
| _Roll_DEC |  |
| _Roll_RA | 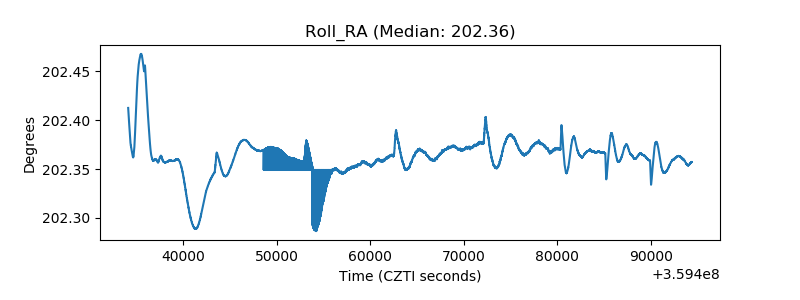 |
| Veto Counter |  |