| Param | Original file | Final file |
|---|---|---|
| Filename | modeM0/AS1A10_055T01_9000004400_30550cztM0_level2.evt | modeM0/AS1A10_055T01_9000004400_30550cztM0_level2_quad_clean.evt |
| Size (bytes) | 199,560,960 | 36,604,800 |
| Size | 190.3 MB | 34.9 MB |
| Events in quadrant A | 1,189,049 | 243,316 |
| Events in quadrant B | 1,887,724 | 240,643 |
| Events in quadrant C | 1,387,980 | 223,777 |
| Events in quadrant D | 1,413,046 | 226,719 |
| Mode SS | |||
|---|---|---|---|
| Quadrant | BADHDUFLAG | Total packets | Discarded packets |
| A | 0 | 50 | 0 |
| B | 0 | 50 | 0 |
| C | 0 | 50 | 0 |
| D | 0 | 50 | 0 |
| Mode M0 | |||
|---|---|---|---|
| Quadrant | BADHDUFLAG | Total packets | Discarded packets |
| A | 0 | 5021 | 1 |
| B | 0 | 7390 | 2 |
| C | 0 | 5523 | 1 |
| D | 0 | 5806 | 1 |
| Mode M9 | |||
|---|---|---|---|
| Quadrant | BADHDUFLAG | Total packets | Discarded packets |
| A | 0 | 7 | 0 |
| B | 0 | 7 | 0 |
| C | 0 | 7 | 0 |
| D | 0 | 7 | 0 |
| Quadrant | Total seconds | Saturated seconds | Saturation percentage |
|---|---|---|---|
| A | 2415 | 42 | 1.739130% |
| B | 2414 | 75 | 3.106877% |
| C | 2414 | 120 | 4.971002% |
| D | 2414 | 67 | 2.775476% |
Noise dominated data is calculated using 1-second bins in cleaned event files. If a bin has >2000 counts, and if more than 50% of those come from <1% of pixels, then it is considered to be noise-dominated and hence unusable.
| Quadrant | # 1 sec bins | Bins with >0 counts | Bins with >2000 counts | High rate bins dominated by noise | Noise dominated (total time) | Noise dominated (detector-on time) | Marked lightcurve |
|---|---|---|---|---|---|---|---|
| A | 3110 | 2416 | 0 | 0 | 0.00% | 0.00% | 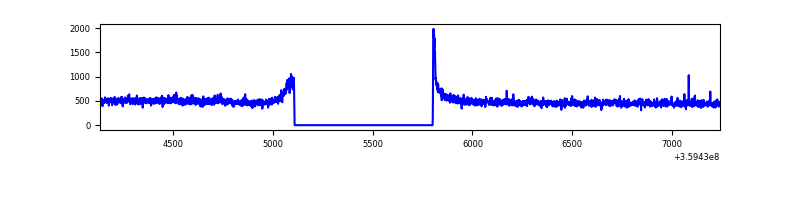 |
| B | 3109 | 2415 | 3 | 3 | 0.10% | 0.12% | 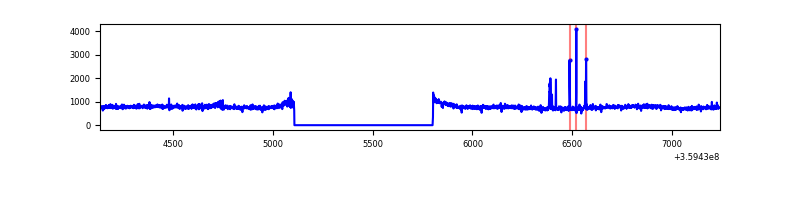 |
| C | 3109 | 2415 | 41 | 41 | 1.32% | 1.70% | 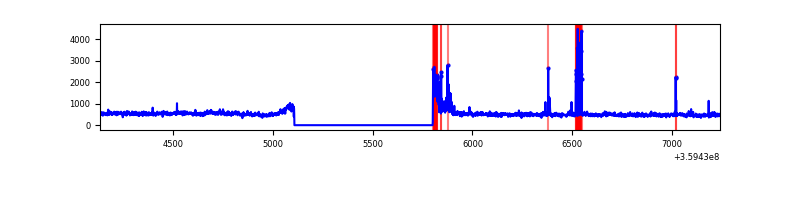 |
| D | 3109 | 2415 | 28 | 28 | 0.90% | 1.16% | 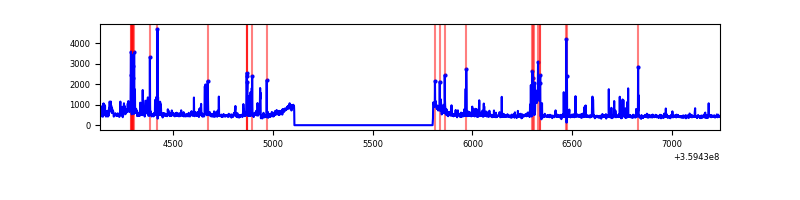 |
Top three noisy pixels from each quadrant. If the there are fewer than three noisy pixels in the level2.evt file, extra rows are filled as -1
| Pixel properties | Quadrant properties | ||||||
|---|---|---|---|---|---|---|---|
| Quadrant | DetID | PixID | Counts | Sigma | Mean | Median | Sigma |
| A | 8 | 192 | 13101 | 204.88 | 304 | 297 | 62.5 |
| A | 13 | 254 | 4251 | 63.27 | 304 | 297 | 62.5 |
| A | 3 | 137 | 3106 | 44.95 | 304 | 297 | 62.5 |
| B | 6 | 159 | 662008 | 11021.69 | 302 | 294 | 60.0 |
| B | 4 | 171 | 25227 | 415.29 | 302 | 294 | 60.0 |
| B | 15 | 36 | 7628 | 122.16 | 302 | 294 | 60.0 |
| C | 0 | 10 | 156548 | 2289.59 | 284 | 285 | 68.2 |
| C | 3 | 233 | 73688 | 1075.51 | 284 | 285 | 68.2 |
| C | 14 | 238 | 45715 | 665.65 | 284 | 285 | 68.2 |
| D | 1 | 52 | 239413 | 3363.12 | 290 | 282 | 71.1 |
| D | 13 | 249 | 33468 | 466.73 | 290 | 282 | 71.1 |
| D | 8 | 195 | 17827 | 246.75 | 290 | 282 | 71.1 |
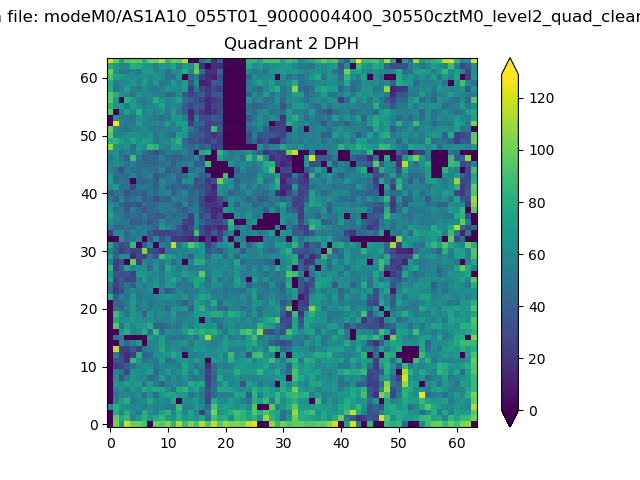
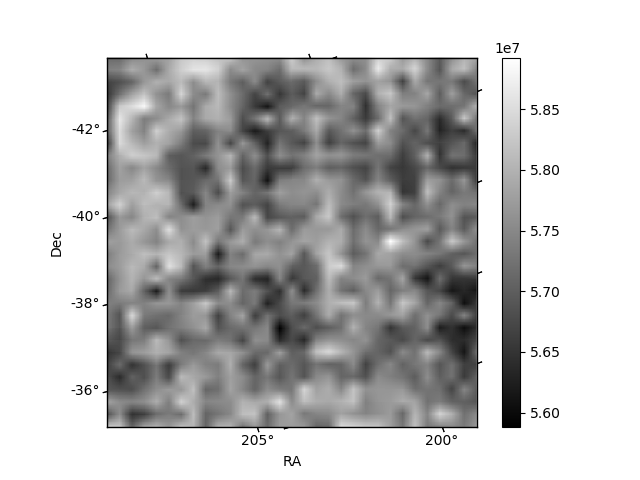
Histogram calculated using DETX and DETY for each event in the final _common_clean file
| Quadrant A |  |
 |
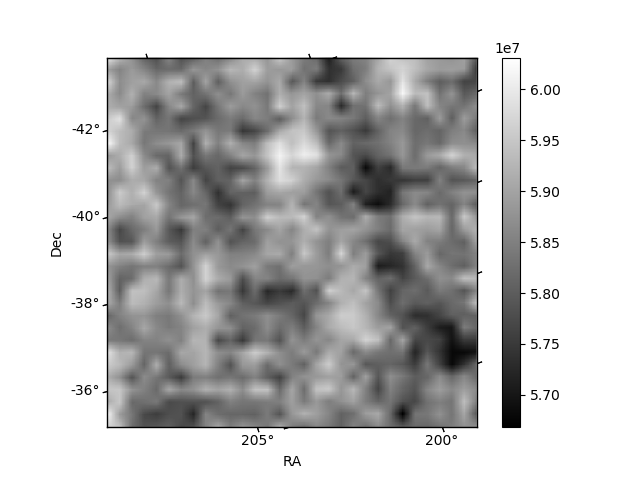
Quadrant B |
|---|---|---|---|
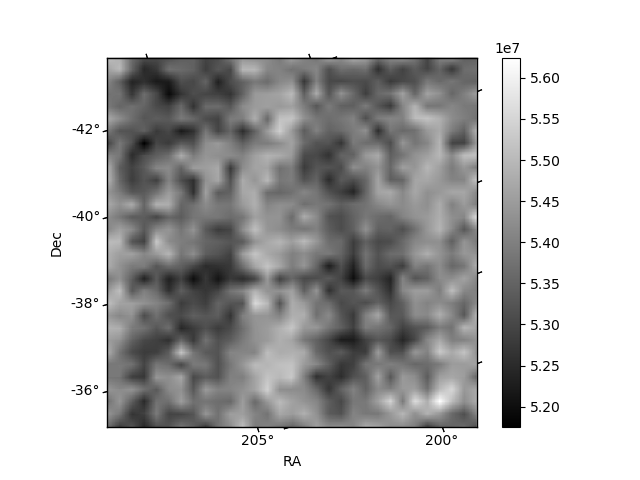
| Quadrant D |  |
 |
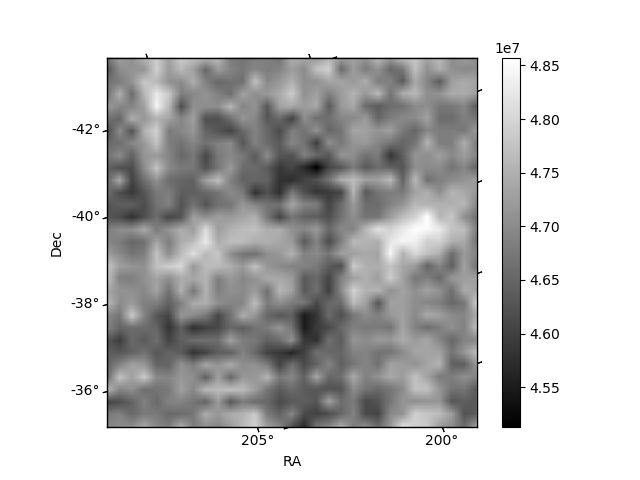
Quadrant C |
| Plot type | Count rate plots | Images |
|---|---|---|
| Comparison with Poisson distribution Blue bars denote a histogram of data divided into 1 sec bins. Red curve is a Poisson curve with rate = median count rate of data. |
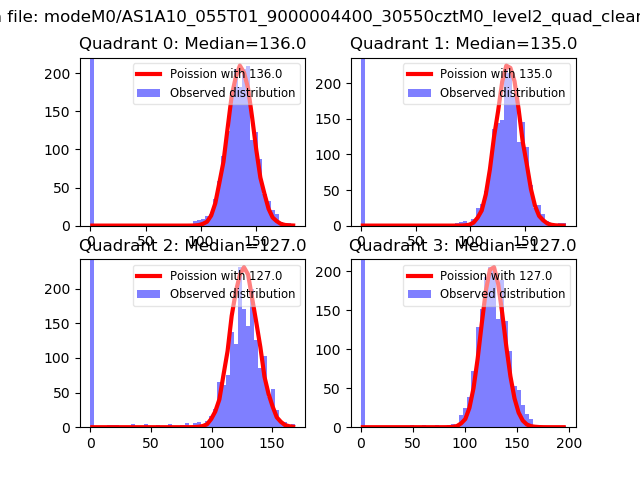 |
 |
| Quadrant-wise count rates Data is divided into 100 sec bins |
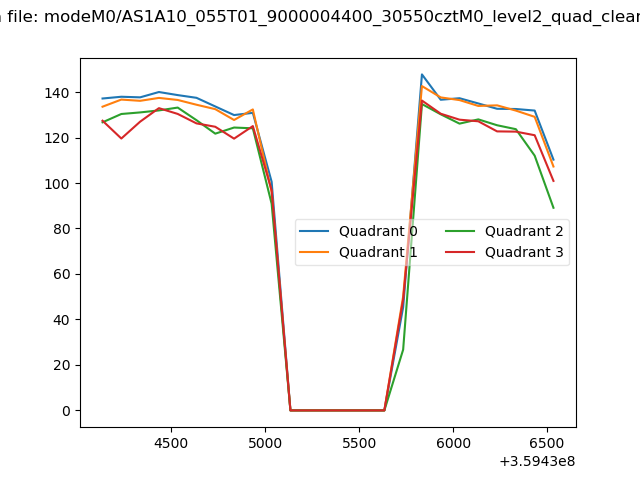 |
|
| Module-wise count rates for Quadrant A Data is divided into 100 sec bins |
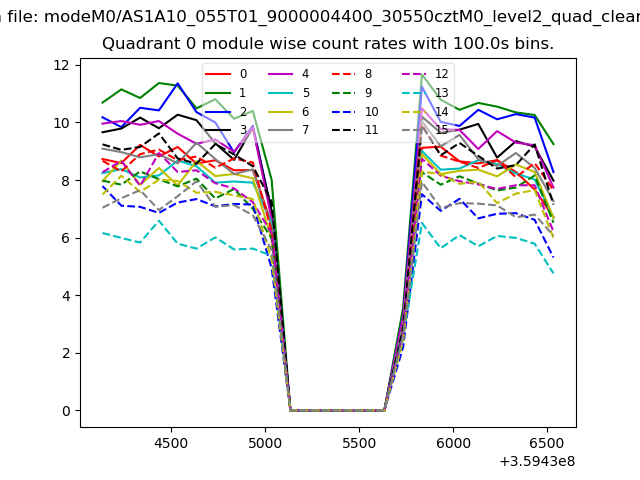 |
 |
| Module-wise count rates for Quadrant B Data is divided into 100 sec bins |
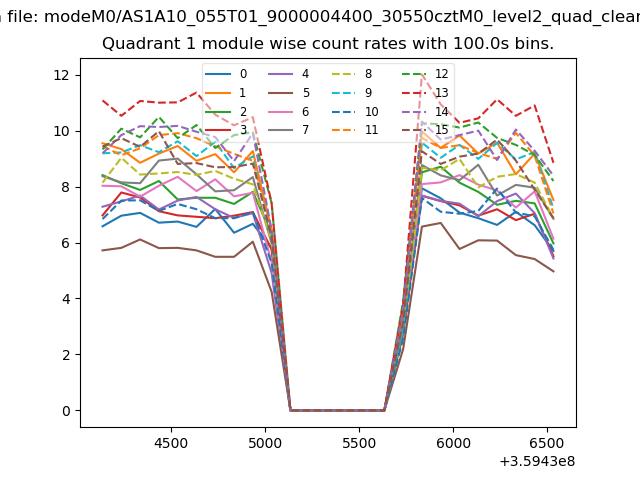 |
 |
| Module-wise count rates for Quadrant C Data is divided into 100 sec bins |
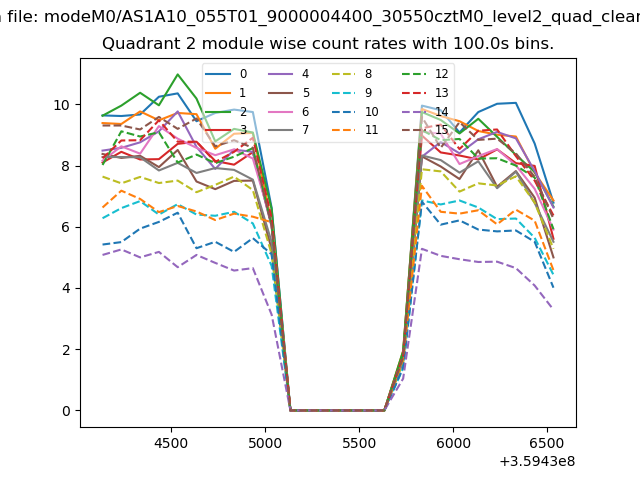 |
 |
| Module-wise count rates for Quadrant D Data is divided into 100 sec bins |
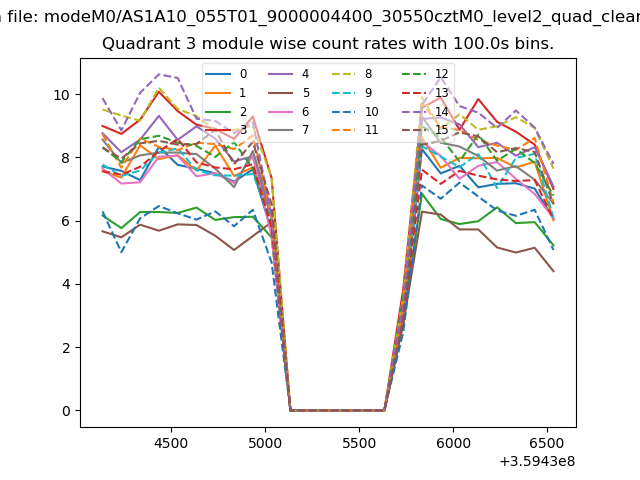 |
 |
| Parameter | Plot |
|---|---|
| CZT HV Monitor | 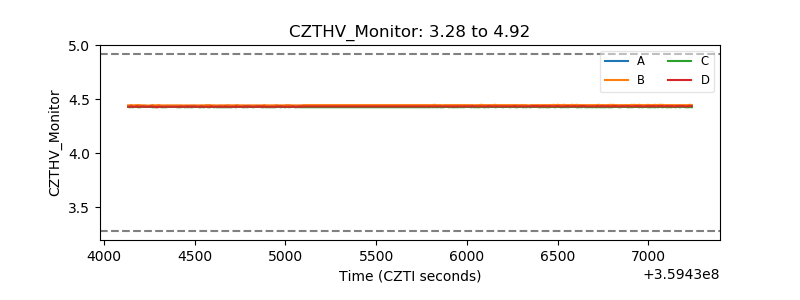 |
| D_VDD | 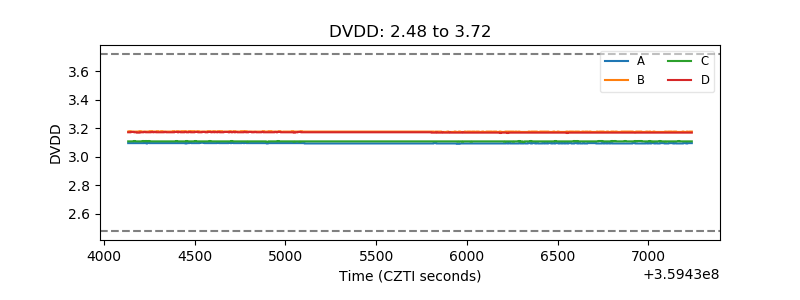 |
| Temperature 1 | 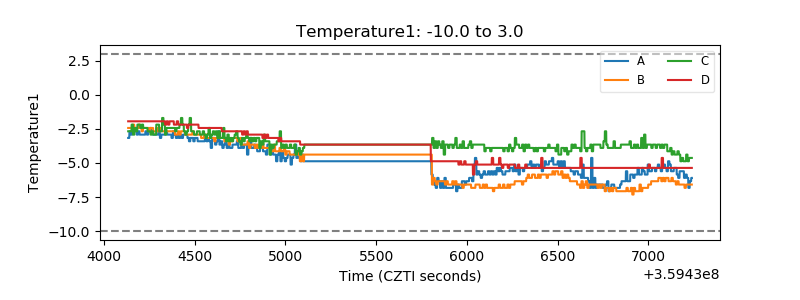 |
| Veto HV Monitor | 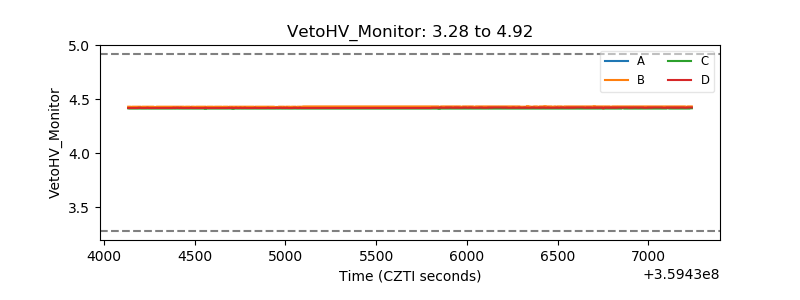 |
| Veto LLD | 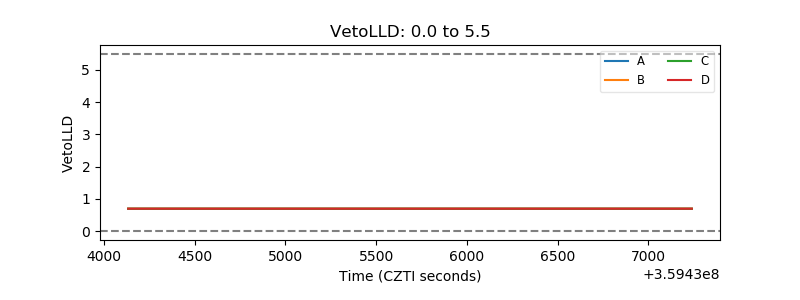 |
| Alpha Counter | 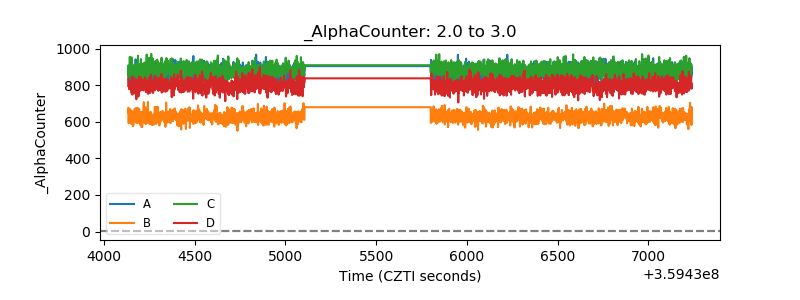 |
| _CPM_Rate | 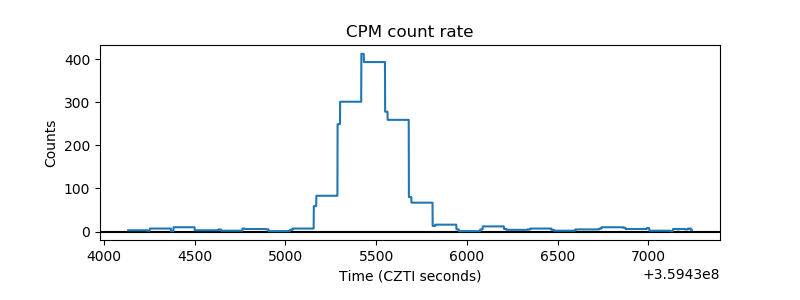 |
| CZT Counter | 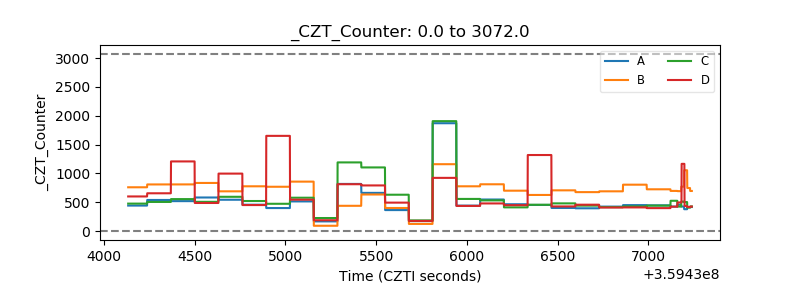 |
| +2.5 Volts monitor |  |
| +5 Volts monitor |  |
| _ROLL_ROT | 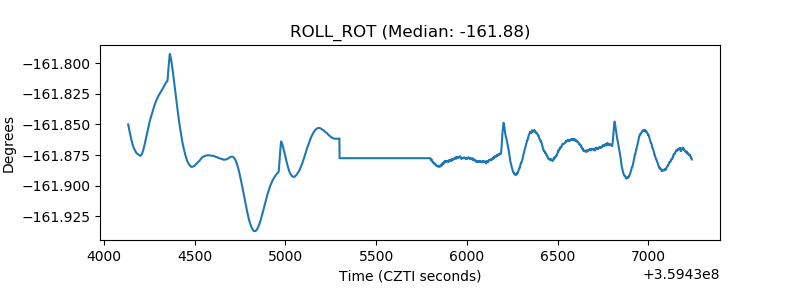 |
| _Roll_DEC | 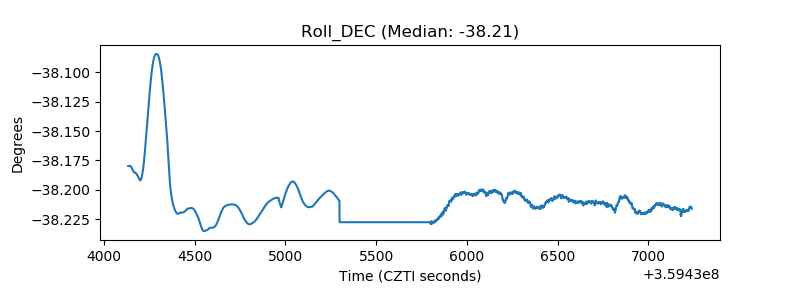 |
| _Roll_RA |  |
| Veto Counter | 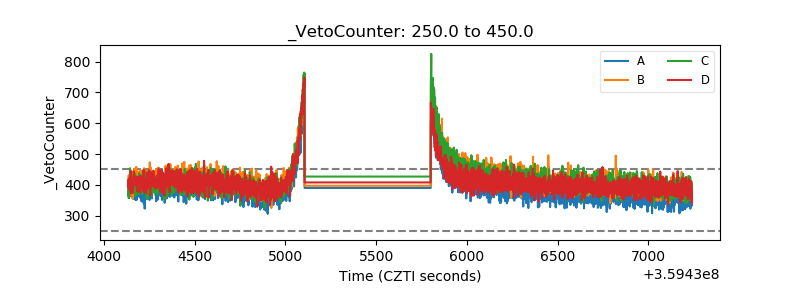 |