| Param | Original file | Final file |
|---|---|---|
| Filename | modeM0/AS1A10_055T01_9000004400_30551cztM0_level2.evt | modeM0/AS1A10_055T01_9000004400_30551cztM0_level2_quad_clean.evt |
| Size (bytes) | 565,732,800 | 89,498,880 |
| Size | 539.5 MB | 85.4 MB |
| Events in quadrant A | 3,481,874 | 567,554 |
| Events in quadrant B | 5,498,976 | 566,855 |
| Events in quadrant C | 3,804,449 | 533,726 |
| Events in quadrant D | 3,856,393 | 537,025 |
| Mode SS | |||
|---|---|---|---|
| Quadrant | BADHDUFLAG | Total packets | Discarded packets |
| A | 0 | 148 | 0 |
| B | 0 | 148 | 0 |
| C | 0 | 148 | 0 |
| D | 0 | 148 | 0 |
| Mode M0 | |||
|---|---|---|---|
| Quadrant | BADHDUFLAG | Total packets | Discarded packets |
| A | 0 | 14960 | 2 |
| B | 0 | 22025 | 4 |
| C | 0 | 15694 | 2 |
| D | 0 | 16211 | 2 |
| Mode M9 | |||
|---|---|---|---|
| Quadrant | BADHDUFLAG | Total packets | Discarded packets |
| A | 0 | 16 | 0 |
| B | 0 | 16 | 0 |
| C | 0 | 16 | 0 |
| D | 0 | 16 | 0 |
| Quadrant | Total seconds | Saturated seconds | Saturation percentage |
|---|---|---|---|
| A | 7257 | 69 | 0.950806% |
| B | 7257 | 143 | 1.970511% |
| C | 7257 | 211 | 2.907538% |
| D | 7257 | 99 | 1.364200% |
Noise dominated data is calculated using 1-second bins in cleaned event files. If a bin has >2000 counts, and if more than 50% of those come from <1% of pixels, then it is considered to be noise-dominated and hence unusable.
| Quadrant | # 1 sec bins | Bins with >0 counts | Bins with >2000 counts | High rate bins dominated by noise | Noise dominated (total time) | Noise dominated (detector-on time) | Marked lightcurve |
|---|---|---|---|---|---|---|---|
| A | 8832 | 7259 | 0 | 0 | 0.00% | 0.00% | 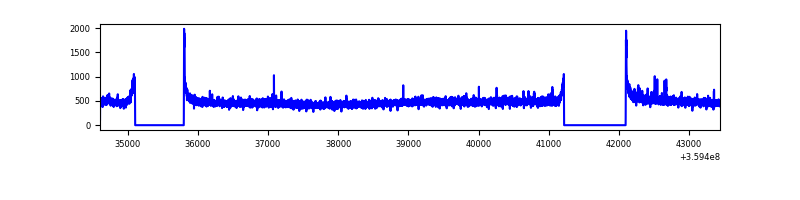 |
| B | 8832 | 7259 | 6 | 6 | 0.07% | 0.08% | 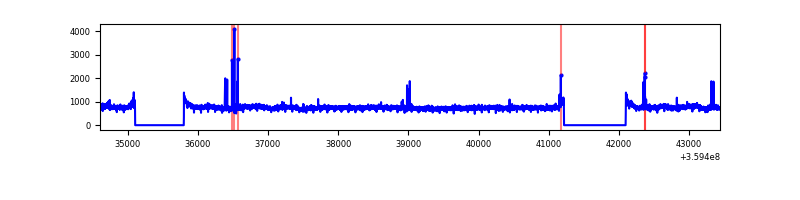 |
| C | 8832 | 7259 | 50 | 50 | 0.57% | 0.69% | 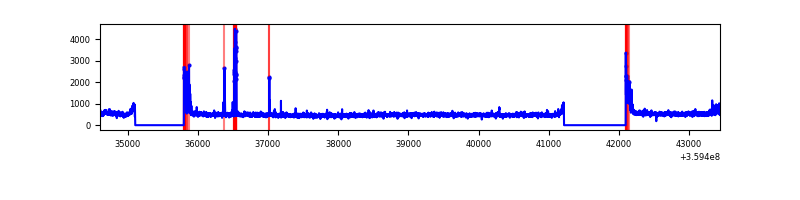 |
| D | 8832 | 7259 | 41 | 41 | 0.46% | 0.56% | 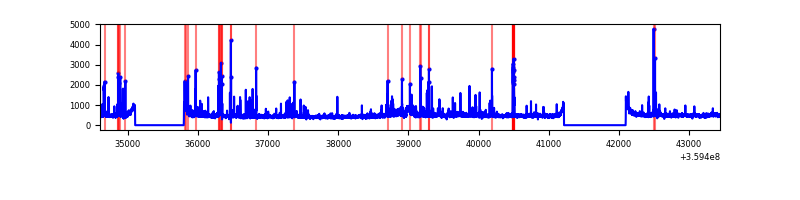 |
Top three noisy pixels from each quadrant. If the there are fewer than three noisy pixels in the level2.evt file, extra rows are filled as -1
| Pixel properties | Quadrant properties | ||||||
|---|---|---|---|---|---|---|---|
| Quadrant | DetID | PixID | Counts | Sigma | Mean | Median | Sigma |
| A | 0 | 13 | 25824 | 139.1 | 890 | 872 | 179.4 |
| A | 8 | 192 | 23782 | 127.71 | 890 | 872 | 179.4 |
| A | 13 | 254 | 12528 | 64.98 | 890 | 872 | 179.4 |
| B | 6 | 159 | 1952355 | 11502.13 | 883 | 862 | 169.7 |
| B | 4 | 171 | 47482 | 274.78 | 883 | 862 | 169.7 |
| B | 12 | 111 | 21184 | 119.78 | 883 | 862 | 169.7 |
| C | 0 | 10 | 235580 | 1175.41 | 846 | 848 | 199.7 |
| C | 14 | 238 | 138458 | 689.07 | 846 | 848 | 199.7 |
| C | 3 | 233 | 118663 | 589.95 | 846 | 848 | 199.7 |
| D | 1 | 52 | 339689 | 1658.42 | 860 | 839 | 204.3 |
| D | 8 | 195 | 76002 | 367.87 | 860 | 839 | 204.3 |
| D | 2 | 250 | 75362 | 364.74 | 860 | 839 | 204.3 |
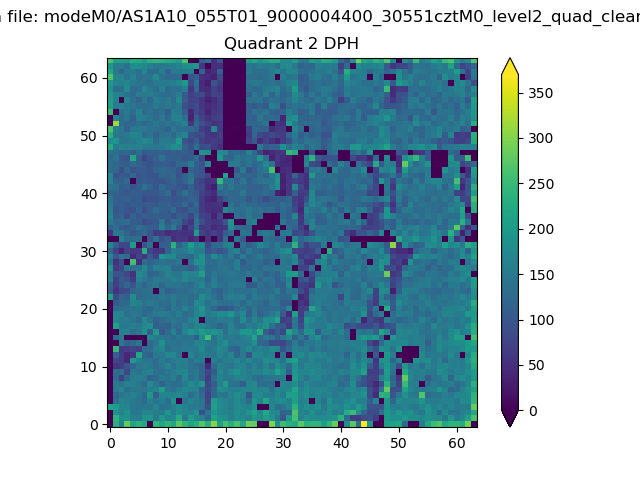
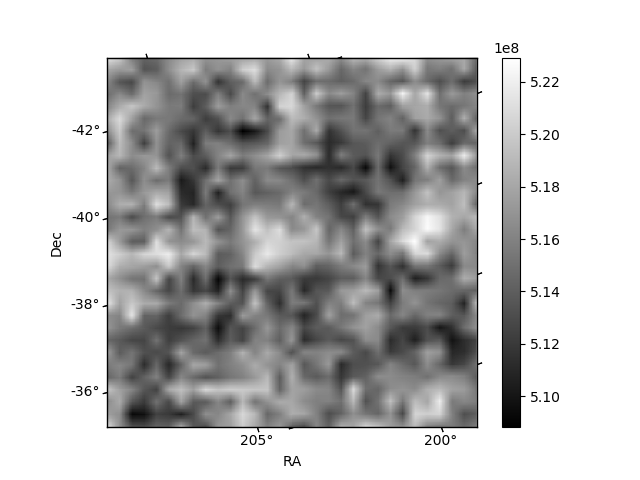
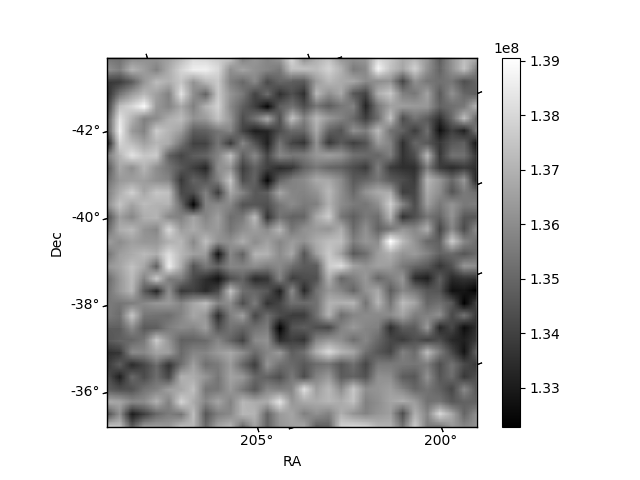
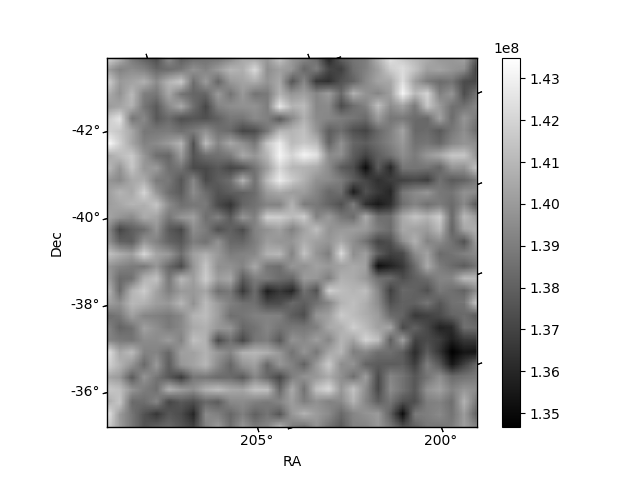
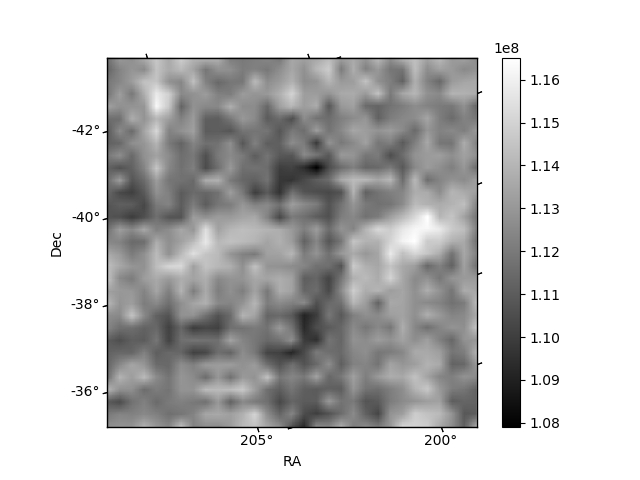
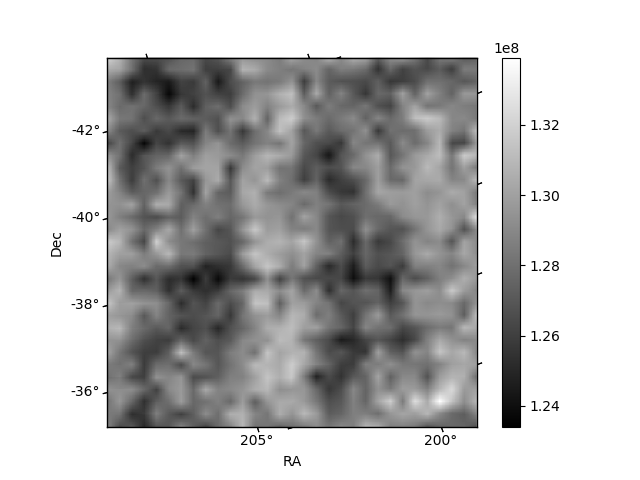
Histogram calculated using DETX and DETY for each event in the final _common_clean file
| Quadrant A | 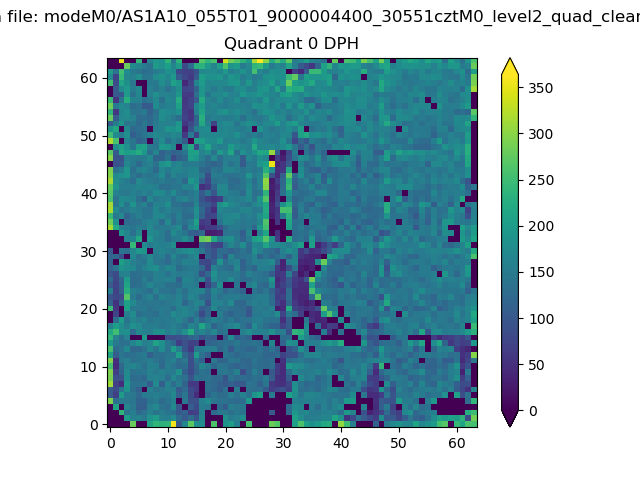 |
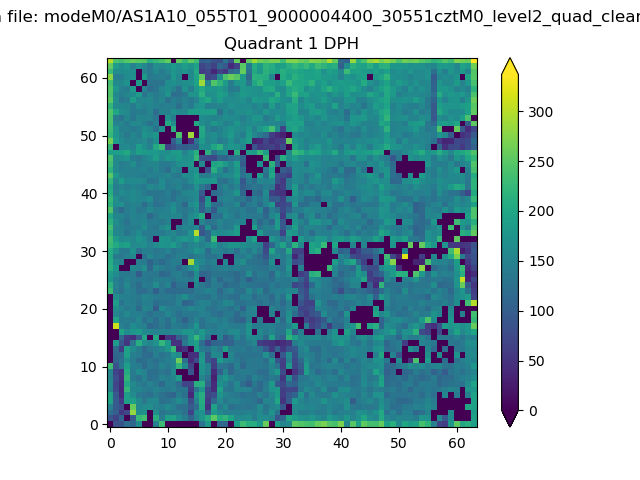 |
Quadrant B |
|---|---|---|---|
| Quadrant D | 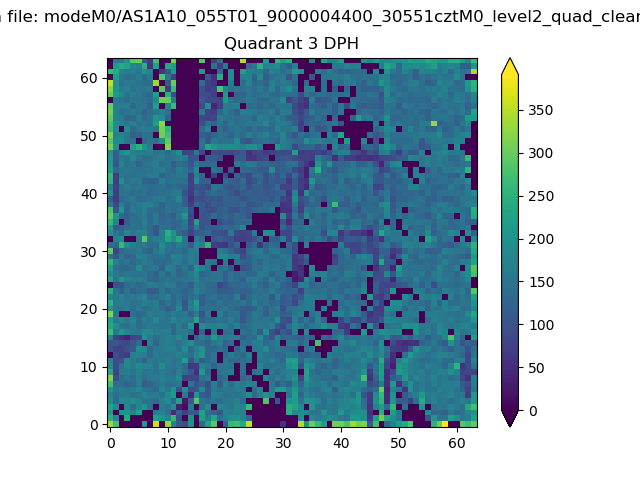 |
 |
Quadrant C |
| Plot type | Count rate plots | Images |
|---|---|---|
| Comparison with Poisson distribution Blue bars denote a histogram of data divided into 1 sec bins. Red curve is a Poisson curve with rate = median count rate of data. |
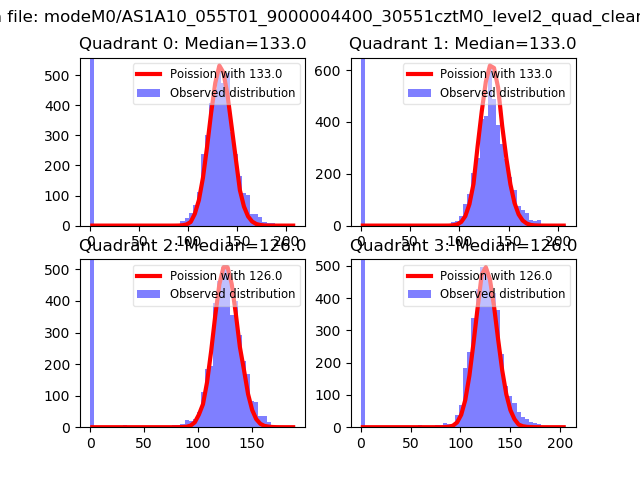 |
 |
| Quadrant-wise count rates Data is divided into 100 sec bins |
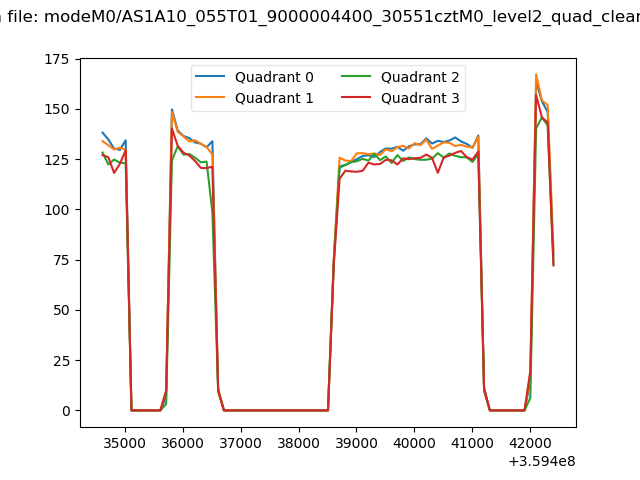 |
|
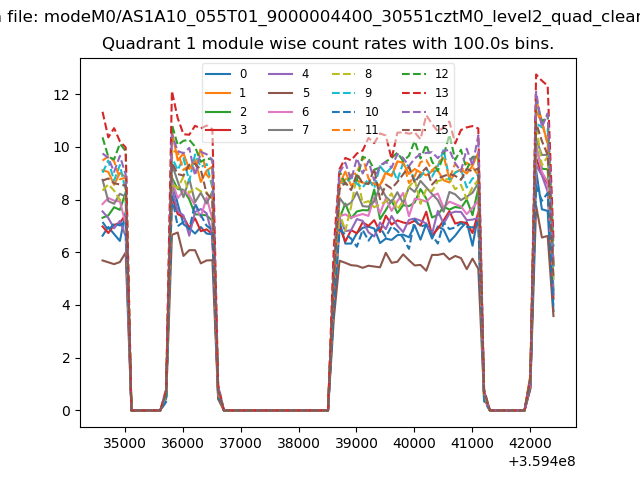
| Module-wise count rates for Quadrant A Data is divided into 100 sec bins |
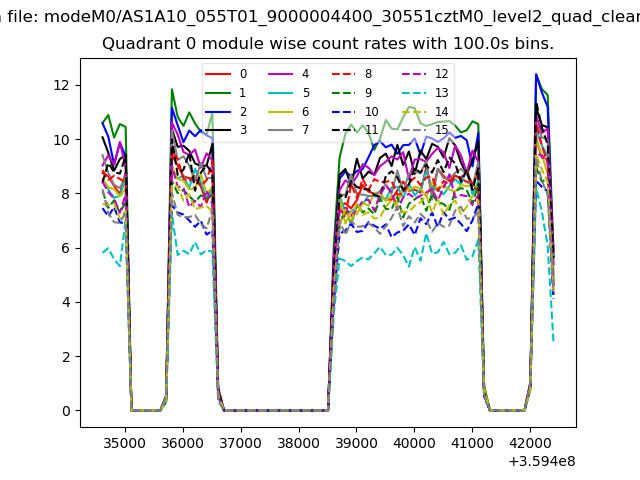 |
 |
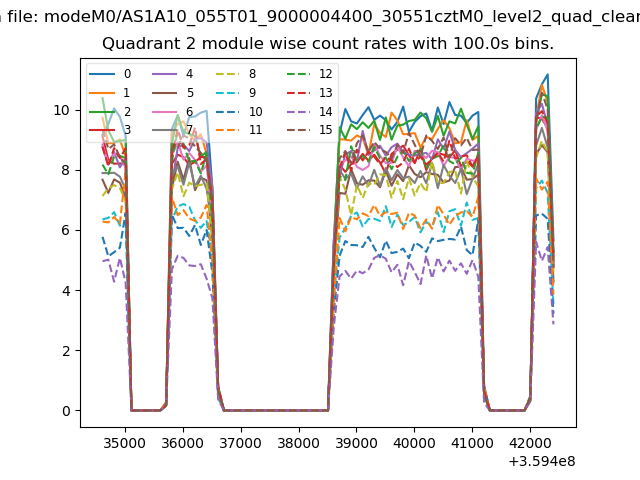
| Module-wise count rates for Quadrant B Data is divided into 100 sec bins |
 |
 |
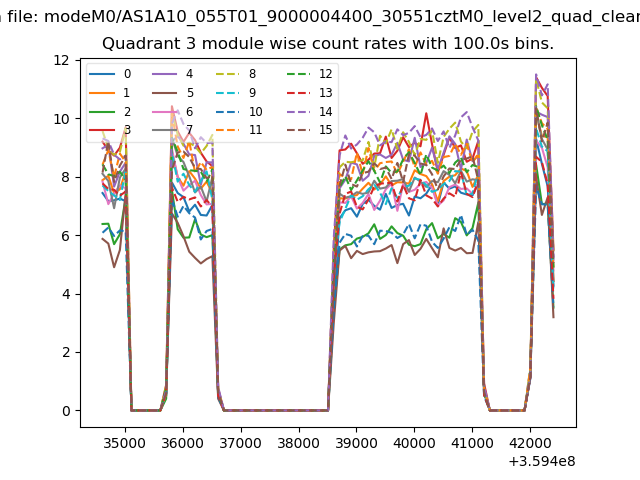
| Module-wise count rates for Quadrant C Data is divided into 100 sec bins |
 |
 |
| Module-wise count rates for Quadrant D Data is divided into 100 sec bins |
 |
 |
| Parameter | Plot |
|---|---|
| CZT HV Monitor | 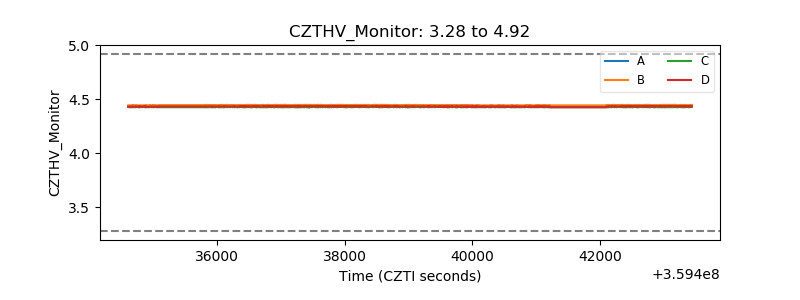 |
| D_VDD | 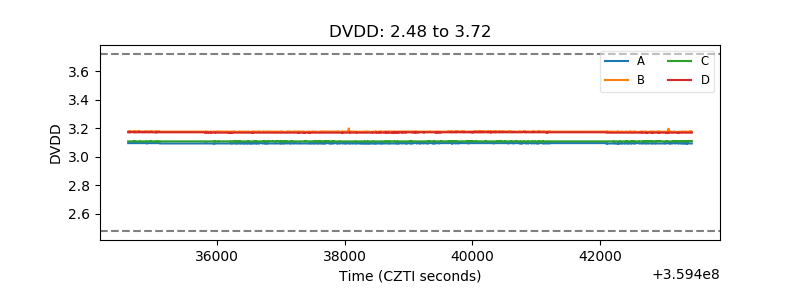 |
| Temperature 1 | 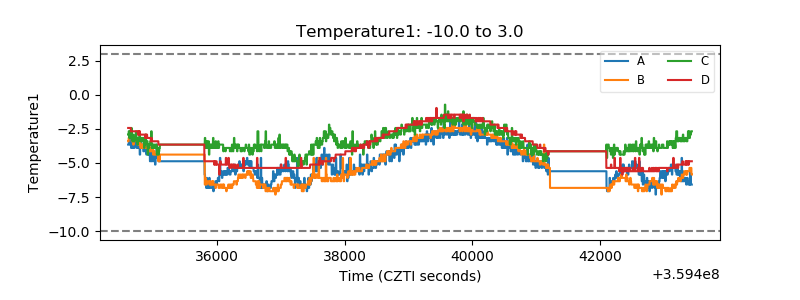 |
| Veto HV Monitor | 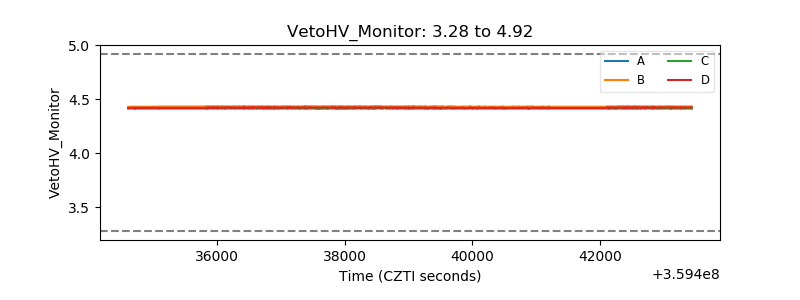 |
| Veto LLD | 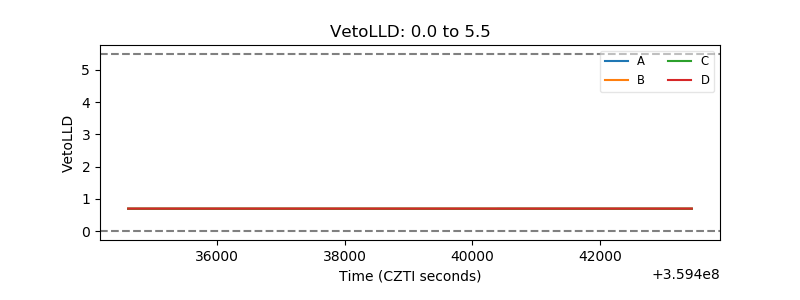 |
| Alpha Counter | 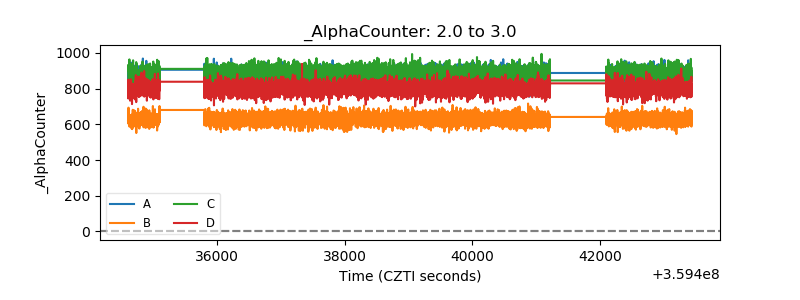 |
| _CPM_Rate | 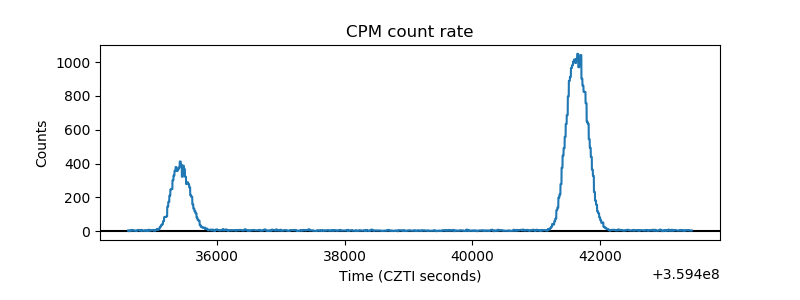 |
| CZT Counter | 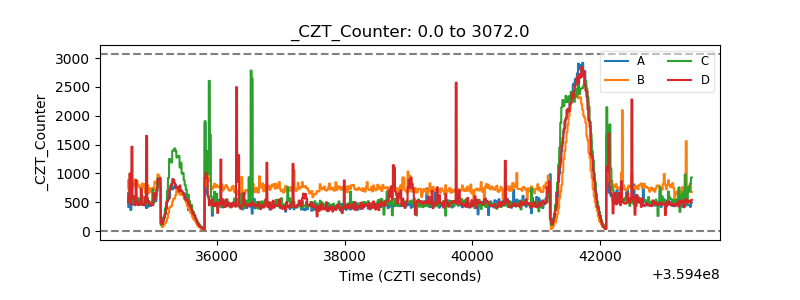 |
| +2.5 Volts monitor |  |
| +5 Volts monitor |  |
| _ROLL_ROT | 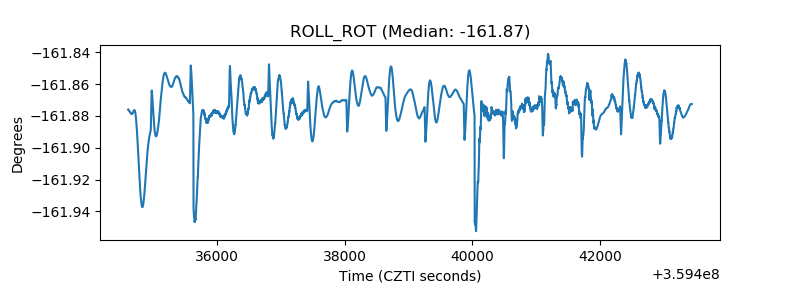 |
| _Roll_DEC | 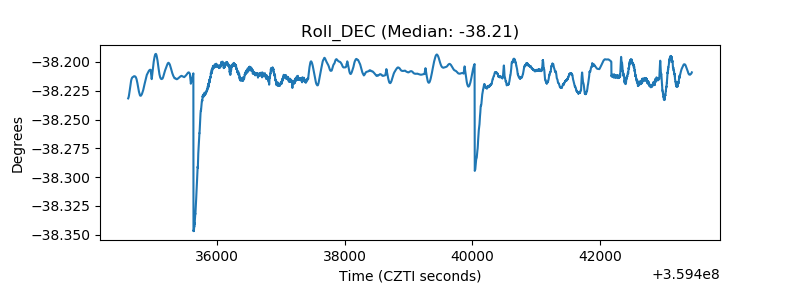 |
| _Roll_RA | 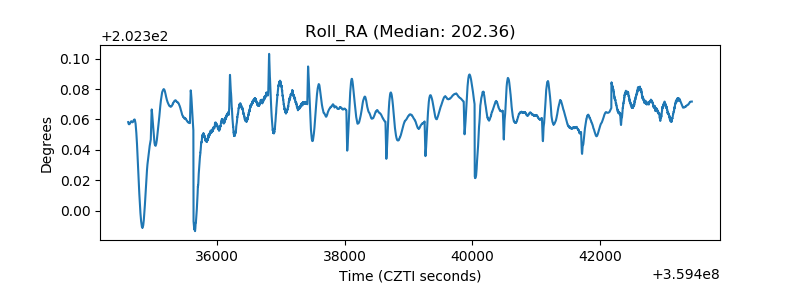 |
| Veto Counter | 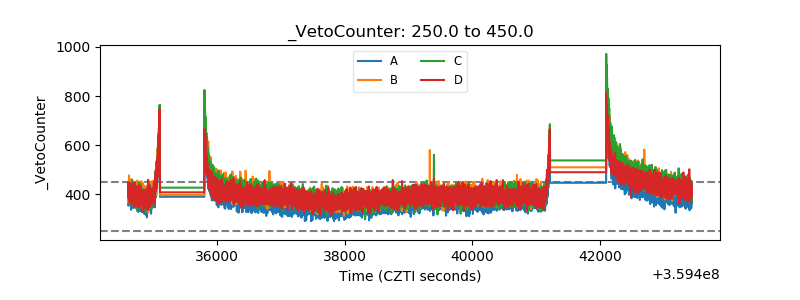 |