| Param | Original file | Final file |
|---|---|---|
| Filename | modeM0/AS1A10_055T01_9000004400_30555cztM0_level2.evt | modeM0/AS1A10_055T01_9000004400_30555cztM0_level2_quad_clean.evt |
| Size (bytes) | 571,772,160 | 84,432,960 |
| Size | 545.3 MB | 80.5 MB |
| Events in quadrant A | 4,149,030 | 528,683 |
| Events in quadrant B | 5,191,548 | 545,006 |
| Events in quadrant C | 3,817,295 | 523,238 |
| Events in quadrant D | 3,731,931 | 520,072 |
| Mode SS | |||
|---|---|---|---|
| Quadrant | BADHDUFLAG | Total packets | Discarded packets |
| A | 0 | 130 | 0 |
| B | 0 | 130 | 0 |
| C | 0 | 130 | 0 |
| D | 0 | 130 | 0 |
| Mode M0 | |||
|---|---|---|---|
| Quadrant | BADHDUFLAG | Total packets | Discarded packets |
| A | 0 | 16444 | 2 |
| B | 0 | 19658 | 2 |
| C | 0 | 15518 | 2 |
| D | 0 | 15193 | 2 |
| Mode M9 | |||
|---|---|---|---|
| Quadrant | BADHDUFLAG | Total packets | Discarded packets |
| A | 0 | 19 | 0 |
| B | 0 | 20 | 0 |
| C | 0 | 20 | 0 |
| D | 0 | 20 | 0 |
| Quadrant | Total seconds | Saturated seconds | Saturation percentage |
|---|---|---|---|
| A | 6294 | 273 | 4.337464% |
| B | 6294 | 149 | 2.367334% |
| C | 6294 | 333 | 5.290753% |
| D | 6294 | 42 | 0.667302% |
Noise dominated data is calculated using 1-second bins in cleaned event files. If a bin has >2000 counts, and if more than 50% of those come from <1% of pixels, then it is considered to be noise-dominated and hence unusable.
| Quadrant | # 1 sec bins | Bins with >0 counts | Bins with >2000 counts | High rate bins dominated by noise | Noise dominated (total time) | Noise dominated (detector-on time) | Marked lightcurve |
|---|---|---|---|---|---|---|---|
| A | 7569 | 6295 | 165 | 165 | 2.18% | 2.62% | 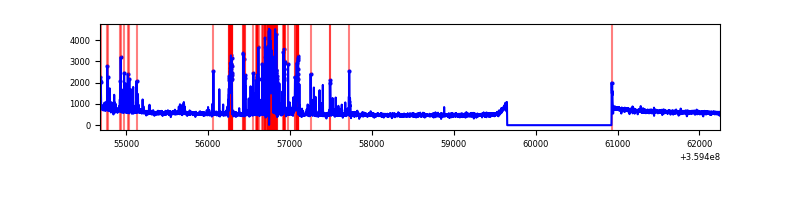 |
| B | 7569 | 6295 | 11 | 11 | 0.15% | 0.17% | 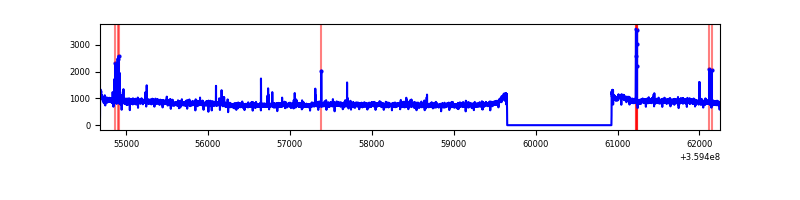 |
| C | 7569 | 6295 | 72 | 72 | 0.95% | 1.14% | 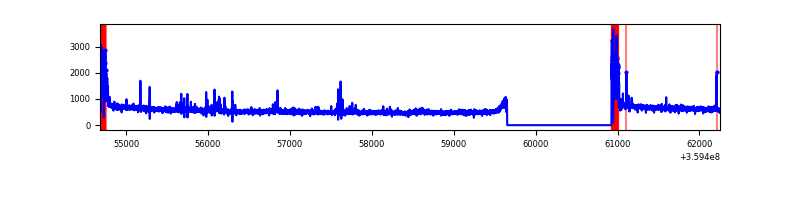 |
| D | 7569 | 6295 | 7 | 7 | 0.09% | 0.11% | 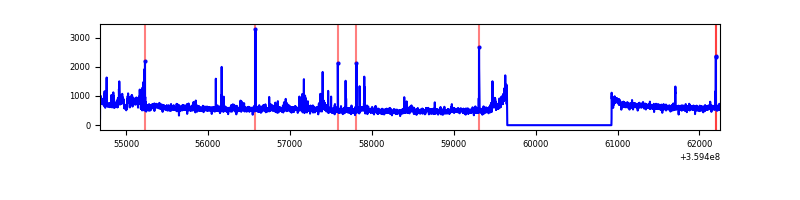 |
Top three noisy pixels from each quadrant. If the there are fewer than three noisy pixels in the level2.evt file, extra rows are filled as -1
| Pixel properties | Quadrant properties | ||||||
|---|---|---|---|---|---|---|---|
| Quadrant | DetID | PixID | Counts | Sigma | Mean | Median | Sigma |
| A | 0 | 13 | 726729 | 4220.53 | 881 | 868 | 172.0 |
| A | 8 | 192 | 25510 | 143.28 | 881 | 868 | 172.0 |
| A | 13 | 254 | 10305 | 54.87 | 881 | 868 | 172.0 |
| B | 6 | 159 | 1669615 | 10336.13 | 879 | 862 | 161.4 |
| B | 4 | 171 | 52994 | 322.9 | 879 | 862 | 161.4 |
| B | 12 | 111 | 19037 | 112.57 | 879 | 862 | 161.4 |
| C | 0 | 10 | 285564 | 1496.91 | 837 | 845 | 190.2 |
| C | 14 | 238 | 163747 | 856.46 | 837 | 845 | 190.2 |
| C | 3 | 233 | 51015 | 263.77 | 837 | 845 | 190.2 |
| D | 1 | 52 | 176441 | 867.39 | 869 | 850 | 202.4 |
| D | 8 | 195 | 156448 | 768.63 | 869 | 850 | 202.4 |
| D | 2 | 250 | 47071 | 228.32 | 869 | 850 | 202.4 |
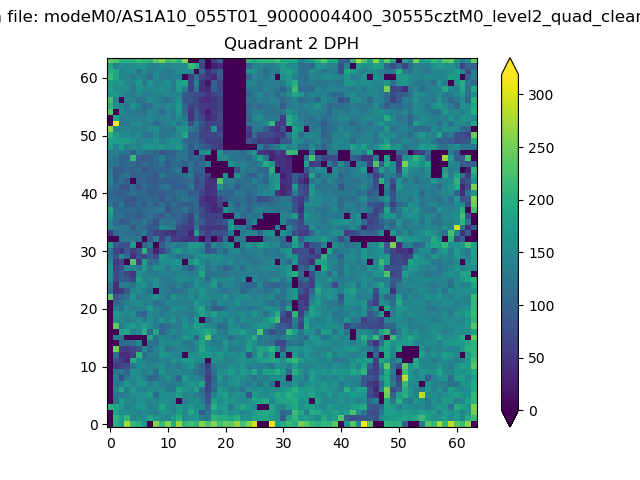
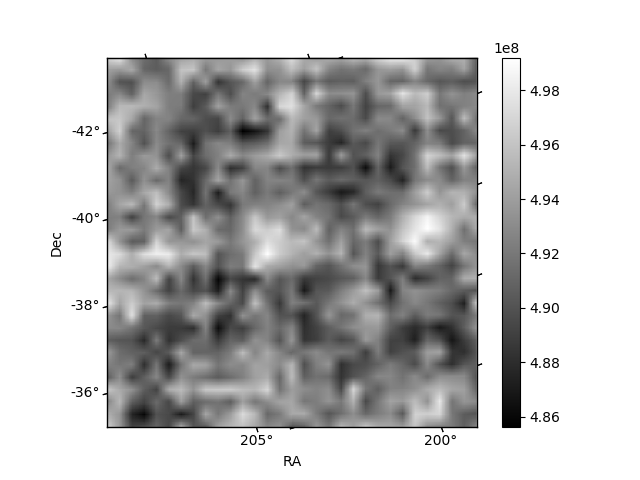
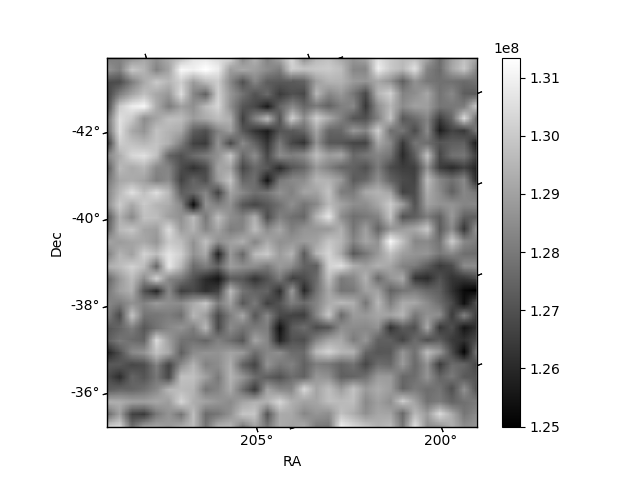
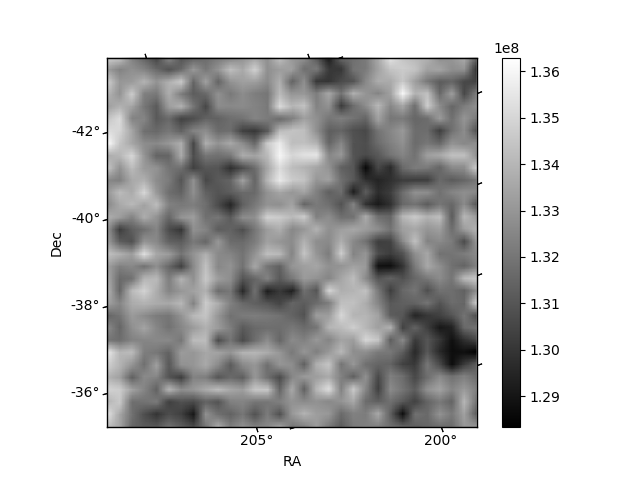
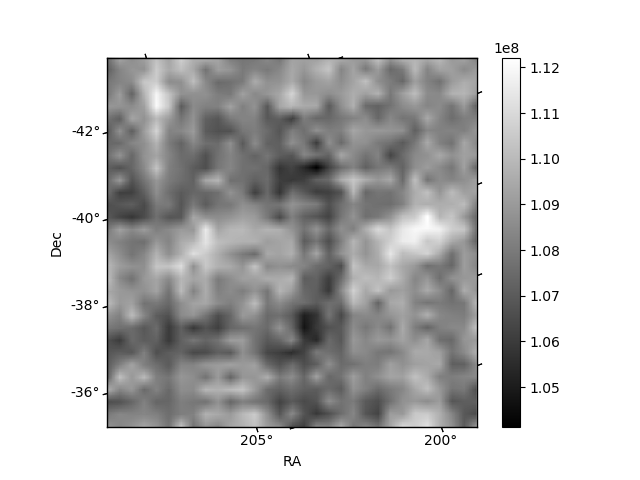
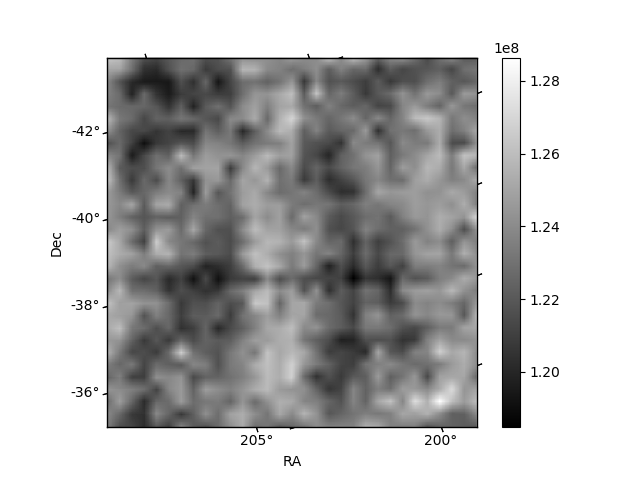
Histogram calculated using DETX and DETY for each event in the final _common_clean file
| Quadrant A | 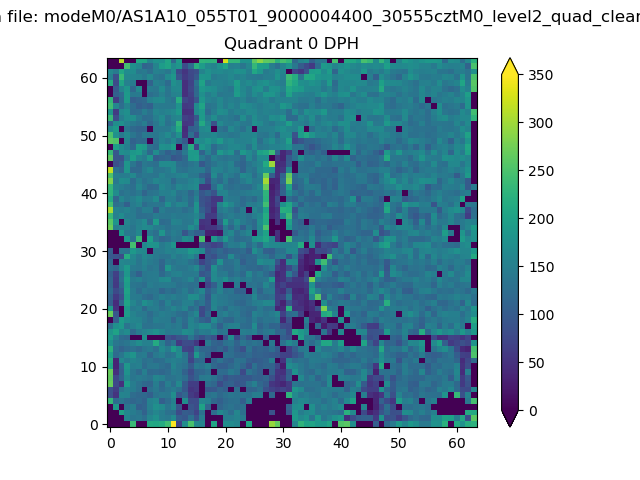 |
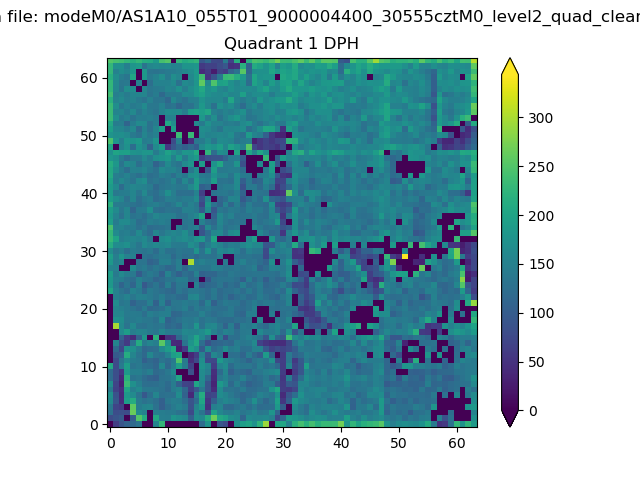 |
Quadrant B |
|---|---|---|---|
| Quadrant D | 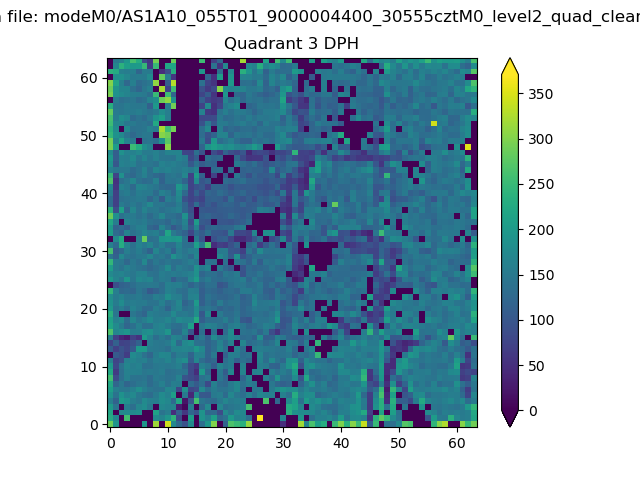 |
 |
Quadrant C |
| Plot type | Count rate plots | Images |
|---|---|---|
| Comparison with Poisson distribution Blue bars denote a histogram of data divided into 1 sec bins. Red curve is a Poisson curve with rate = median count rate of data. |
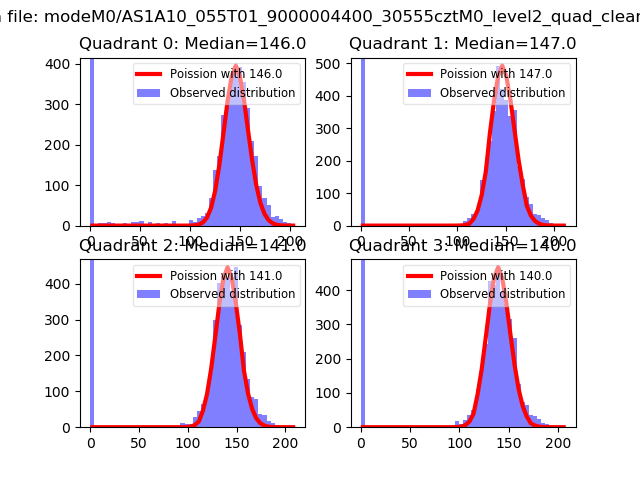 |
 |
| Quadrant-wise count rates Data is divided into 100 sec bins |
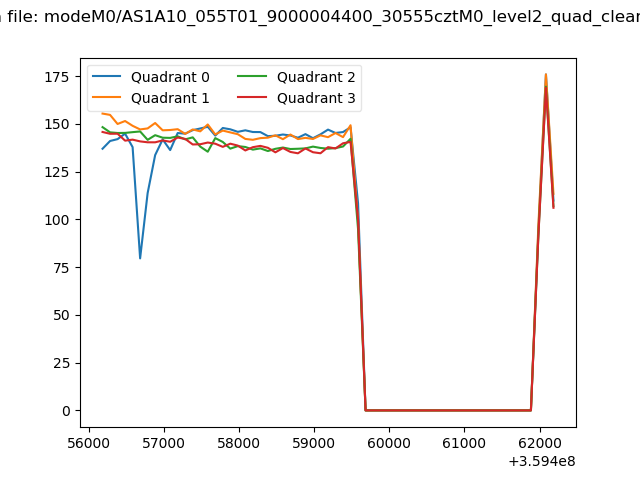 |
|
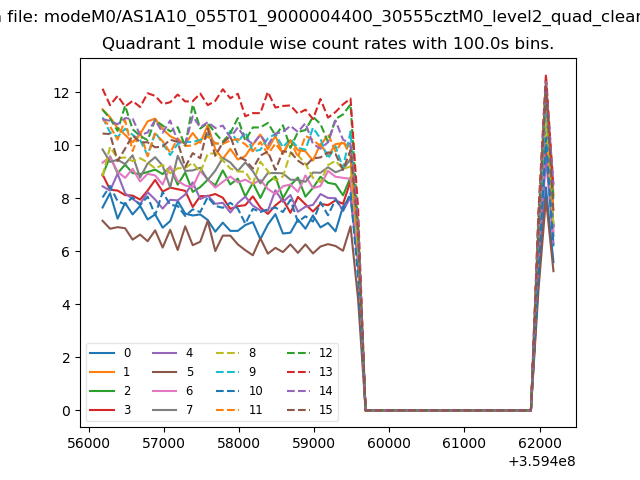
| Module-wise count rates for Quadrant A Data is divided into 100 sec bins |
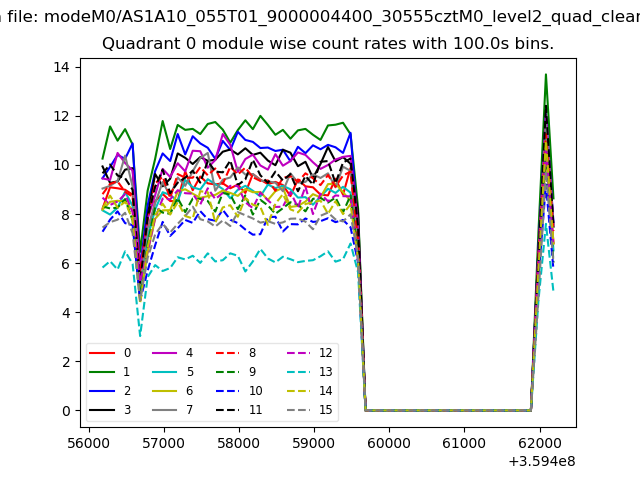 |
 |
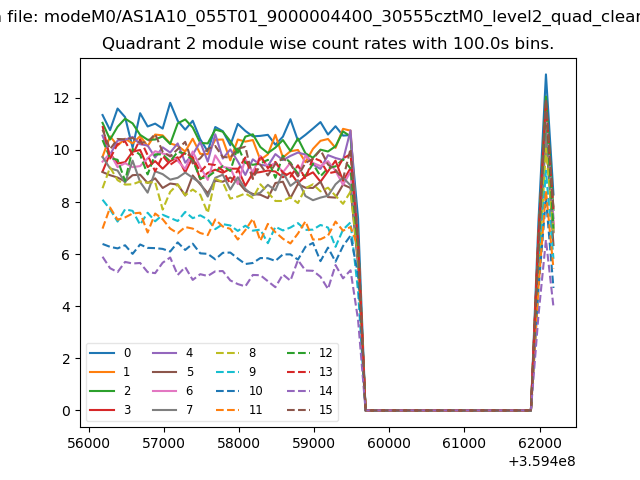
| Module-wise count rates for Quadrant B Data is divided into 100 sec bins |
 |
 |
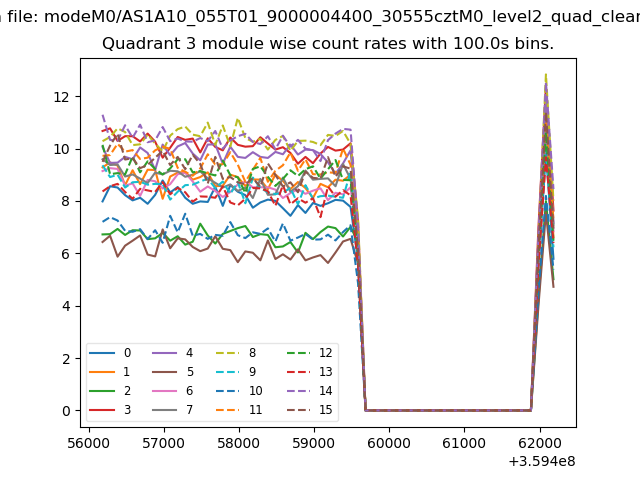
| Module-wise count rates for Quadrant C Data is divided into 100 sec bins |
 |
 |
| Module-wise count rates for Quadrant D Data is divided into 100 sec bins |
 |
 |
| Parameter | Plot |
|---|---|
| CZT HV Monitor | 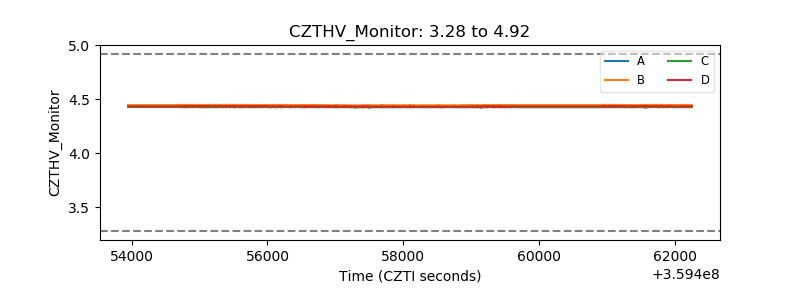 |
| D_VDD | 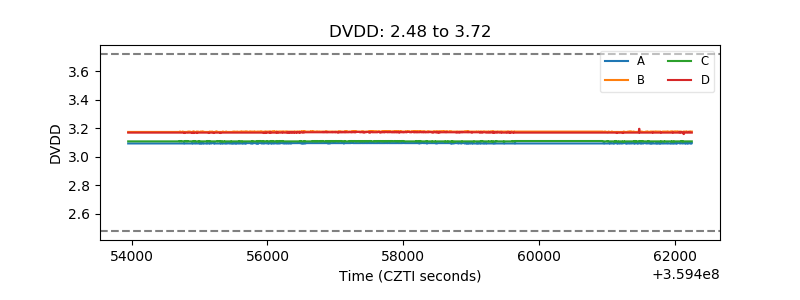 |
| Temperature 1 |  |
| Veto HV Monitor | 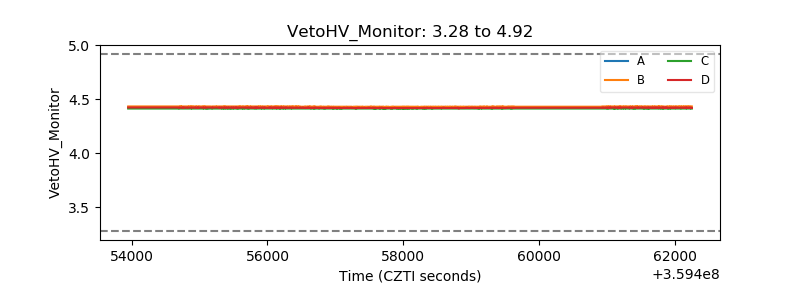 |
| Veto LLD | 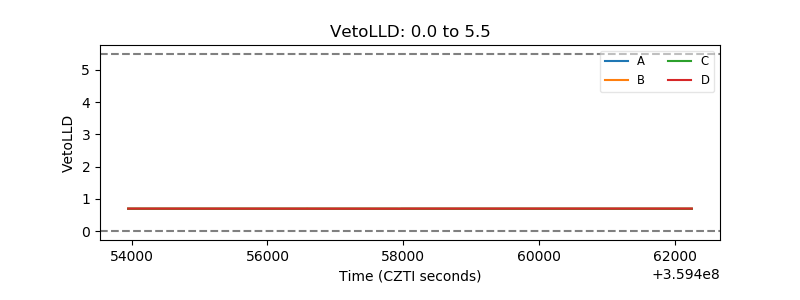 |
| Alpha Counter | 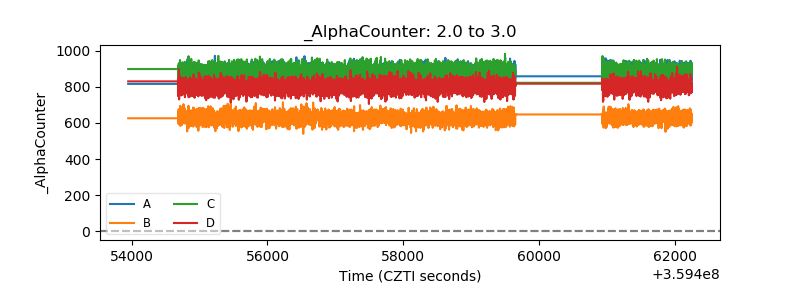 |
| _CPM_Rate | 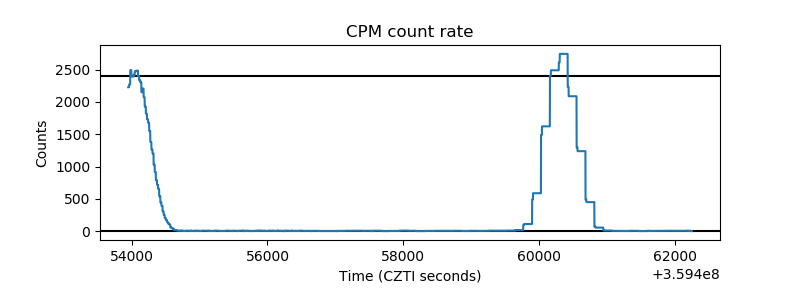 |
| CZT Counter | 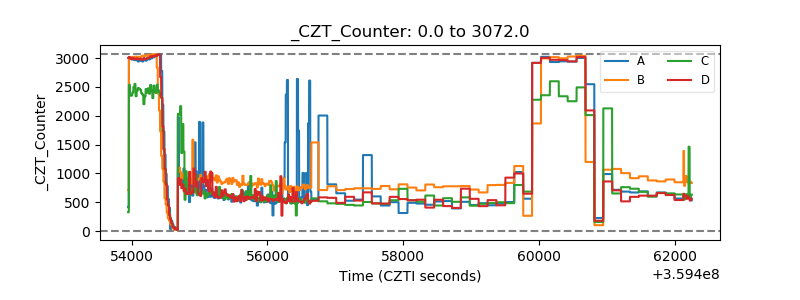 |
| +2.5 Volts monitor |  |
| +5 Volts monitor |  |
| _ROLL_ROT | 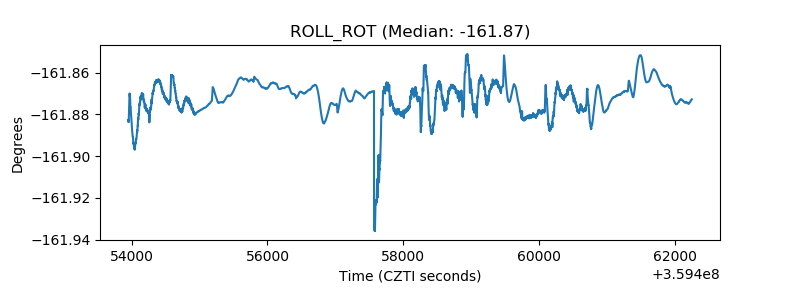 |
| _Roll_DEC | 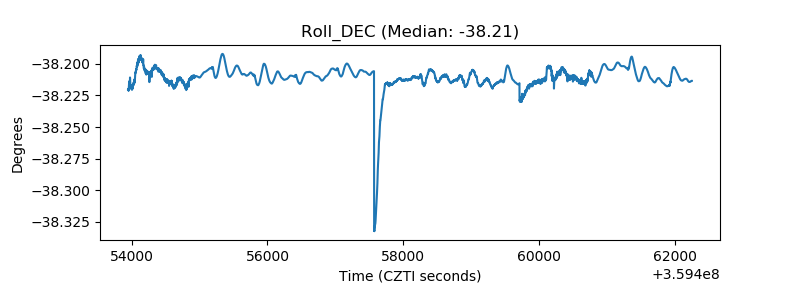 |
| _Roll_RA | 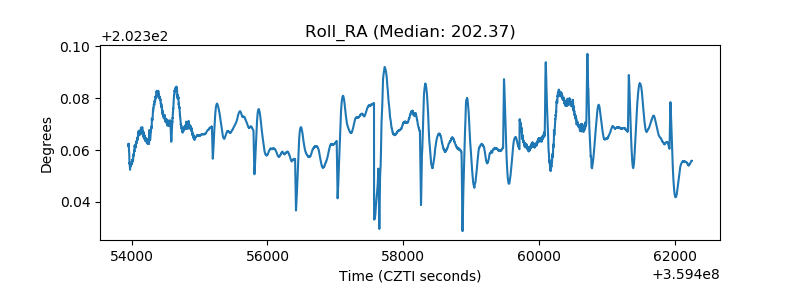 |
| Veto Counter | 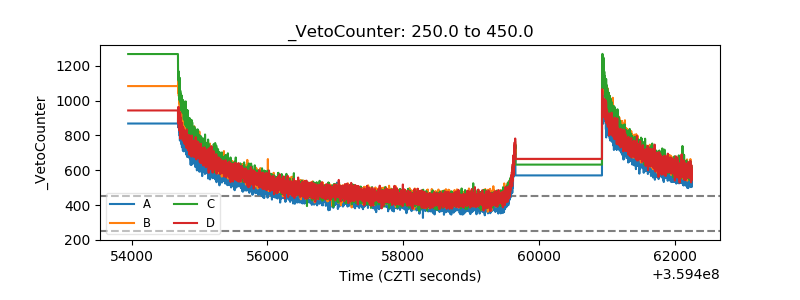 |