| Param | Original file | Final file |
|---|---|---|
| Filename | modeM0/AS1A10_055T01_9000004400_30556cztM0_level2.evt | modeM0/AS1A10_055T01_9000004400_30556cztM0_level2_quad_clean.evt |
| Size (bytes) | 568,774,080 | 104,376,960 |
| Size | 542.4 MB | 99.5 MB |
| Events in quadrant A | 3,567,656 | 705,339 |
| Events in quadrant B | 5,342,508 | 695,271 |
| Events in quadrant C | 3,899,142 | 667,609 |
| Events in quadrant D | 3,996,046 | 659,563 |
| Mode SS | |||
|---|---|---|---|
| Quadrant | BADHDUFLAG | Total packets | Discarded packets |
| A | 0 | 126 | 0 |
| B | 0 | 126 | 0 |
| C | 0 | 126 | 0 |
| D | 0 | 126 | 0 |
| Mode M0 | |||
|---|---|---|---|
| Quadrant | BADHDUFLAG | Total packets | Discarded packets |
| A | 0 | 14677 | 2 |
| B | 0 | 20057 | 2 |
| C | 0 | 15751 | 2 |
| D | 0 | 16274 | 2 |
| Mode M9 | |||
|---|---|---|---|
| Quadrant | BADHDUFLAG | Total packets | Discarded packets |
| A | 0 | 21 | 0 |
| B | 0 | 22 | 0 |
| C | 0 | 22 | 0 |
| D | 0 | 22 | 0 |
| Quadrant | Total seconds | Saturated seconds | Saturation percentage |
|---|---|---|---|
| A | 6210 | 98 | 1.578100% |
| B | 6210 | 203 | 3.268921% |
| C | 6210 | 315 | 5.072464% |
| D | 6210 | 90 | 1.449275% |
Noise dominated data is calculated using 1-second bins in cleaned event files. If a bin has >2000 counts, and if more than 50% of those come from <1% of pixels, then it is considered to be noise-dominated and hence unusable.
| Quadrant | # 1 sec bins | Bins with >0 counts | Bins with >2000 counts | High rate bins dominated by noise | Noise dominated (total time) | Noise dominated (detector-on time) | Marked lightcurve |
|---|---|---|---|---|---|---|---|
| A | 7525 | 6211 | 1 | 1 | 0.01% | 0.02% | 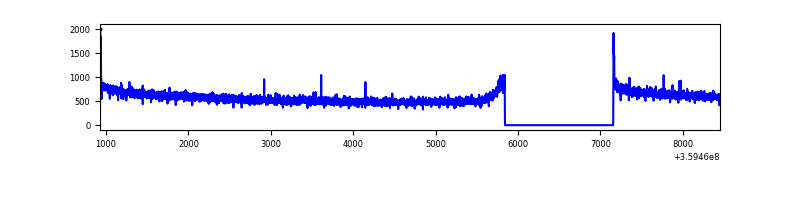 |
| B | 7525 | 6211 | 17 | 17 | 0.23% | 0.27% | 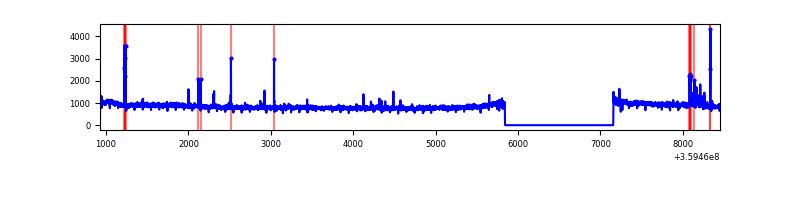 |
| C | 7525 | 6211 | 82 | 82 | 1.09% | 1.32% | 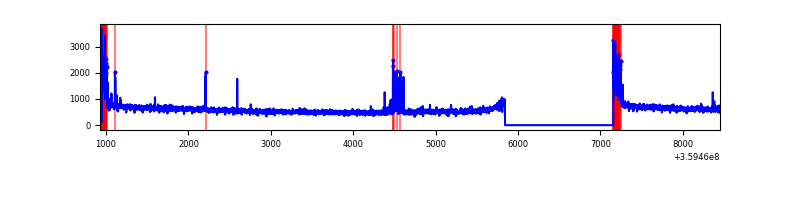 |
| D | 7525 | 6211 | 19 | 19 | 0.25% | 0.31% | 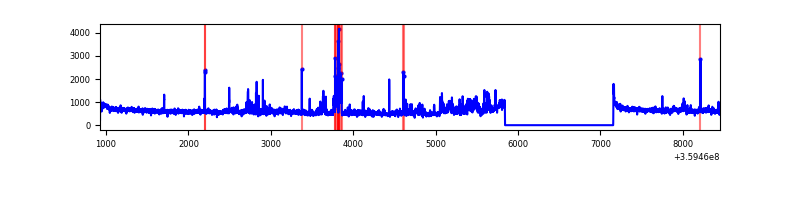 |
Top three noisy pixels from each quadrant. If the there are fewer than three noisy pixels in the level2.evt file, extra rows are filled as -1
| Pixel properties | Quadrant properties | ||||||
|---|---|---|---|---|---|---|---|
| Quadrant | DetID | PixID | Counts | Sigma | Mean | Median | Sigma |
| A | 8 | 192 | 23647 | 126.46 | 919 | 905 | 179.8 |
| A | 13 | 254 | 10542 | 53.59 | 919 | 905 | 179.8 |
| A | 3 | 137 | 8077 | 39.88 | 919 | 905 | 179.8 |
| B | 6 | 159 | 1693286 | 10199.62 | 897 | 882 | 165.9 |
| B | 6 | 36 | 55439 | 328.8 | 897 | 882 | 165.9 |
| B | 4 | 171 | 44919 | 265.4 | 897 | 882 | 165.9 |
| C | 0 | 10 | 282624 | 1453.68 | 852 | 861 | 193.8 |
| C | 14 | 238 | 141234 | 724.22 | 852 | 861 | 193.8 |
| C | 3 | 233 | 122649 | 628.33 | 852 | 861 | 193.8 |
| D | 12 | 227 | 197851 | 958.18 | 889 | 870 | 205.6 |
| D | 8 | 195 | 165808 | 802.32 | 889 | 870 | 205.6 |
| D | 13 | 249 | 112531 | 543.16 | 889 | 870 | 205.6 |
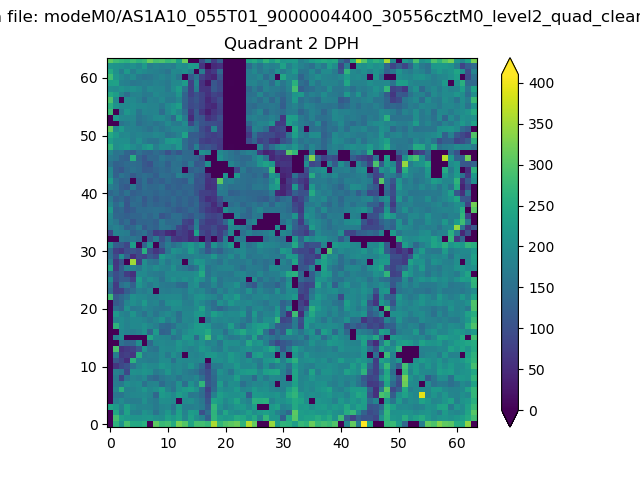
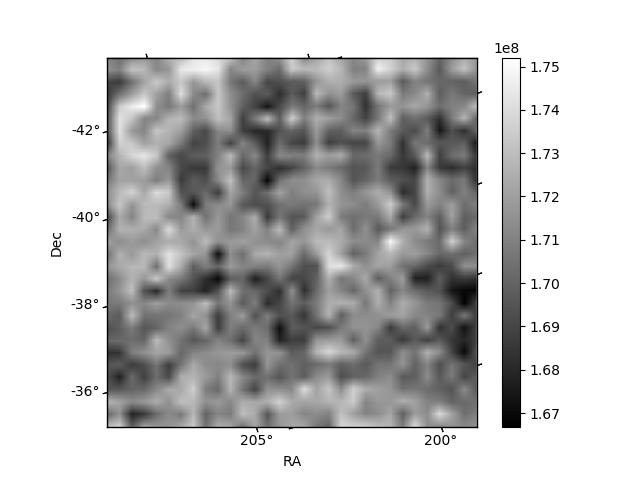
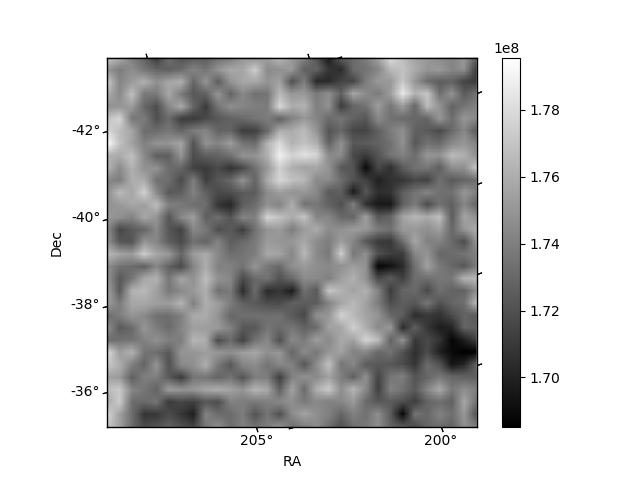
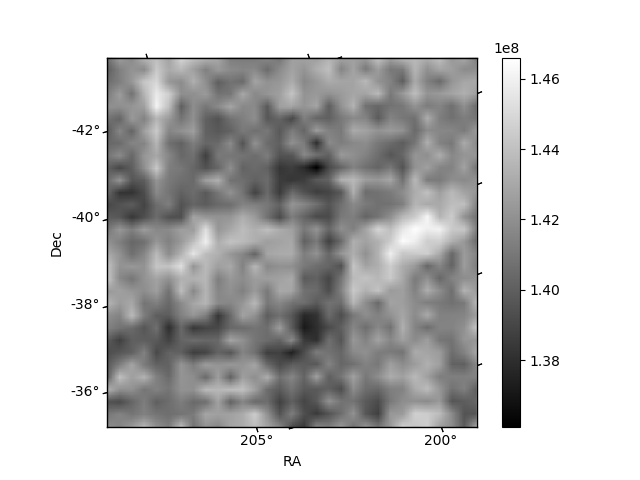
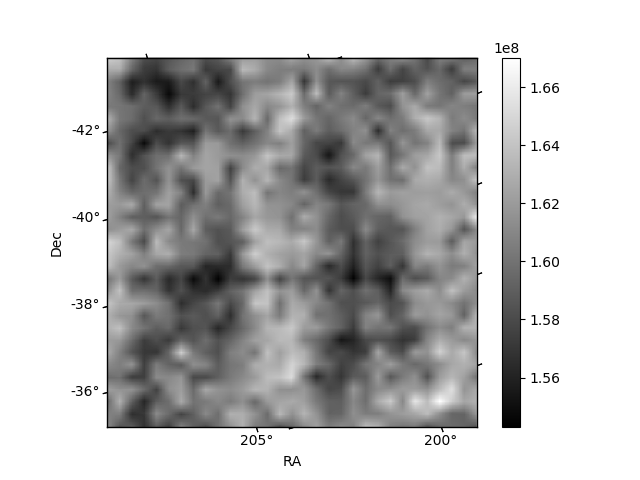
Histogram calculated using DETX and DETY for each event in the final _common_clean file
| Quadrant A | 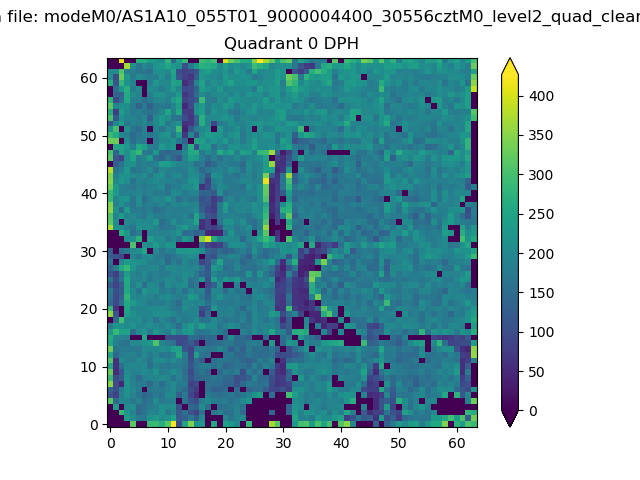 |
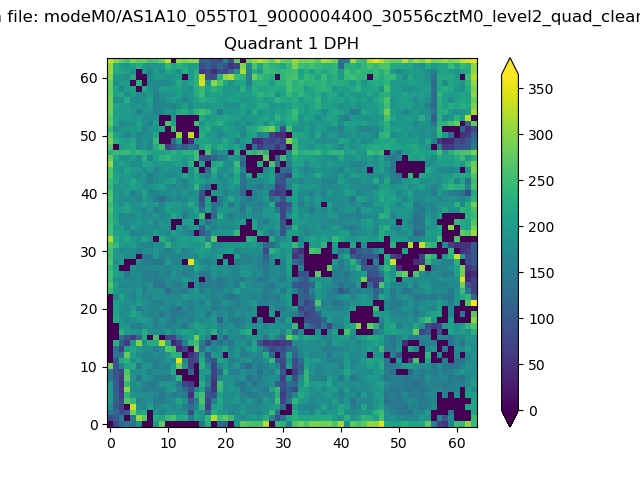 |
Quadrant B |
|---|---|---|---|
| Quadrant D | 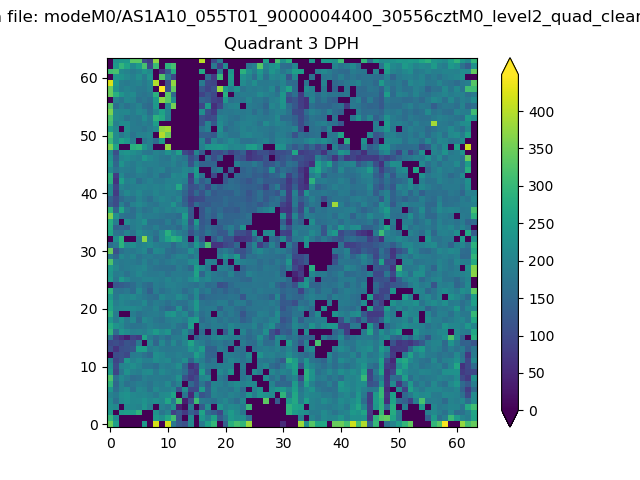 |
 |
Quadrant C |
| Plot type | Count rate plots | Images |
|---|---|---|
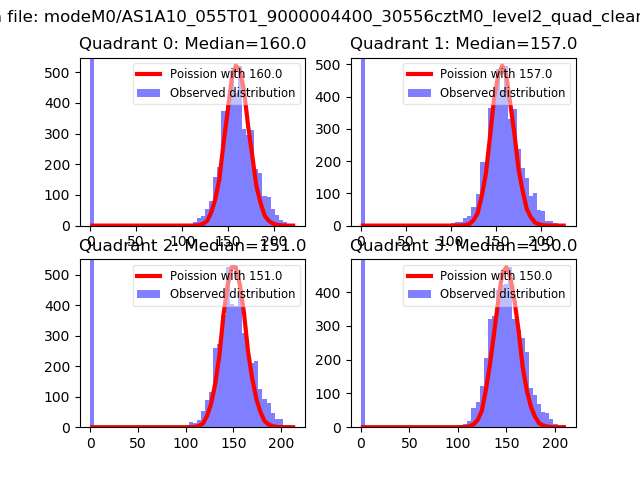
| Comparison with Poisson distribution Blue bars denote a histogram of data divided into 1 sec bins. Red curve is a Poisson curve with rate = median count rate of data. |
 |
 |
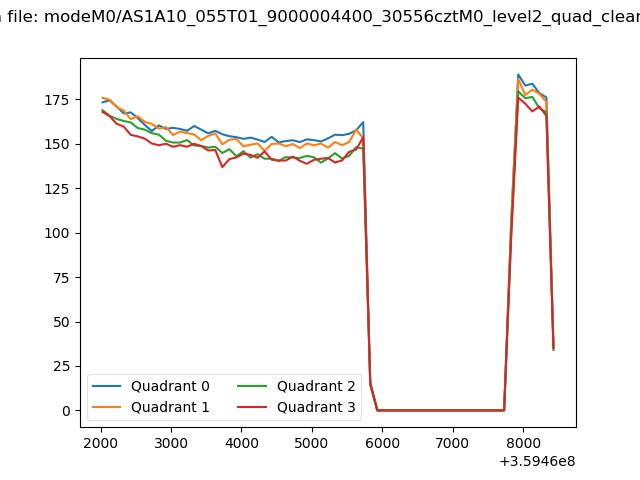
| Quadrant-wise count rates Data is divided into 100 sec bins |
 |
|
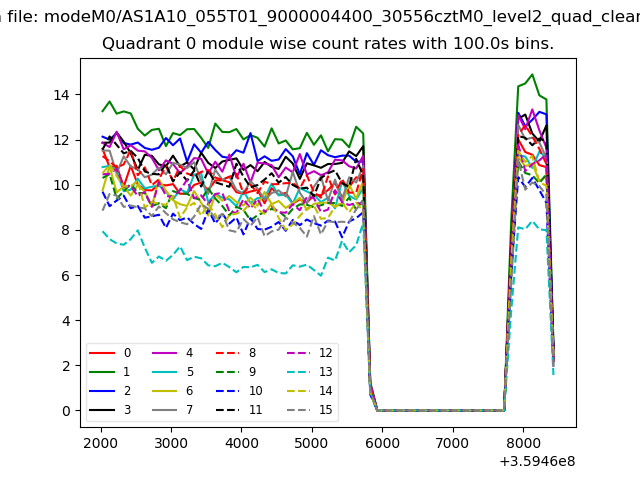
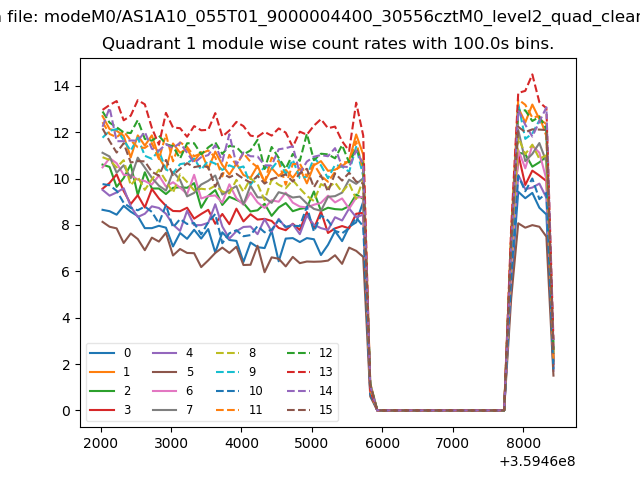
| Module-wise count rates for Quadrant A Data is divided into 100 sec bins |
 |
 |
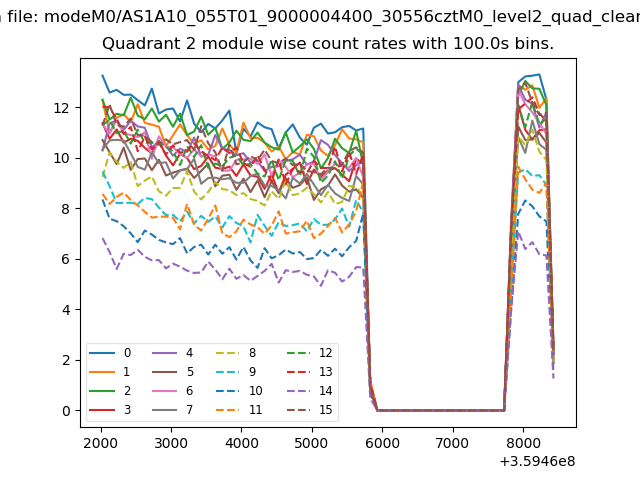
| Module-wise count rates for Quadrant B Data is divided into 100 sec bins |
 |
 |
| Module-wise count rates for Quadrant C Data is divided into 100 sec bins |
 |
 |
| Module-wise count rates for Quadrant D Data is divided into 100 sec bins |
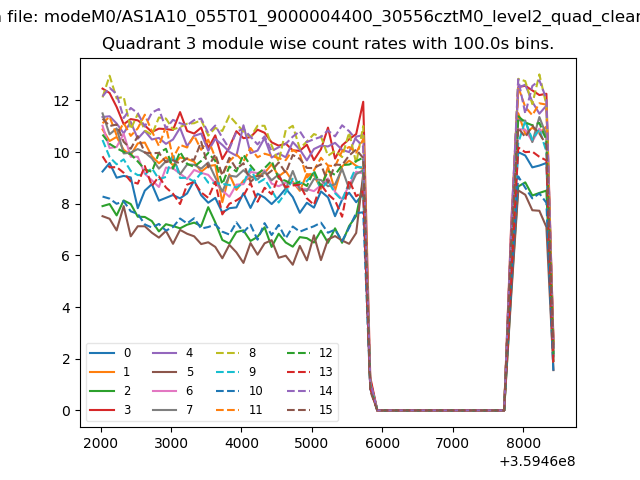 |
 |
| Parameter | Plot |
|---|---|
| CZT HV Monitor | 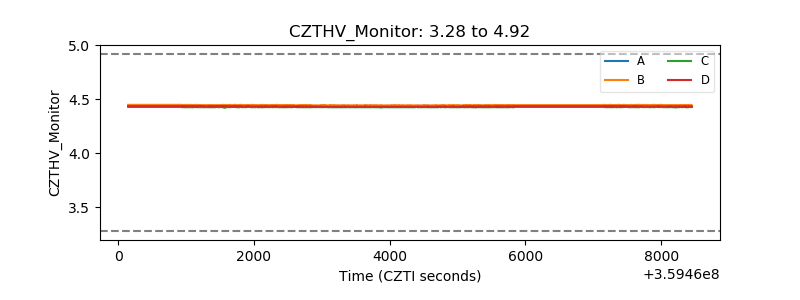 |
| D_VDD | 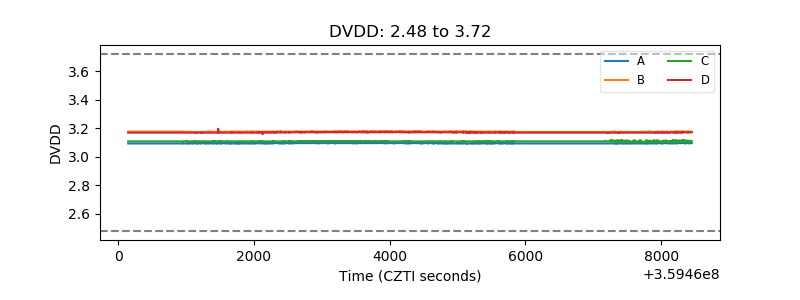 |
| Temperature 1 | 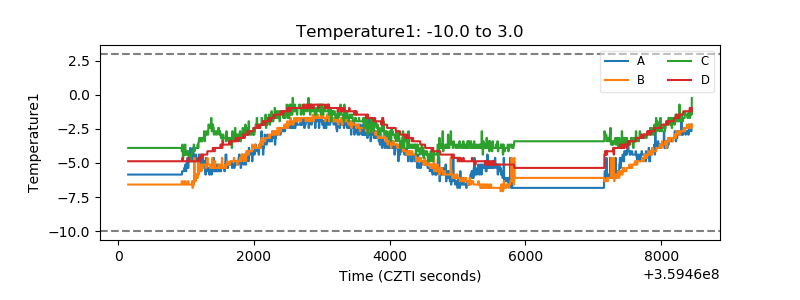 |
| Veto HV Monitor | 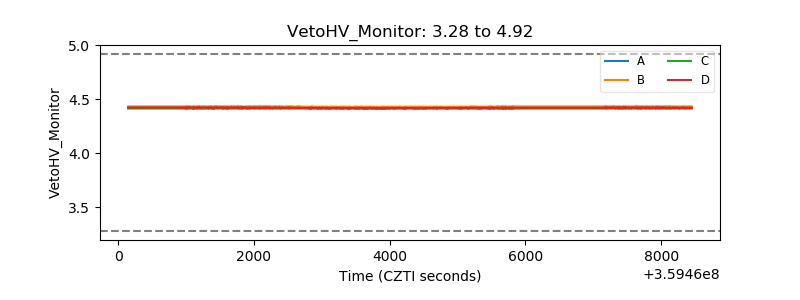 |
| Veto LLD | 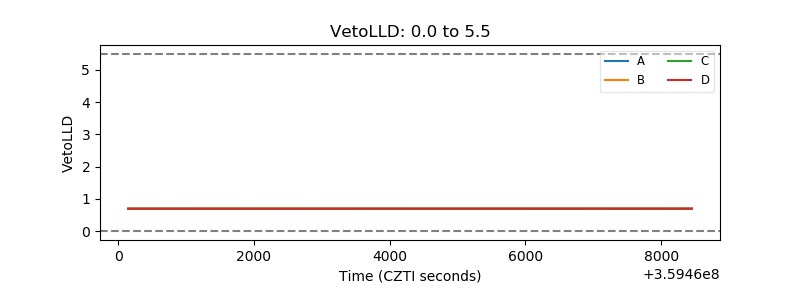 |
| Alpha Counter | 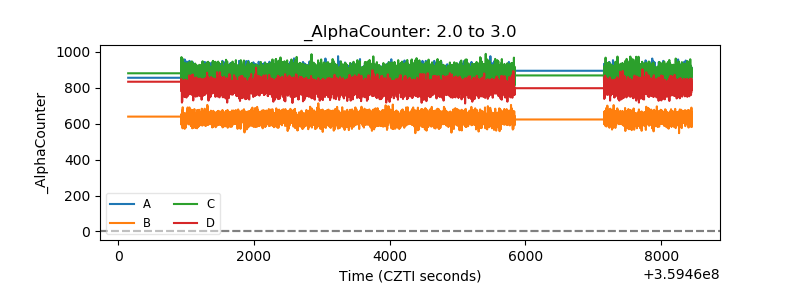 |
| _CPM_Rate | 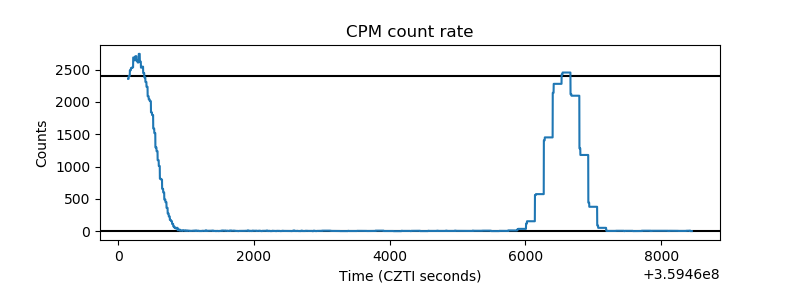 |
| CZT Counter | 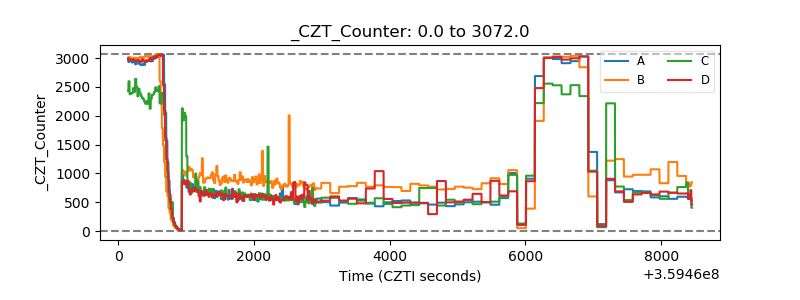 |
| +2.5 Volts monitor | 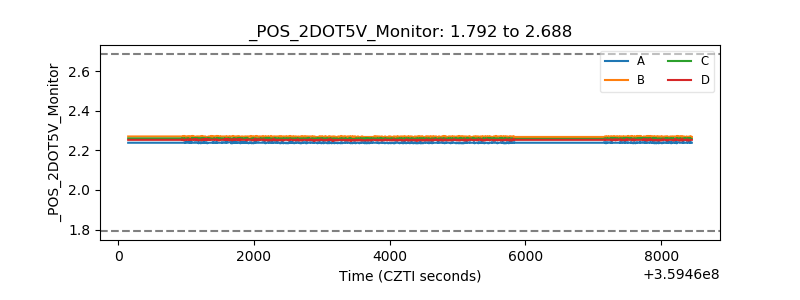 |
| +5 Volts monitor | 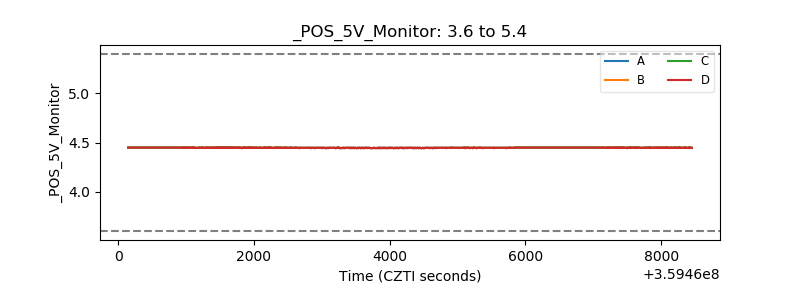 |
| _ROLL_ROT |  |
| _Roll_DEC | 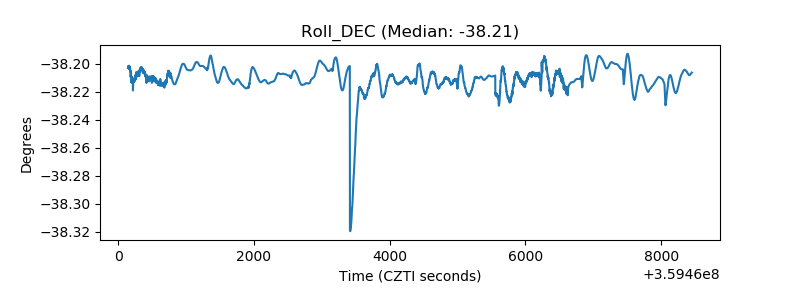 |
| _Roll_RA | 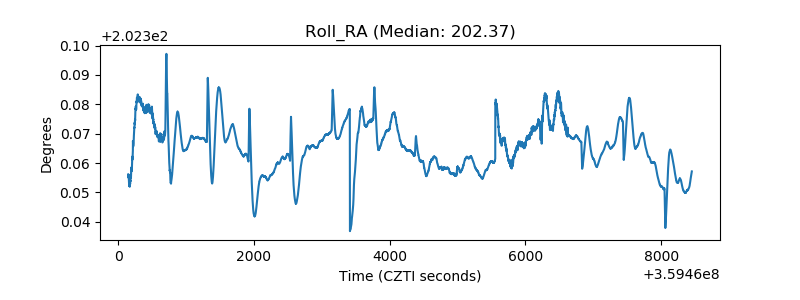 |
| Veto Counter | 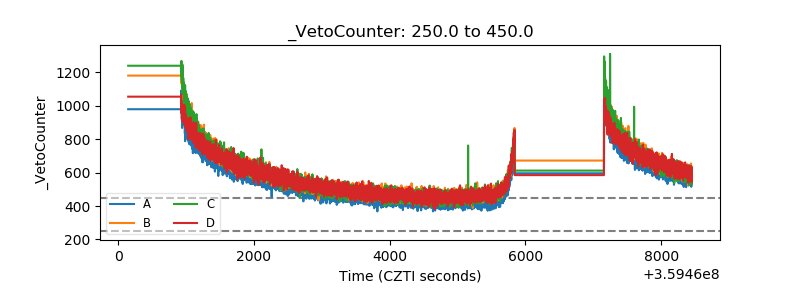 |