| Param | Original file | Final file |
|---|---|---|
| Filename | modeM0/AS1A10_055T01_9000004400_30557cztM0_level2.evt | modeM0/AS1A10_055T01_9000004400_30557cztM0_level2_quad_clean.evt |
| Size (bytes) | 607,726,080 | 115,908,480 |
| Size | 579.6 MB | 110.5 MB |
| Events in quadrant A | 3,567,771 | 799,336 |
| Events in quadrant B | 5,436,819 | 789,735 |
| Events in quadrant C | 3,894,797 | 750,707 |
| Events in quadrant D | 5,081,074 | 732,167 |
| Mode SS | |||
|---|---|---|---|
| Quadrant | BADHDUFLAG | Total packets | Discarded packets |
| A | 0 | 128 | 0 |
| B | 0 | 128 | 0 |
| C | 0 | 128 | 0 |
| D | 0 | 128 | 0 |
| Mode M0 | |||
|---|---|---|---|
| Quadrant | BADHDUFLAG | Total packets | Discarded packets |
| A | 0 | 14696 | 3 |
| B | 0 | 20409 | 2 |
| C | 0 | 15675 | 2 |
| D | 0 | 19724 | 2 |
| Mode M9 | |||
|---|---|---|---|
| Quadrant | BADHDUFLAG | Total packets | Discarded packets |
| A | 0 | 13 | 0 |
| B | 0 | 14 | 0 |
| C | 0 | 14 | 0 |
| D | 0 | 14 | 0 |
| Quadrant | Total seconds | Saturated seconds | Saturation percentage |
|---|---|---|---|
| A | 6282 | 123 | 1.957975% |
| B | 6282 | 254 | 4.043298% |
| C | 6282 | 331 | 5.269023% |
| D | 6282 | 264 | 4.202483% |
Noise dominated data is calculated using 1-second bins in cleaned event files. If a bin has >2000 counts, and if more than 50% of those come from <1% of pixels, then it is considered to be noise-dominated and hence unusable.
| Quadrant | # 1 sec bins | Bins with >0 counts | Bins with >2000 counts | High rate bins dominated by noise | Noise dominated (total time) | Noise dominated (detector-on time) | Marked lightcurve |
|---|---|---|---|---|---|---|---|
| A | 7602 | 6283 | 0 | 0 | 0.00% | 0.00% | 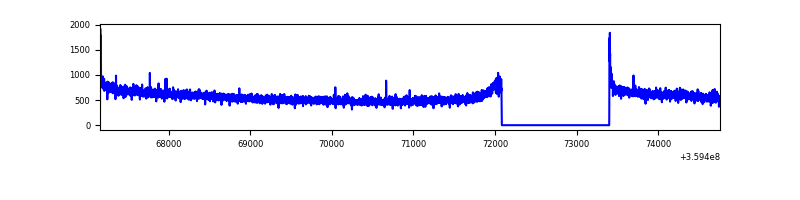 |
| B | 7602 | 6283 | 17 | 17 | 0.22% | 0.27% | 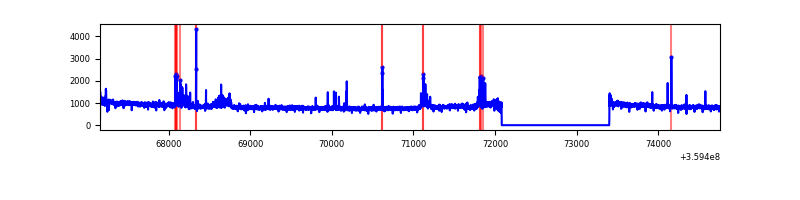 |
| C | 7602 | 6283 | 91 | 91 | 1.20% | 1.45% | 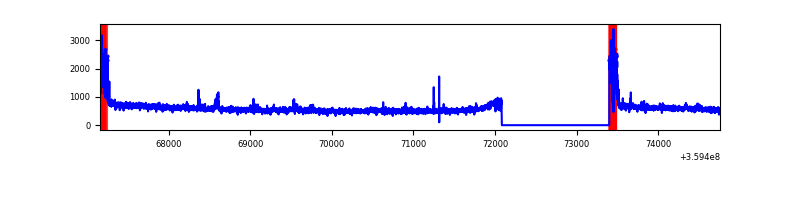 |
| D | 7602 | 6283 | 209 | 209 | 2.75% | 3.33% | 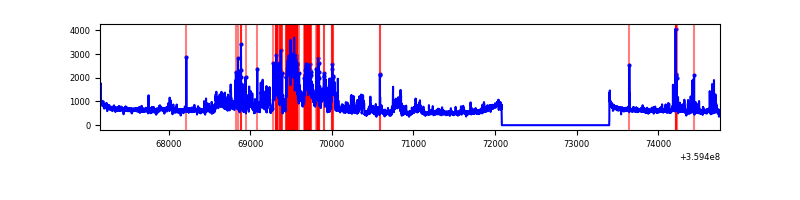 |
Top three noisy pixels from each quadrant. If the there are fewer than three noisy pixels in the level2.evt file, extra rows are filled as -1
| Pixel properties | Quadrant properties | ||||||
|---|---|---|---|---|---|---|---|
| Quadrant | DetID | PixID | Counts | Sigma | Mean | Median | Sigma |
| A | 8 | 192 | 22777 | 121.4 | 920 | 907 | 180.1 |
| A | 13 | 254 | 10889 | 55.41 | 920 | 907 | 180.1 |
| A | 3 | 137 | 8252 | 40.77 | 920 | 907 | 180.1 |
| B | 6 | 159 | 1692080 | 10197.75 | 893 | 875 | 165.8 |
| B | 6 | 36 | 135088 | 809.29 | 893 | 875 | 165.8 |
| B | 3 | 112 | 44747 | 264.54 | 893 | 875 | 165.8 |
| C | 0 | 10 | 320131 | 1656.43 | 845 | 854 | 192.8 |
| C | 14 | 238 | 139335 | 718.45 | 845 | 854 | 192.8 |
| C | 3 | 233 | 116232 | 598.59 | 845 | 854 | 192.8 |
| D | 12 | 227 | 1417849 | 6926.81 | 881 | 861 | 204.6 |
| D | 8 | 195 | 138340 | 672.05 | 881 | 861 | 204.6 |
| D | 1 | 52 | 93289 | 451.83 | 881 | 861 | 204.6 |
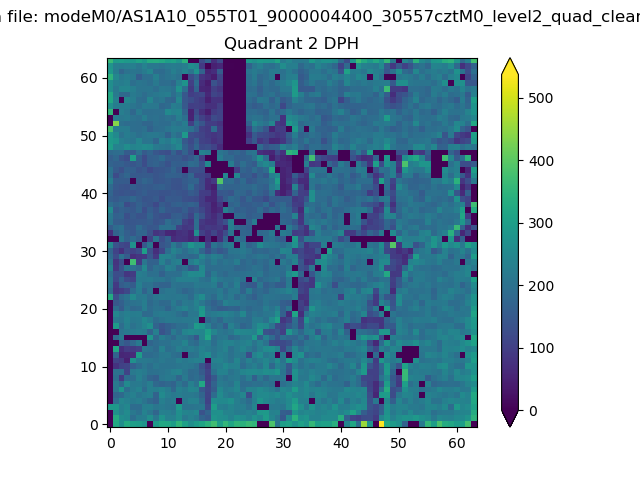
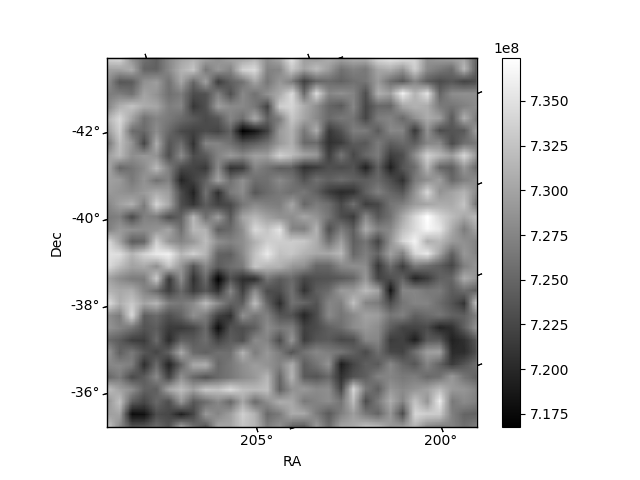
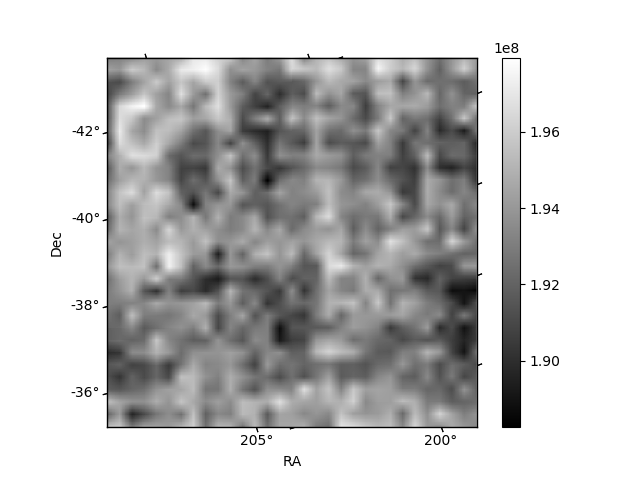
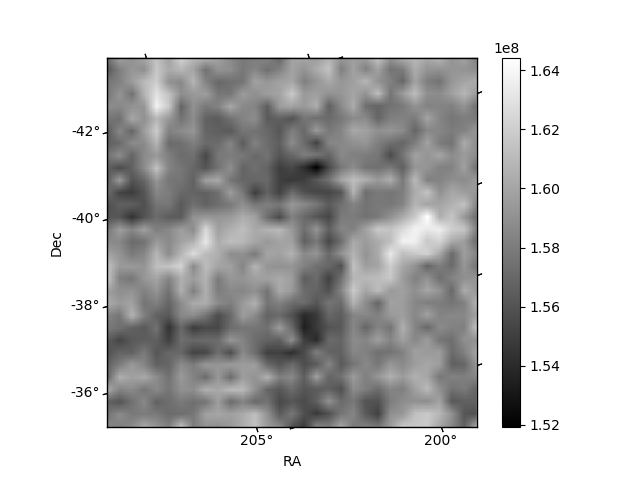
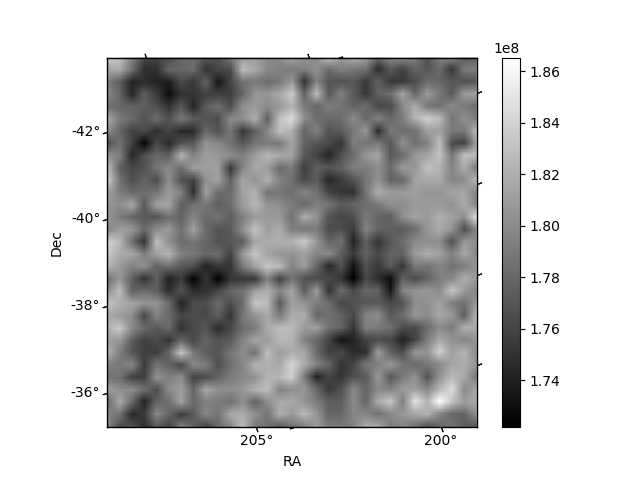
Histogram calculated using DETX and DETY for each event in the final _common_clean file
| Quadrant A | 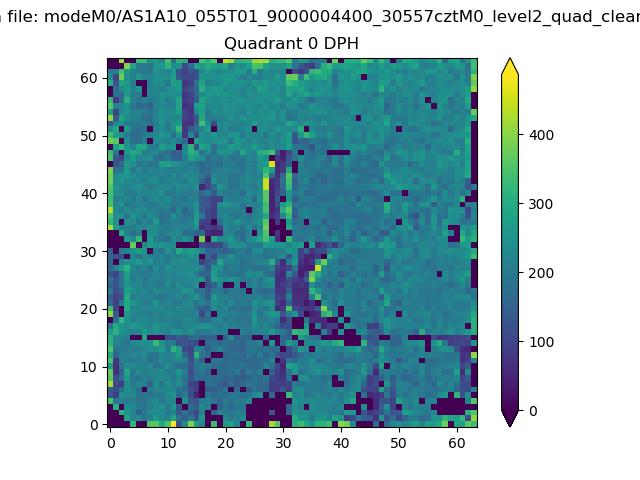 |
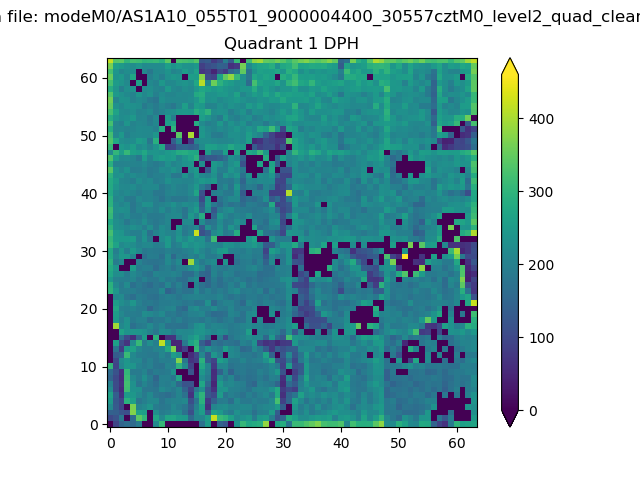 |
Quadrant B |
|---|---|---|---|
| Quadrant D | 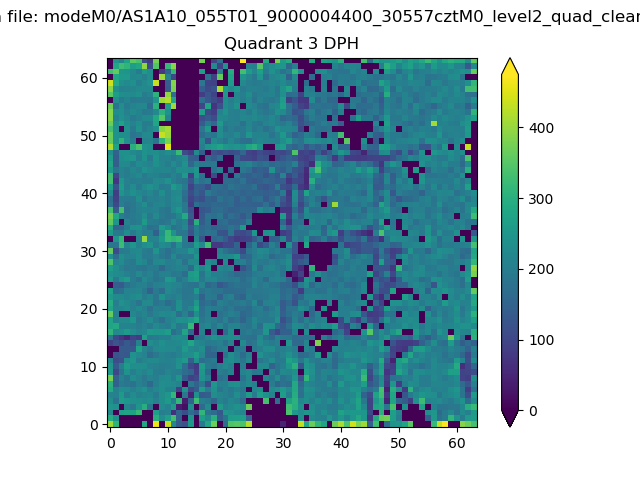 |
 |
Quadrant C |
| Plot type | Count rate plots | Images |
|---|---|---|
| Comparison with Poisson distribution Blue bars denote a histogram of data divided into 1 sec bins. Red curve is a Poisson curve with rate = median count rate of data. |
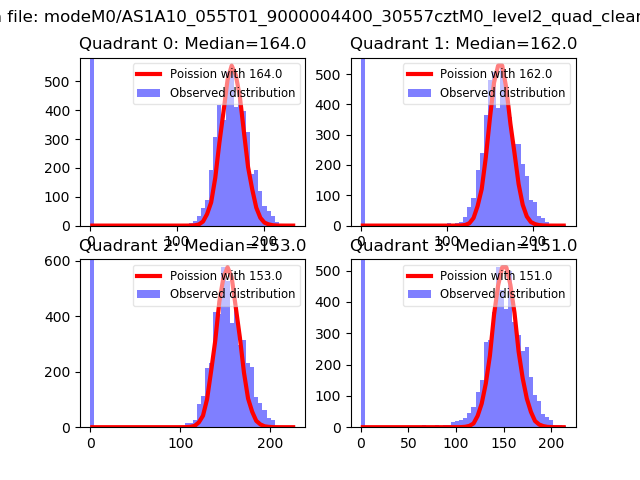 |
 |
| Quadrant-wise count rates Data is divided into 100 sec bins |
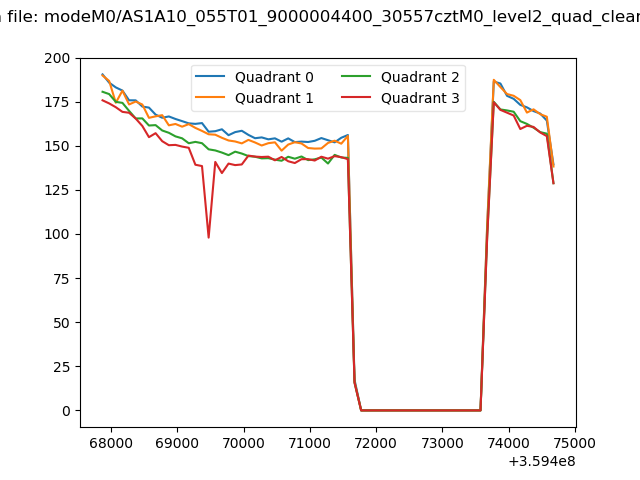 |
|
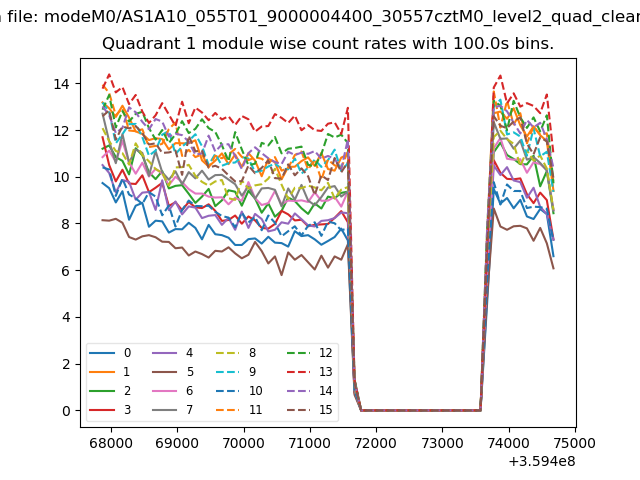
| Module-wise count rates for Quadrant A Data is divided into 100 sec bins |
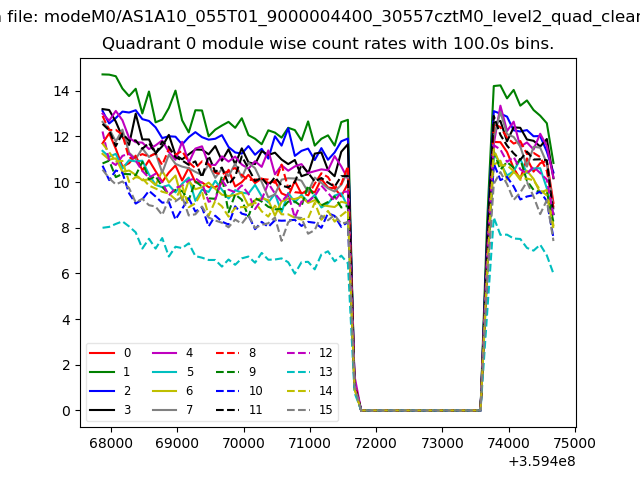 |
 |
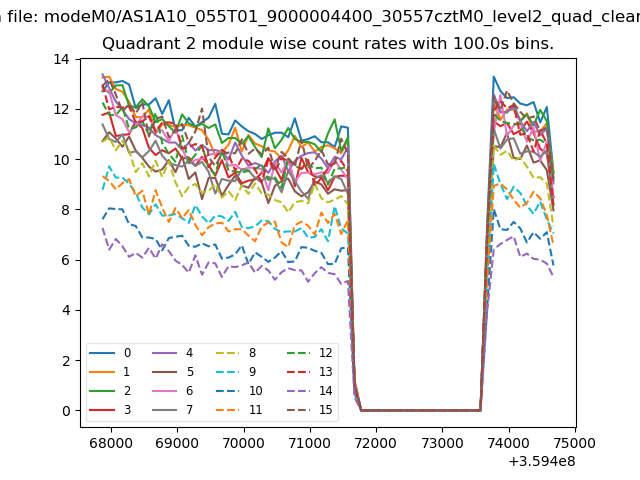
| Module-wise count rates for Quadrant B Data is divided into 100 sec bins |
 |
 |
| Module-wise count rates for Quadrant C Data is divided into 100 sec bins |
 |
 |
| Module-wise count rates for Quadrant D Data is divided into 100 sec bins |
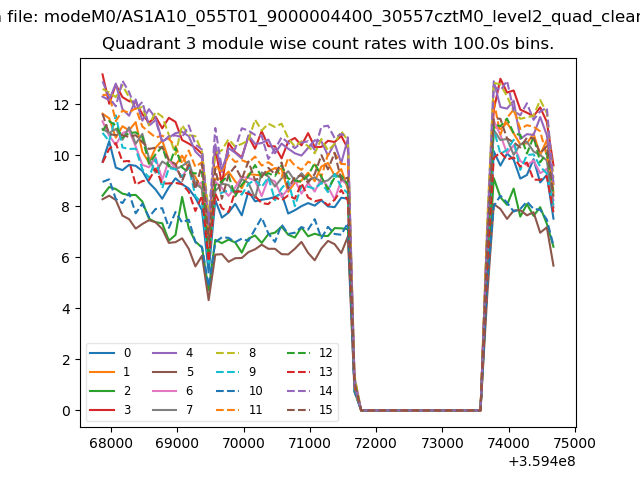 |
 |
| Parameter | Plot |
|---|---|
| CZT HV Monitor | 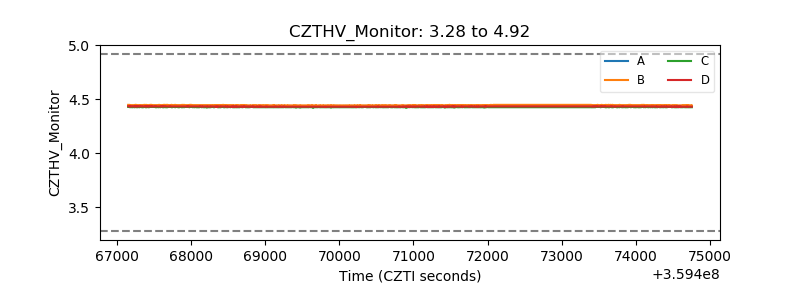 |
| D_VDD | 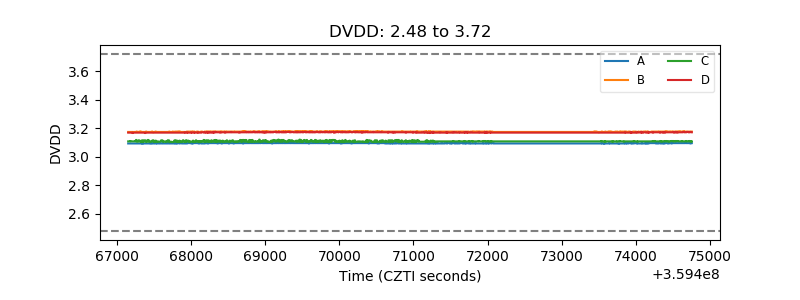 |
| Temperature 1 | 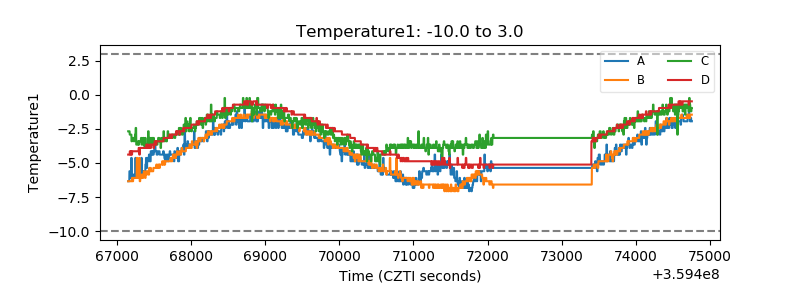 |
| Veto HV Monitor | 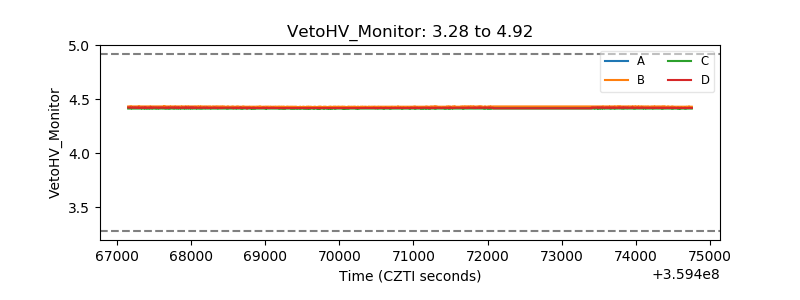 |
| Veto LLD | 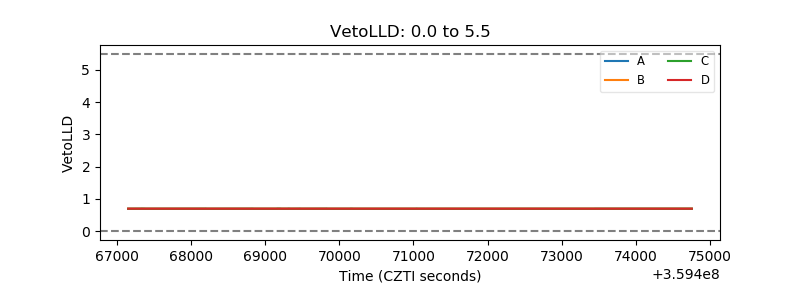 |
| Alpha Counter | 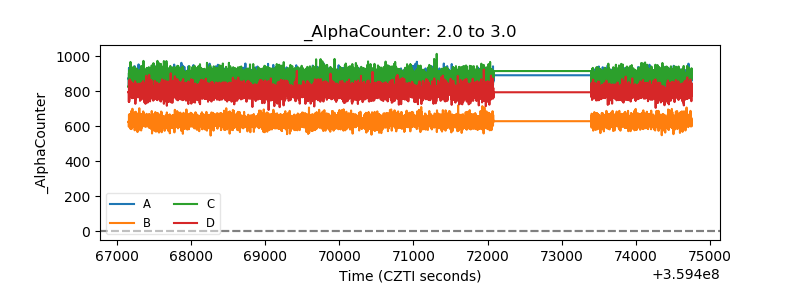 |
| _CPM_Rate | 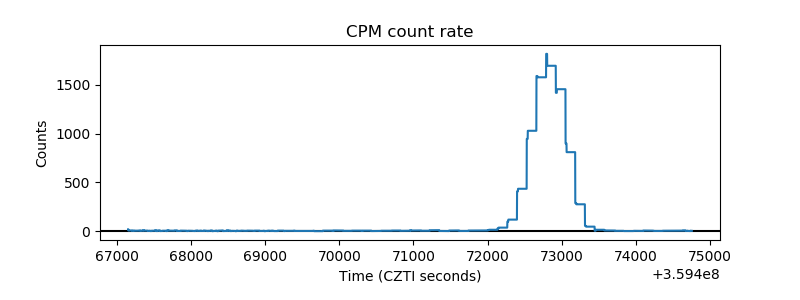 |
| CZT Counter | 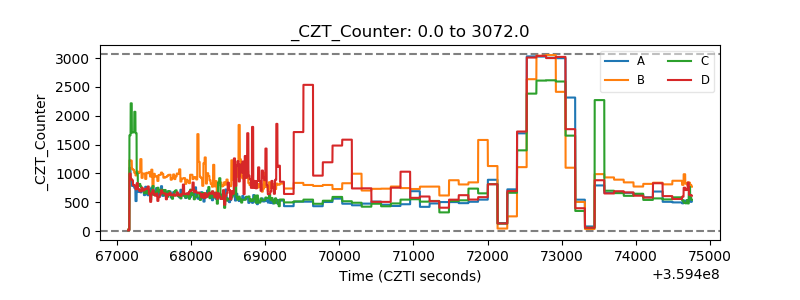 |
| +2.5 Volts monitor |  |
| +5 Volts monitor |  |
| _ROLL_ROT | 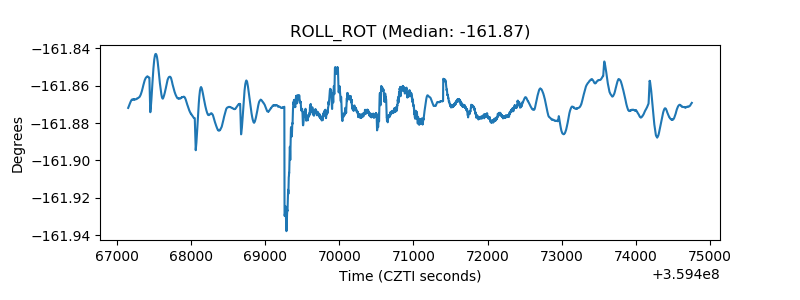 |
| _Roll_DEC | 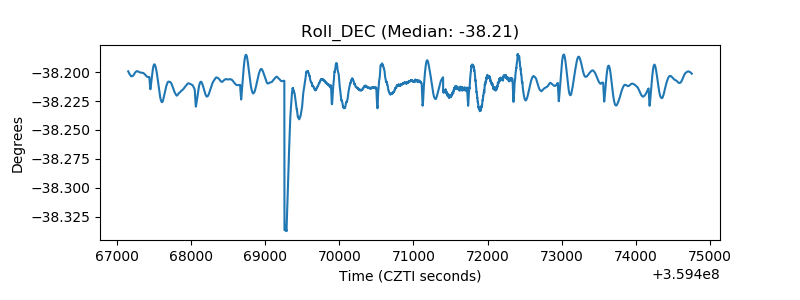 |
| _Roll_RA | 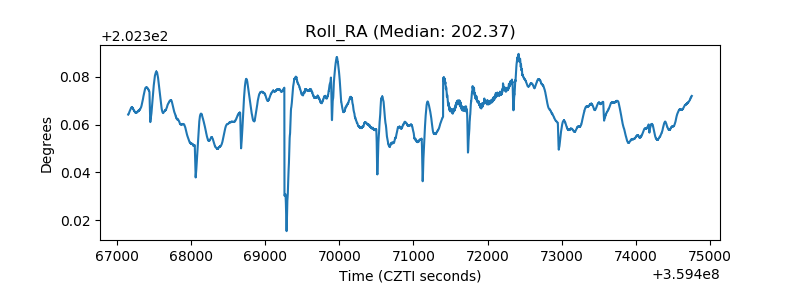 |
| Veto Counter | 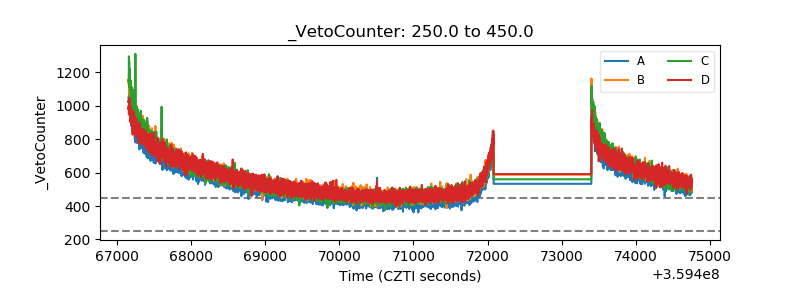 |