| Param | Original file | Final file |
|---|---|---|
| Filename | modeM0/AS1A10_055T01_9000004400_30558cztM0_level2.evt | modeM0/AS1A10_055T01_9000004400_30558cztM0_level2_quad_clean.evt |
| Size (bytes) | 541,811,520 | 125,380,800 |
| Size | 516.7 MB | 119.6 MB |
| Events in quadrant A | 3,419,009 | 871,028 |
| Events in quadrant B | 5,214,277 | 860,288 |
| Events in quadrant C | 3,617,344 | 806,734 |
| Events in quadrant D | 3,721,387 | 809,739 |
| Mode SS | |||
|---|---|---|---|
| Quadrant | BADHDUFLAG | Total packets | Discarded packets |
| A | 0 | 130 | 0 |
| B | 0 | 130 | 0 |
| C | 0 | 130 | 0 |
| D | 0 | 130 | 0 |
| Mode M0 | |||
|---|---|---|---|
| Quadrant | BADHDUFLAG | Total packets | Discarded packets |
| A | 0 | 14080 | 1 |
| B | 0 | 19897 | 1 |
| C | 0 | 14825 | 2 |
| D | 0 | 15180 | 1 |
| Mode M9 | |||
|---|---|---|---|
| Quadrant | BADHDUFLAG | Total packets | Discarded packets |
| A | 0 | 12 | 0 |
| B | 0 | 12 | 0 |
| C | 0 | 12 | 0 |
| D | 0 | 12 | 0 |
| Quadrant | Total seconds | Saturated seconds | Saturation percentage |
|---|---|---|---|
| A | 6453 | 102 | 1.580660% |
| B | 6453 | 180 | 2.789400% |
| C | 6452 | 238 | 3.688779% |
| D | 6452 | 108 | 1.673900% |
Noise dominated data is calculated using 1-second bins in cleaned event files. If a bin has >2000 counts, and if more than 50% of those come from <1% of pixels, then it is considered to be noise-dominated and hence unusable.
| Quadrant | # 1 sec bins | Bins with >0 counts | Bins with >2000 counts | High rate bins dominated by noise | Noise dominated (total time) | Noise dominated (detector-on time) | Marked lightcurve |
|---|---|---|---|---|---|---|---|
| A | 7673 | 6454 | 0 | 0 | 0.00% | 0.00% | 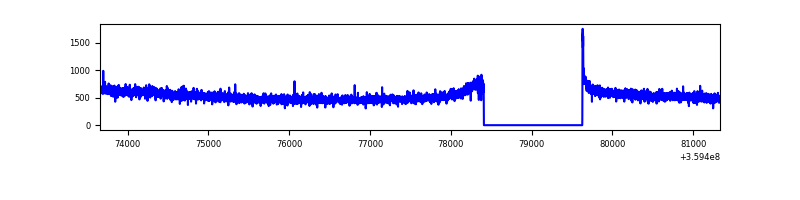 |
| B | 7673 | 6454 | 14 | 14 | 0.18% | 0.22% |  |
| C | 7672 | 6453 | 40 | 40 | 0.52% | 0.62% | 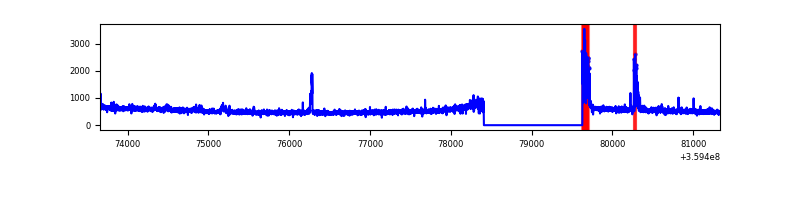 |
| D | 7672 | 6453 | 32 | 32 | 0.42% | 0.50% |  |
Top three noisy pixels from each quadrant. If the there are fewer than three noisy pixels in the level2.evt file, extra rows are filled as -1
| Pixel properties | Quadrant properties | ||||||
|---|---|---|---|---|---|---|---|
| Quadrant | DetID | PixID | Counts | Sigma | Mean | Median | Sigma |
| A | 8 | 192 | 11723 | 62.89 | 884 | 871 | 172.6 |
| A | 13 | 254 | 11478 | 61.47 | 884 | 871 | 172.6 |
| A | 3 | 137 | 8040 | 41.55 | 884 | 871 | 172.6 |
| B | 6 | 159 | 1737538 | 10833.35 | 857 | 840 | 160.3 |
| B | 4 | 171 | 42876 | 262.22 | 857 | 840 | 160.3 |
| B | 5 | 172 | 27067 | 163.6 | 857 | 840 | 160.3 |
| C | 3 | 233 | 154703 | 823.25 | 812 | 818 | 186.9 |
| C | 0 | 10 | 138885 | 738.63 | 812 | 818 | 186.9 |
| C | 14 | 238 | 137695 | 732.26 | 812 | 818 | 186.9 |
| D | 8 | 195 | 153338 | 773.0 | 844 | 824 | 197.3 |
| D | 2 | 250 | 115919 | 583.35 | 844 | 824 | 197.3 |
| D | 13 | 249 | 100642 | 505.92 | 844 | 824 | 197.3 |
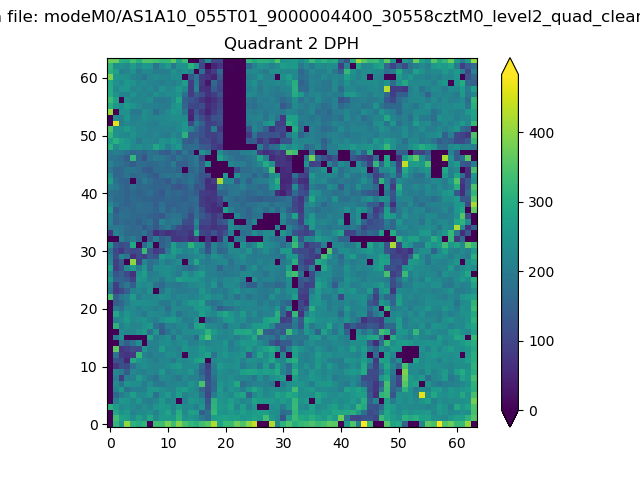
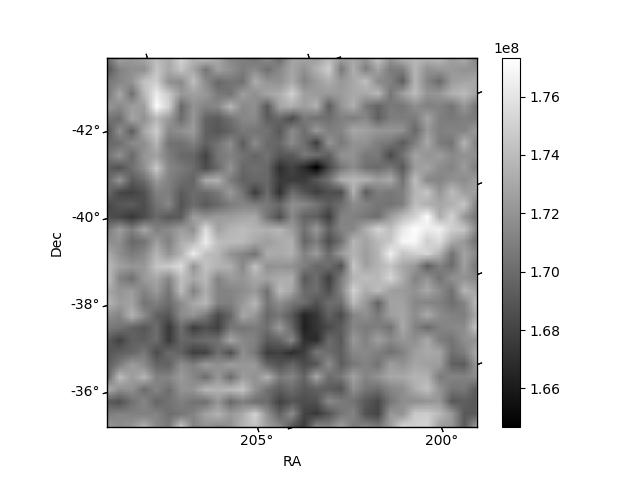
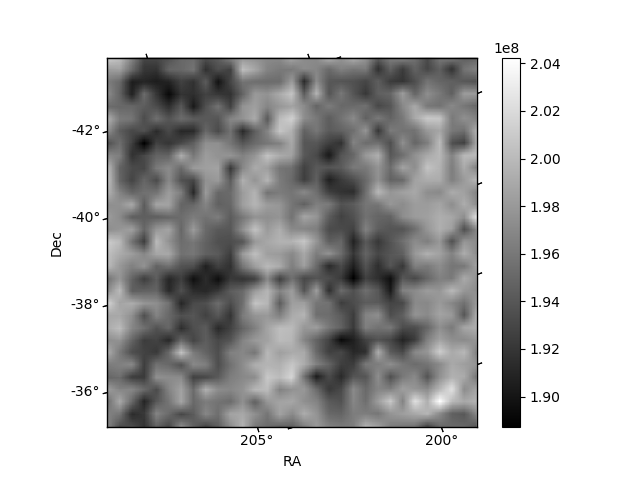
Histogram calculated using DETX and DETY for each event in the final _common_clean file
| Quadrant A | 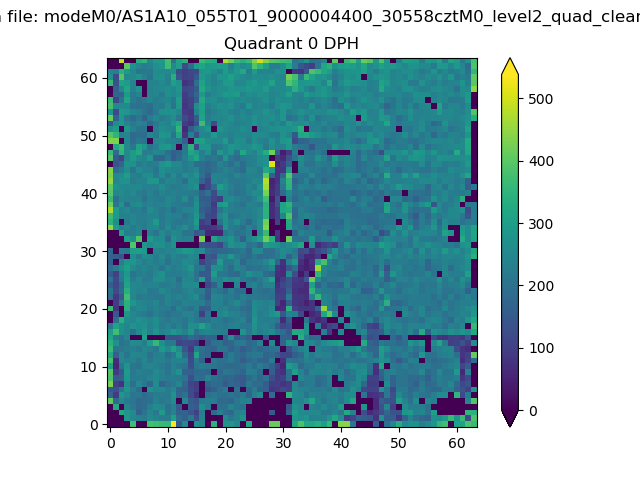 |
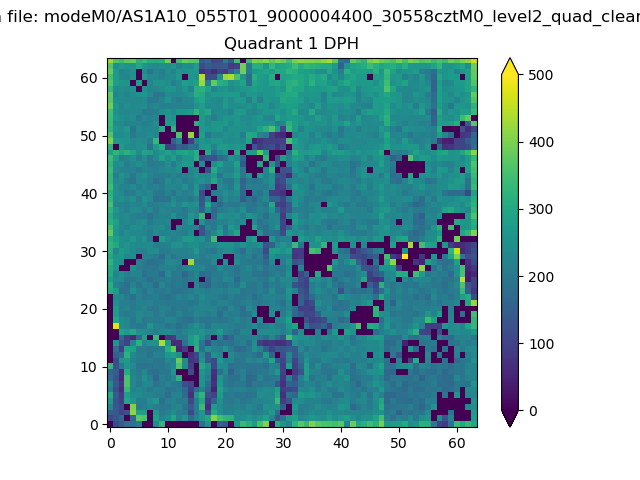 |
Quadrant B |
|---|---|---|---|
| Quadrant D | 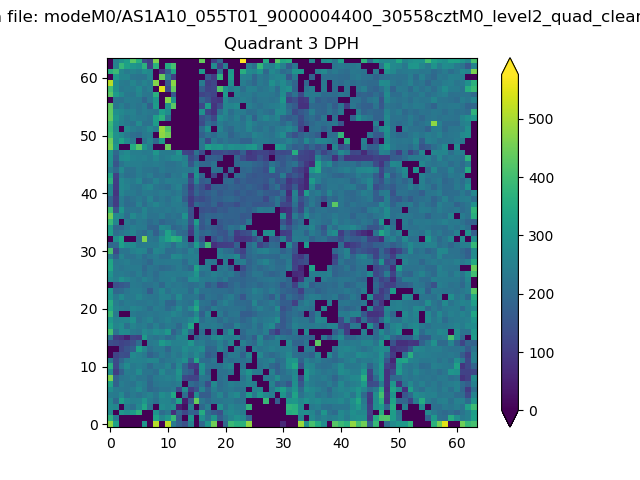 |
 |
Quadrant C |
| Plot type | Count rate plots | Images |
|---|---|---|
| Comparison with Poisson distribution Blue bars denote a histogram of data divided into 1 sec bins. Red curve is a Poisson curve with rate = median count rate of data. |
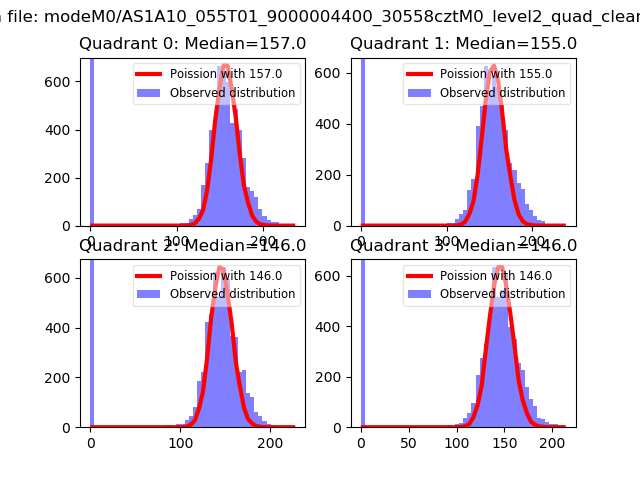 |
 |
| Quadrant-wise count rates Data is divided into 100 sec bins |
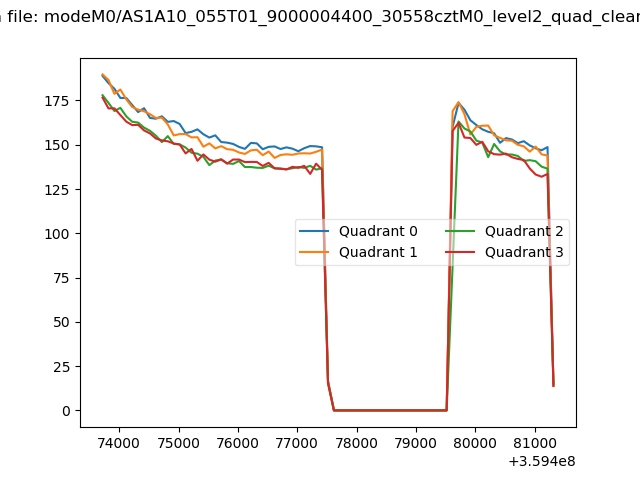 |
|
| Module-wise count rates for Quadrant A Data is divided into 100 sec bins |
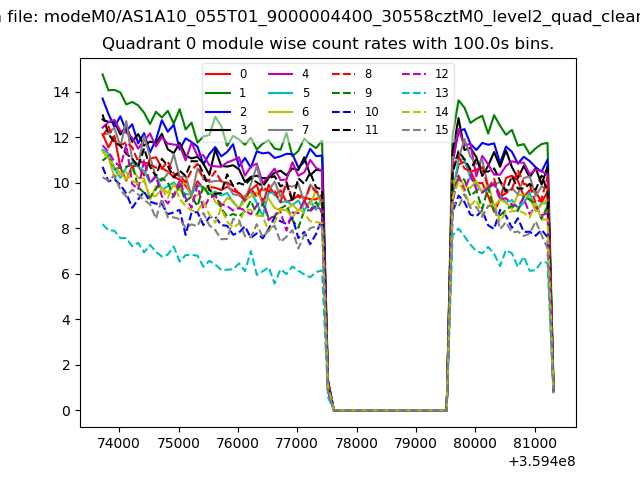 |
 |
| Module-wise count rates for Quadrant B Data is divided into 100 sec bins |
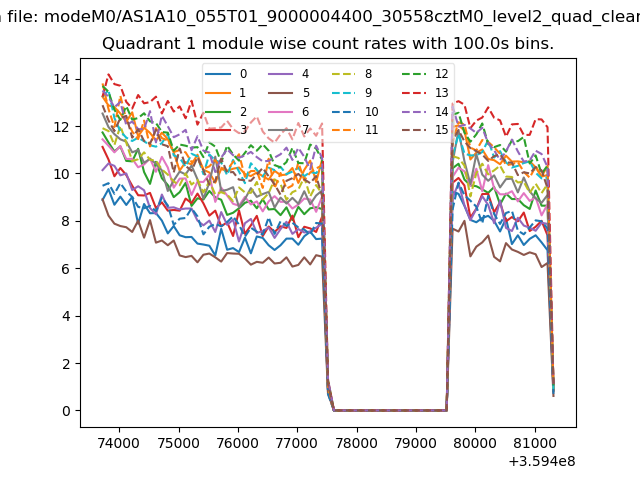 |
 |
| Module-wise count rates for Quadrant C Data is divided into 100 sec bins |
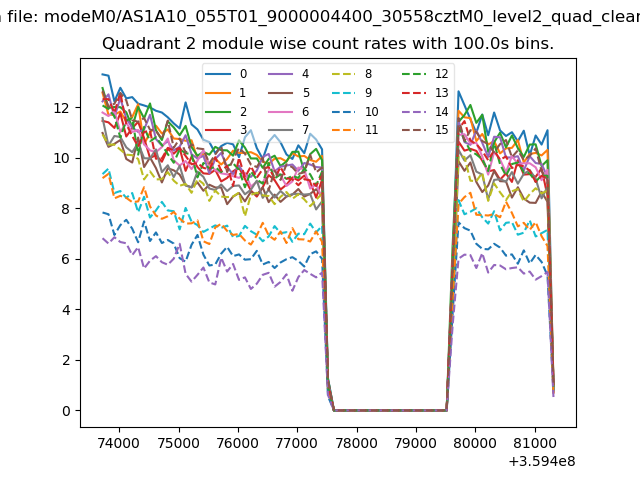 |
 |
| Module-wise count rates for Quadrant D Data is divided into 100 sec bins |
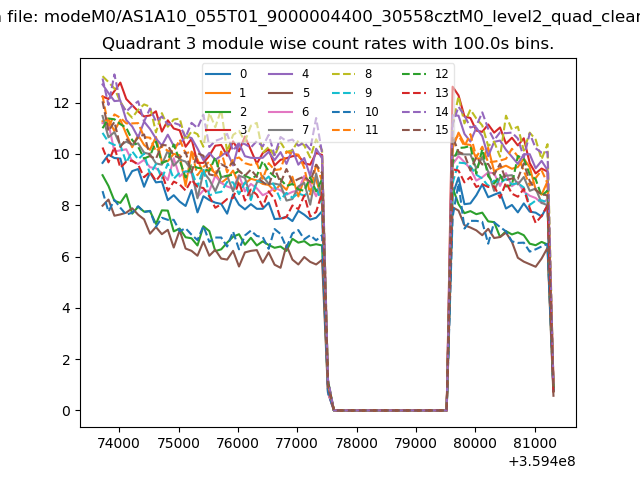 |
 |
| Parameter | Plot |
|---|---|
| CZT HV Monitor | 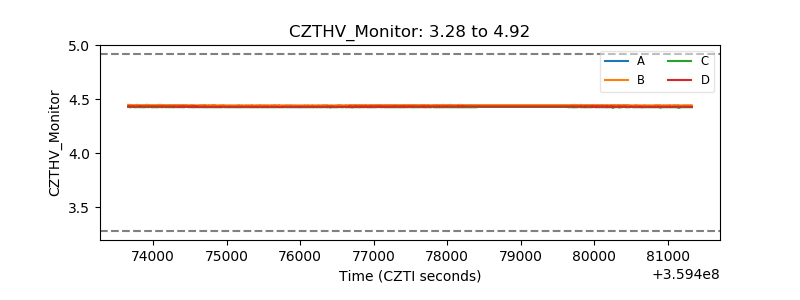 |
| D_VDD | 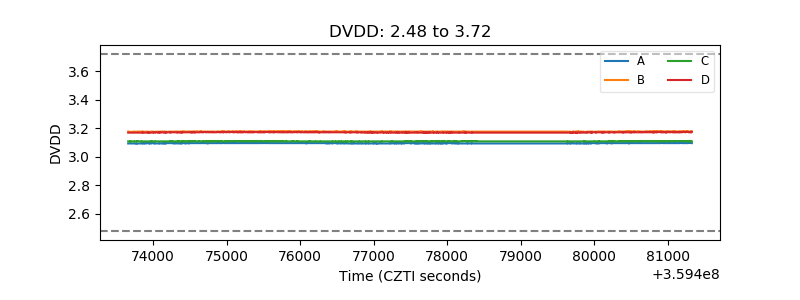 |
| Temperature 1 | 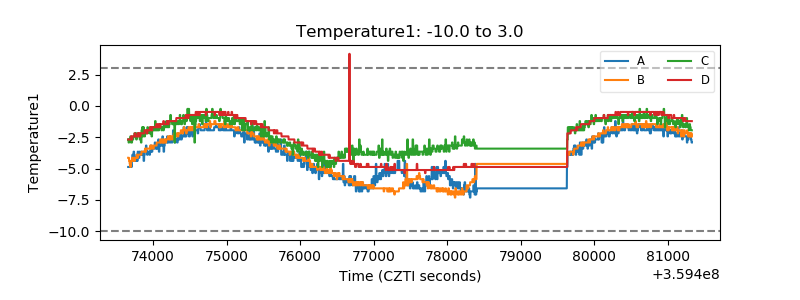 |
| Veto HV Monitor |  |
| Veto LLD | 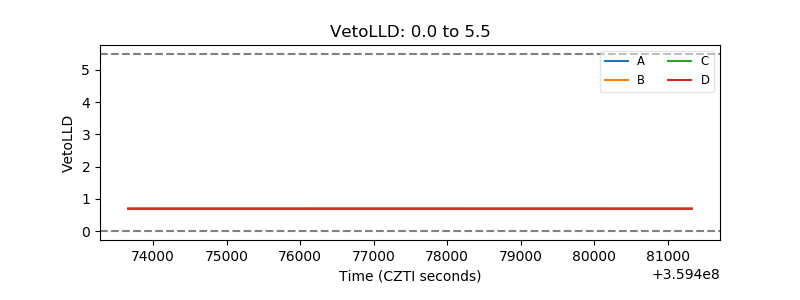 |
| Alpha Counter | 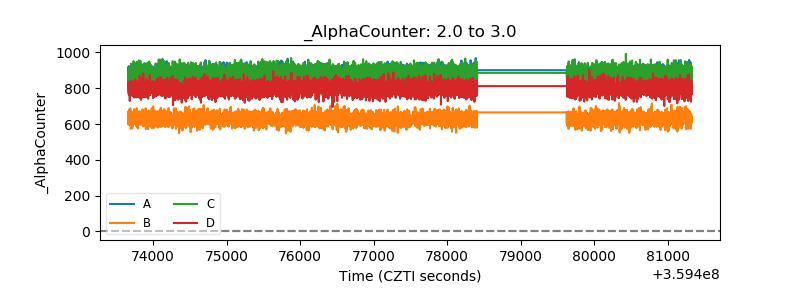 |
| _CPM_Rate | 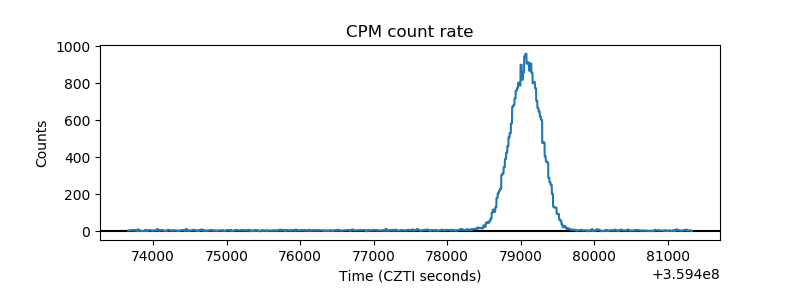 |
| CZT Counter | 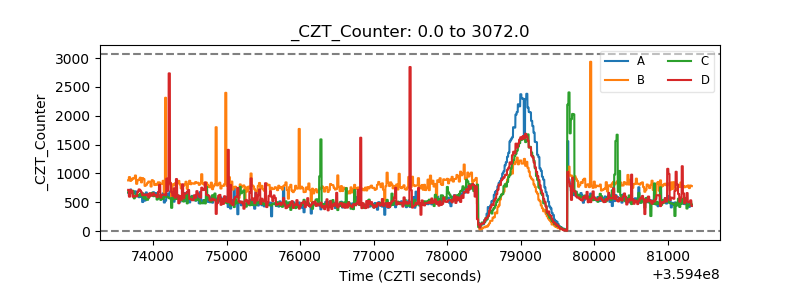 |
| +2.5 Volts monitor |  |
| +5 Volts monitor |  |
| _ROLL_ROT | 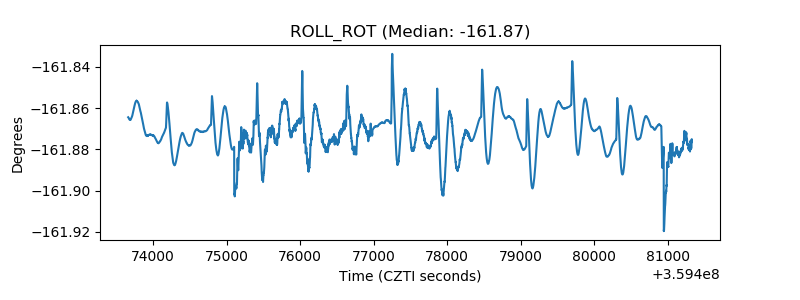 |
| _Roll_DEC | 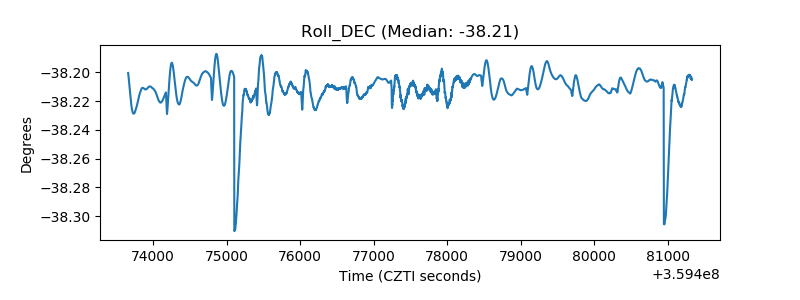 |
| _Roll_RA | 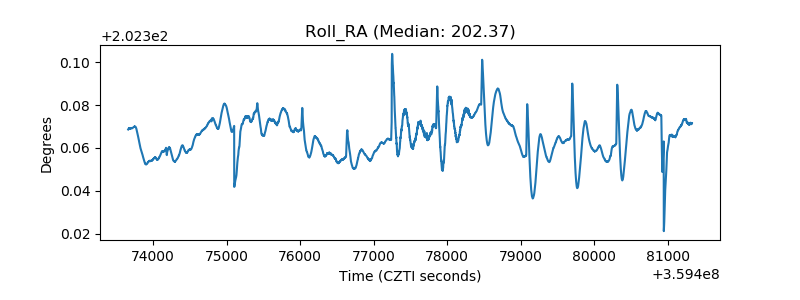 |
| Veto Counter | 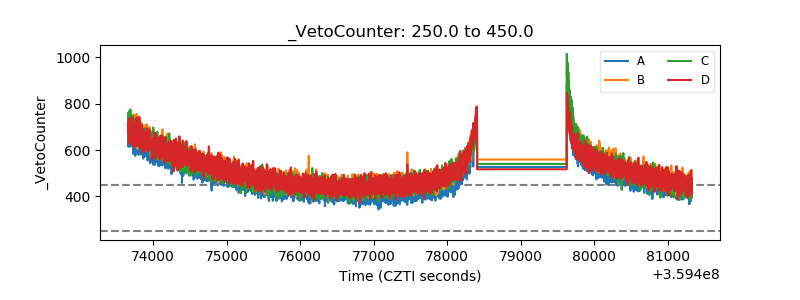 |