| Param | Original file | Final file |
|---|---|---|
| Filename | modeM0/AS1A10_055T01_9000004400_30559cztM0_level2.evt | modeM0/AS1A10_055T01_9000004400_30559cztM0_level2_quad_clean.evt |
| Size (bytes) | 543,792,960 | 110,108,160 |
| Size | 518.6 MB | 105.0 MB |
| Events in quadrant A | 3,317,181 | 747,353 |
| Events in quadrant B | 5,405,519 | 735,946 |
| Events in quadrant C | 3,493,821 | 692,472 |
| Events in quadrant D | 3,801,165 | 694,978 |
| Mode SS | |||
|---|---|---|---|
| Quadrant | BADHDUFLAG | Total packets | Discarded packets |
| A | 0 | 134 | 0 |
| B | 0 | 134 | 0 |
| C | 0 | 134 | 0 |
| D | 0 | 134 | 0 |
| Mode M0 | |||
|---|---|---|---|
| Quadrant | BADHDUFLAG | Total packets | Discarded packets |
| A | 0 | 13904 | 2 |
| B | 0 | 20692 | 1 |
| C | 0 | 14500 | 1 |
| D | 0 | 15487 | 1 |
| Mode M9 | |||
|---|---|---|---|
| Quadrant | BADHDUFLAG | Total packets | Discarded packets |
| A | 0 | 10 | 0 |
| B | 0 | 10 | 0 |
| C | 0 | 10 | 0 |
| D | 0 | 10 | 0 |
| Quadrant | Total seconds | Saturated seconds | Saturation percentage |
|---|---|---|---|
| A | 6660 | 59 | 0.885886% |
| B | 6661 | 188 | 2.822399% |
| C | 6661 | 166 | 2.492118% |
| D | 6661 | 74 | 1.110944% |
Noise dominated data is calculated using 1-second bins in cleaned event files. If a bin has >2000 counts, and if more than 50% of those come from <1% of pixels, then it is considered to be noise-dominated and hence unusable.
| Quadrant | # 1 sec bins | Bins with >0 counts | Bins with >2000 counts | High rate bins dominated by noise | Noise dominated (total time) | Noise dominated (detector-on time) | Marked lightcurve |
|---|---|---|---|---|---|---|---|
| A | 7640 | 6661 | 0 | 0 | 0.00% | 0.00% | 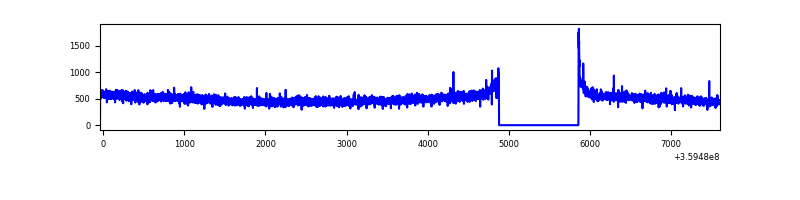 |
| B | 7641 | 6662 | 29 | 29 | 0.38% | 0.44% | 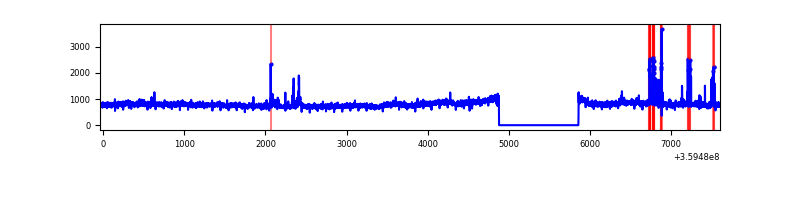 |
| C | 7641 | 6662 | 51 | 51 | 0.67% | 0.77% | 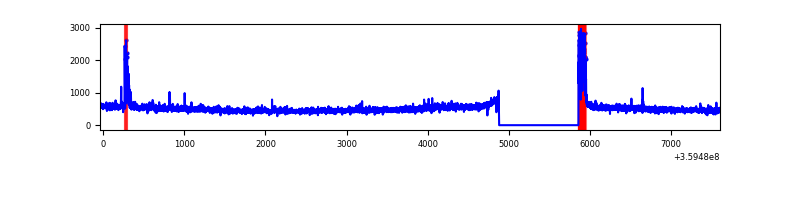 |
| D | 7641 | 6662 | 55 | 55 | 0.72% | 0.83% |  |
Top three noisy pixels from each quadrant. If the there are fewer than three noisy pixels in the level2.evt file, extra rows are filled as -1
| Pixel properties | Quadrant properties | ||||||
|---|---|---|---|---|---|---|---|
| Quadrant | DetID | PixID | Counts | Sigma | Mean | Median | Sigma |
| A | 13 | 254 | 12269 | 67.69 | 856 | 842 | 168.8 |
| A | 8 | 192 | 11389 | 62.48 | 856 | 842 | 168.8 |
| A | 3 | 137 | 8128 | 43.16 | 856 | 842 | 168.8 |
| B | 6 | 159 | 1861462 | 11767.59 | 837 | 819 | 158.1 |
| B | 5 | 255 | 125420 | 788.04 | 837 | 819 | 158.1 |
| B | 6 | 36 | 47903 | 297.78 | 837 | 819 | 158.1 |
| C | 0 | 10 | 156241 | 847.59 | 790 | 797 | 183.4 |
| C | 14 | 238 | 129930 | 704.12 | 790 | 797 | 183.4 |
| C | 3 | 233 | 109927 | 595.05 | 790 | 797 | 183.4 |
| D | 13 | 249 | 297328 | 1535.83 | 817 | 797 | 193.1 |
| D | 8 | 195 | 155540 | 801.46 | 817 | 797 | 193.1 |
| D | 2 | 250 | 132836 | 683.87 | 817 | 797 | 193.1 |
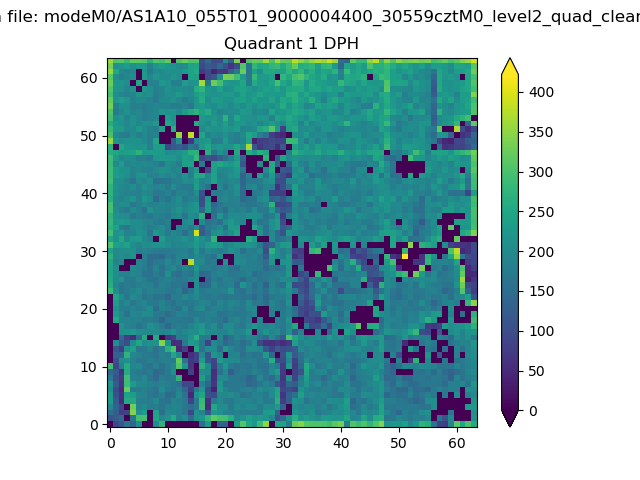
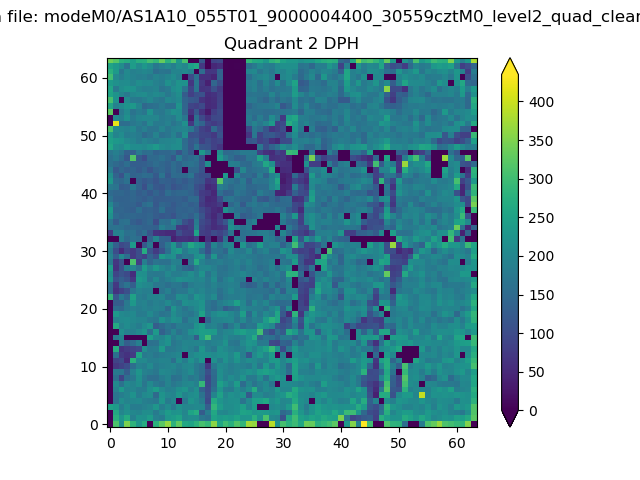
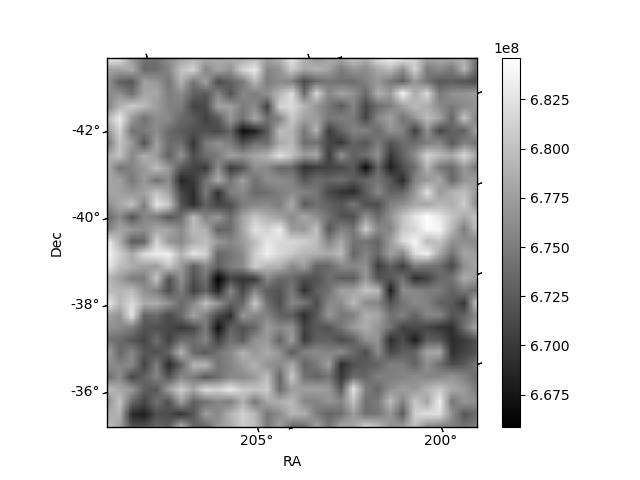
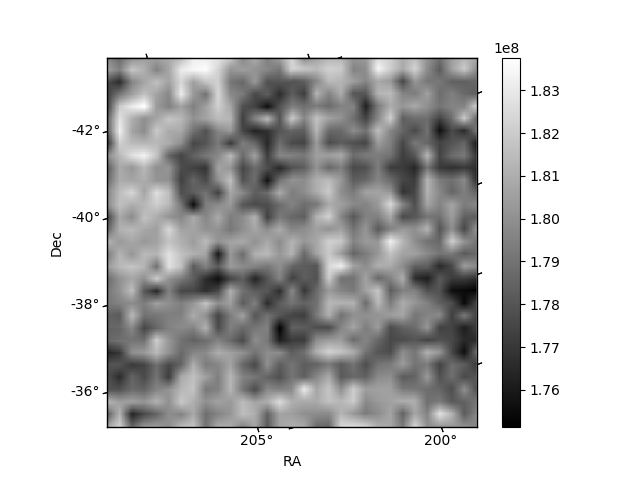
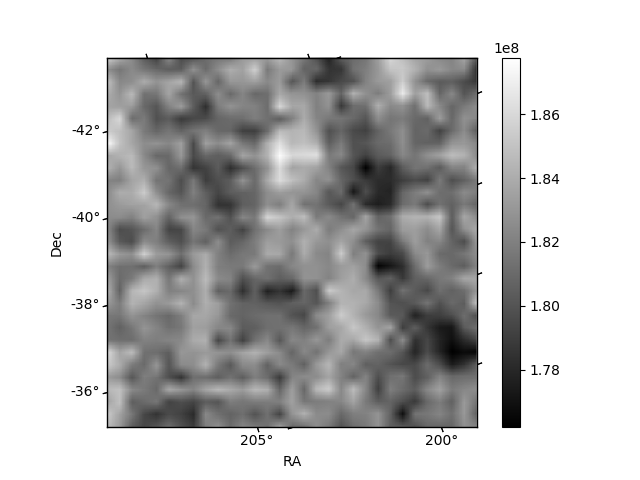
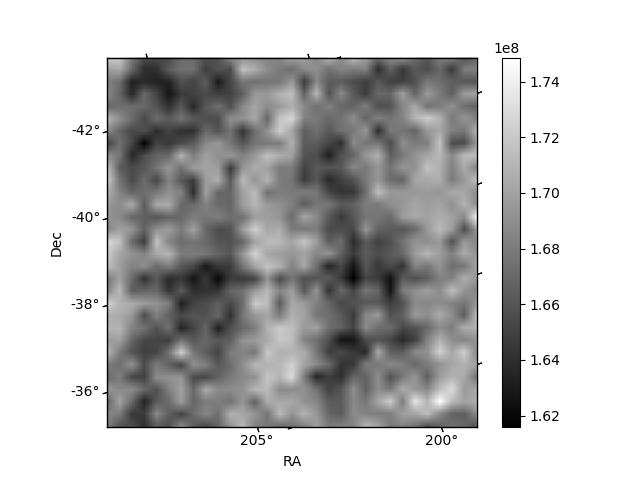
Histogram calculated using DETX and DETY for each event in the final _common_clean file
| Quadrant A | 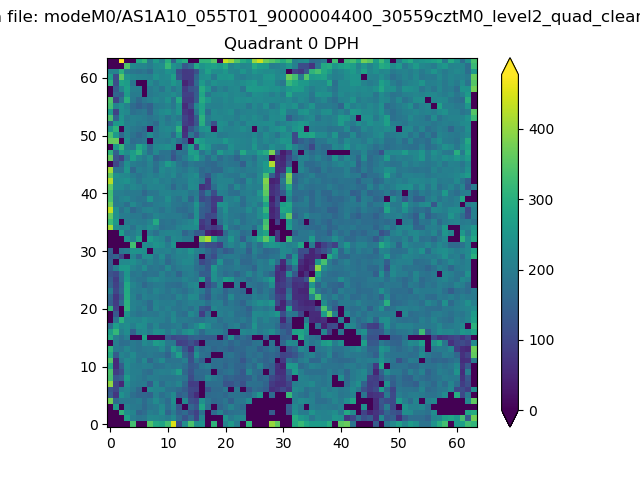 |
 |
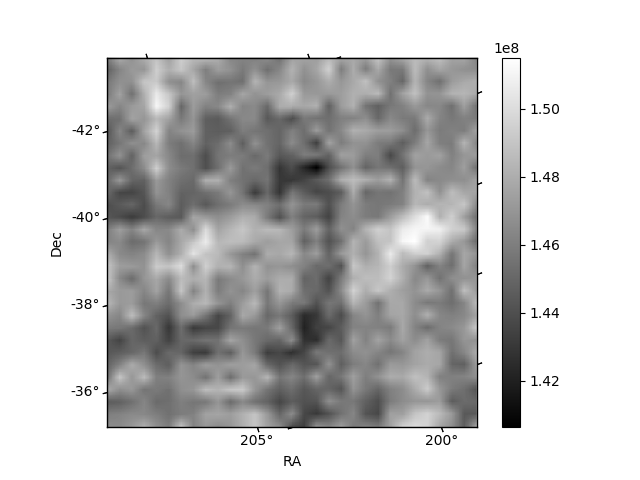
Quadrant B |
|---|---|---|---|
| Quadrant D | 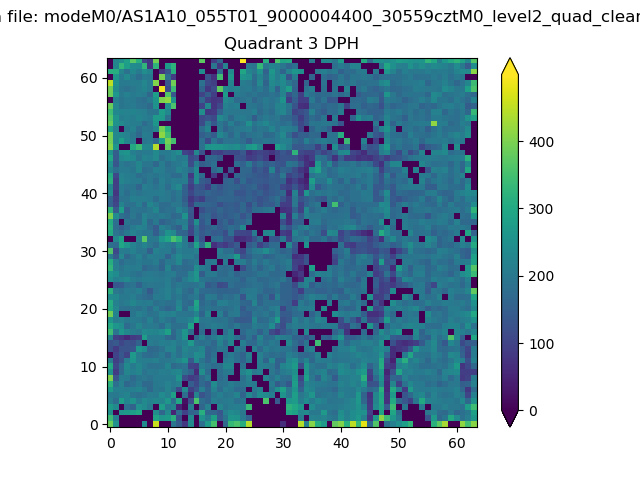 |
 |
Quadrant C |
| Plot type | Count rate plots | Images |
|---|---|---|
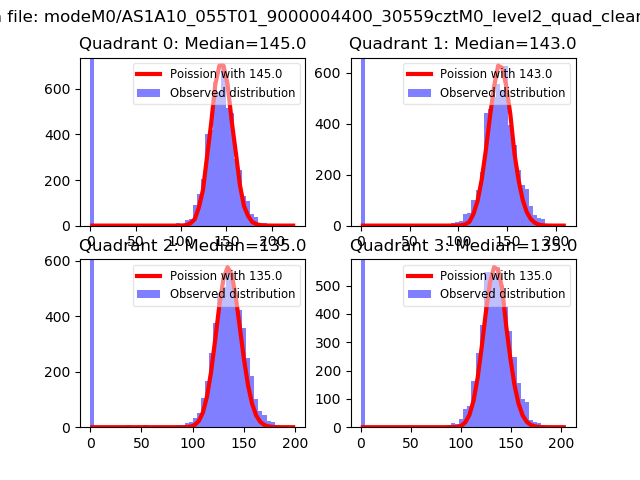
| Comparison with Poisson distribution Blue bars denote a histogram of data divided into 1 sec bins. Red curve is a Poisson curve with rate = median count rate of data. |
 |
 |
| Quadrant-wise count rates Data is divided into 100 sec bins |
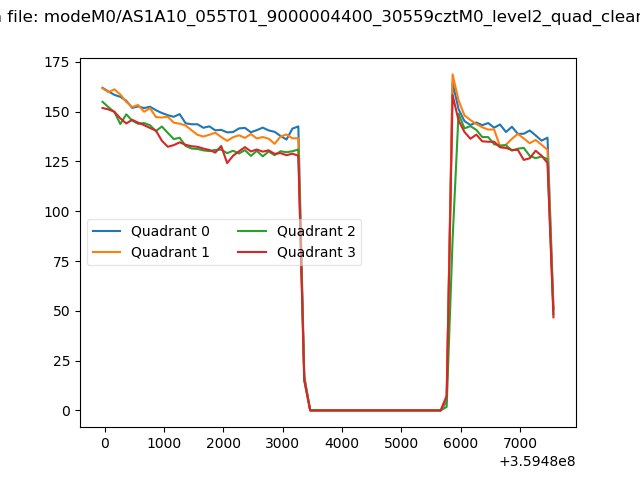 |
|
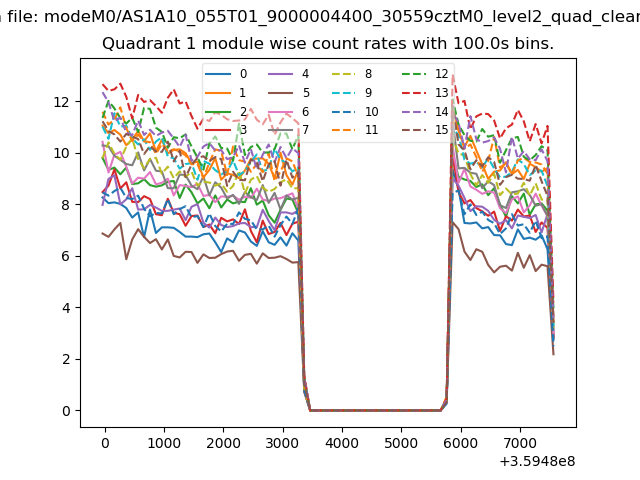
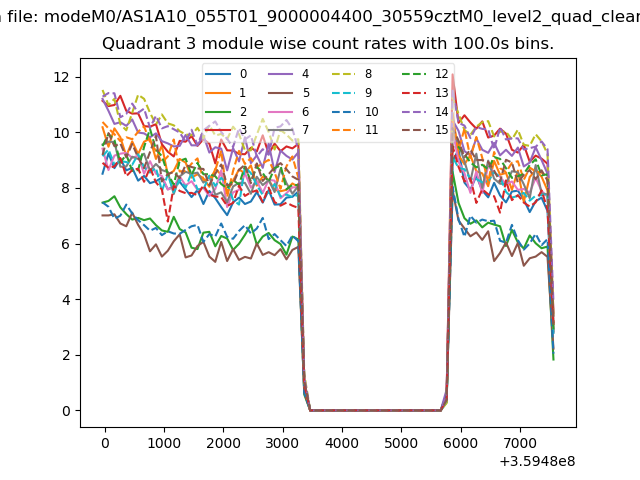
| Module-wise count rates for Quadrant A Data is divided into 100 sec bins |
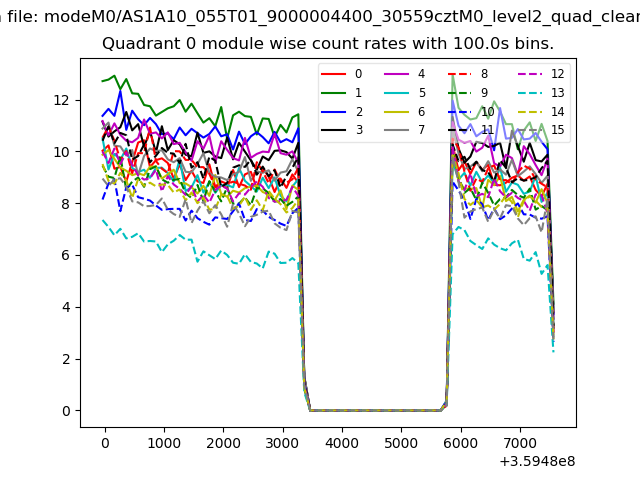 |
 |
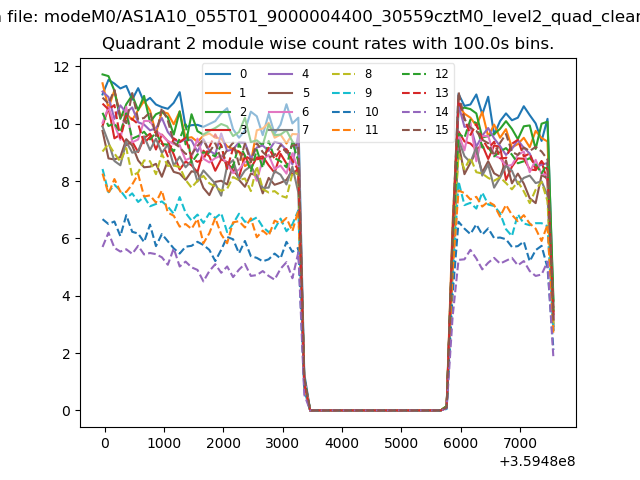
| Module-wise count rates for Quadrant B Data is divided into 100 sec bins |
 |
 |
| Module-wise count rates for Quadrant C Data is divided into 100 sec bins |
 |
 |
| Module-wise count rates for Quadrant D Data is divided into 100 sec bins |
 |
 |
| Parameter | Plot |
|---|---|
| CZT HV Monitor | 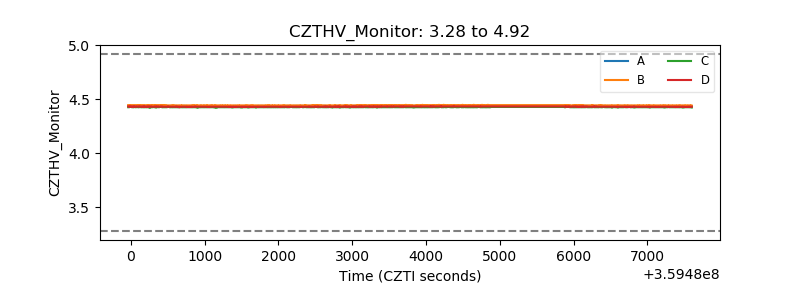 |
| D_VDD | 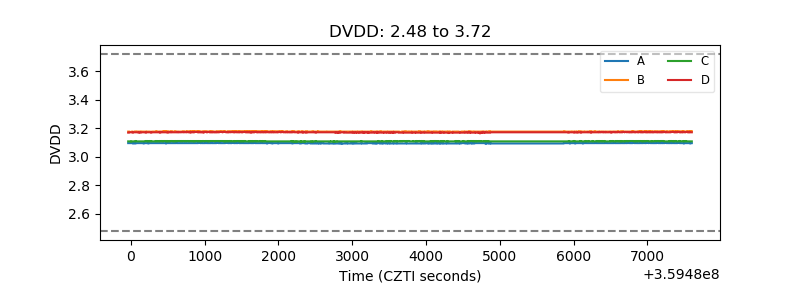 |
| Temperature 1 | 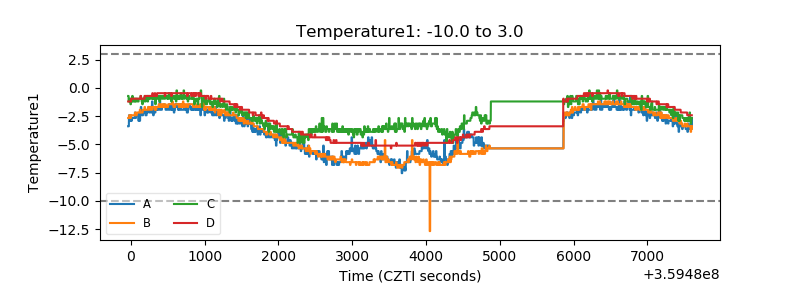 |
| Veto HV Monitor | 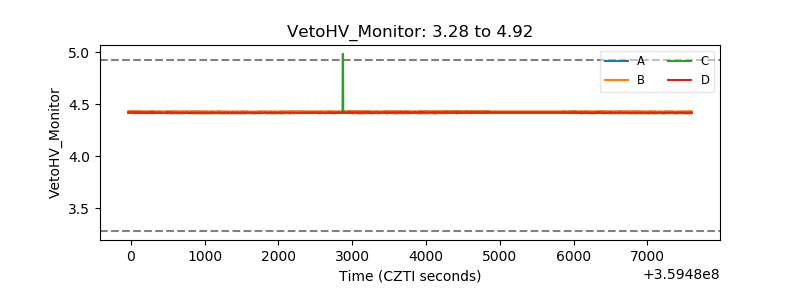 |
| Veto LLD | 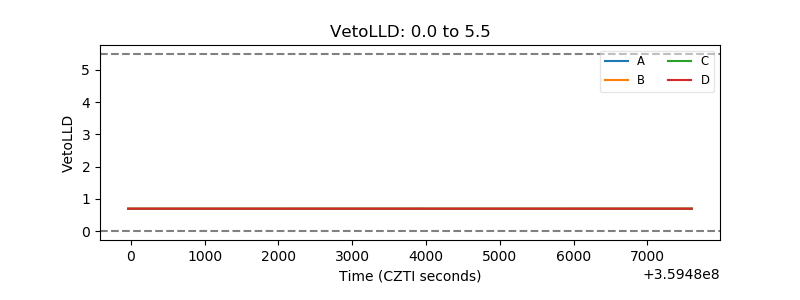 |
| Alpha Counter | 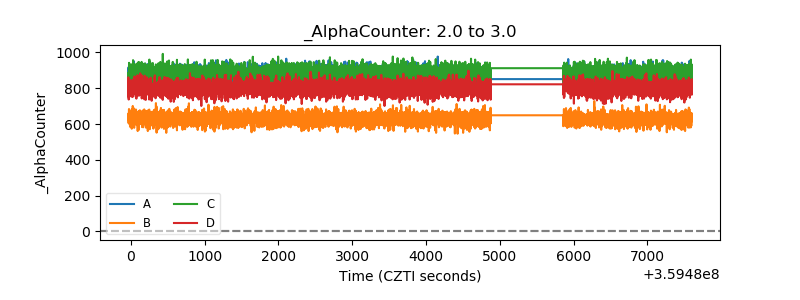 |
| _CPM_Rate | 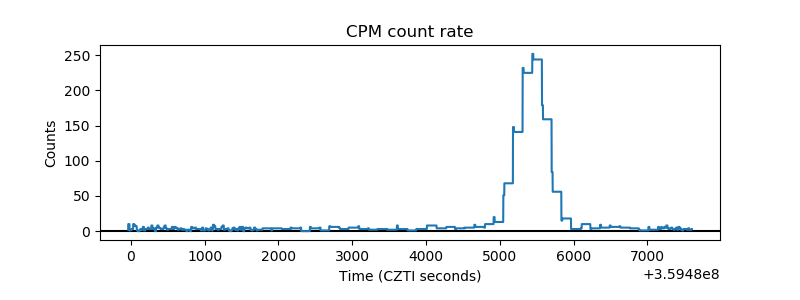 |
| CZT Counter | 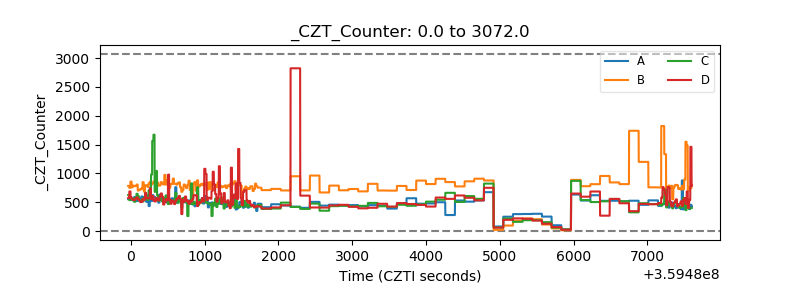 |
| +2.5 Volts monitor |  |
| +5 Volts monitor |  |
| _ROLL_ROT | 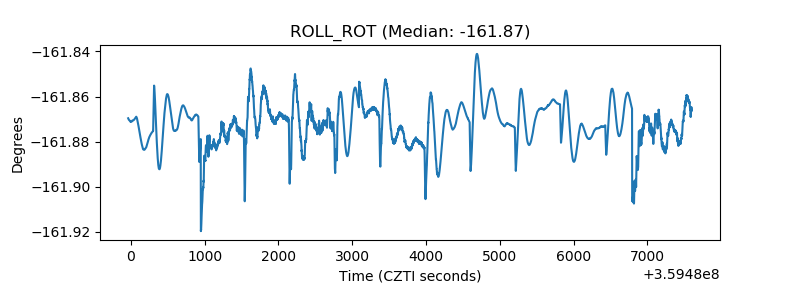 |
| _Roll_DEC | 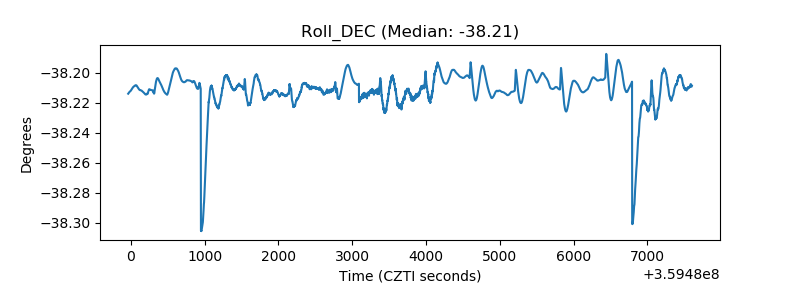 |
| _Roll_RA | 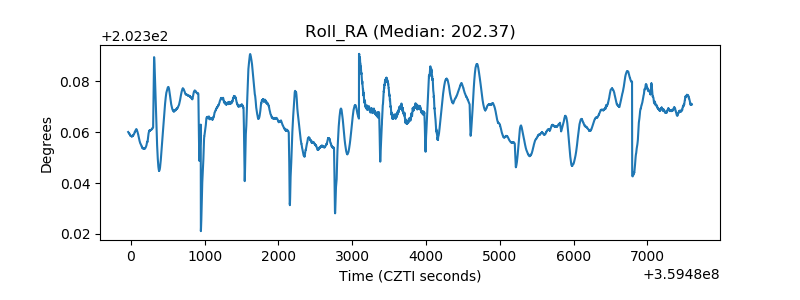 |
| Veto Counter | 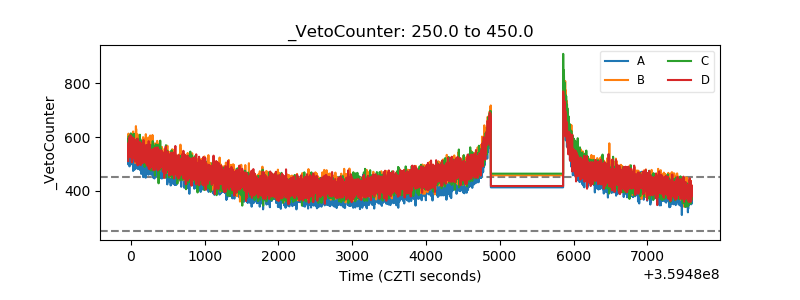 |