| Param | Original file | Final file |
|---|---|---|
| Filename | modeM0/AS1A10_055T01_9000004400_30560cztM0_level2.evt | modeM0/AS1A10_055T01_9000004400_30560cztM0_level2_quad_clean.evt |
| Size (bytes) | 559,728,000 | 101,577,600 |
| Size | 533.8 MB | 96.9 MB |
| Events in quadrant A | 3,413,085 | 670,395 |
| Events in quadrant B | 5,589,331 | 661,650 |
| Events in quadrant C | 3,523,437 | 633,660 |
| Events in quadrant D | 3,954,471 | 626,074 |
| Mode SS | |||
|---|---|---|---|
| Quadrant | BADHDUFLAG | Total packets | Discarded packets |
| A | 0 | 142 | 0 |
| B | 0 | 142 | 0 |
| C | 0 | 142 | 0 |
| D | 0 | 142 | 0 |
| Mode M0 | |||
|---|---|---|---|
| Quadrant | BADHDUFLAG | Total packets | Discarded packets |
| A | 0 | 14590 | 1 |
| B | 0 | 21464 | 1 |
| C | 0 | 14754 | 1 |
| D | 0 | 16237 | 1 |
| Mode M9 | |||
|---|---|---|---|
| Quadrant | BADHDUFLAG | Total packets | Discarded packets |
| A | 0 | 5 | 0 |
| B | 0 | 5 | 0 |
| C | 0 | 5 | 0 |
| D | 0 | 5 | 0 |
| Quadrant | Total seconds | Saturated seconds | Saturation percentage |
|---|---|---|---|
| A | 6952 | 69 | 0.992520% |
| B | 6952 | 184 | 2.646720% |
| C | 6952 | 99 | 1.424051% |
| D | 6952 | 91 | 1.308976% |
Noise dominated data is calculated using 1-second bins in cleaned event files. If a bin has >2000 counts, and if more than 50% of those come from <1% of pixels, then it is considered to be noise-dominated and hence unusable.
| Quadrant | # 1 sec bins | Bins with >0 counts | Bins with >2000 counts | High rate bins dominated by noise | Noise dominated (total time) | Noise dominated (detector-on time) | Marked lightcurve |
|---|---|---|---|---|---|---|---|
| A | 7492 | 6953 | 3 | 3 | 0.04% | 0.04% | 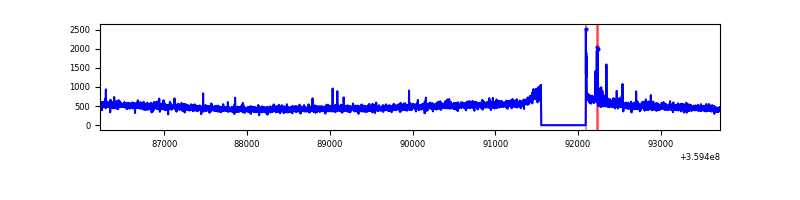 |
| B | 7492 | 6953 | 30 | 30 | 0.40% | 0.43% | 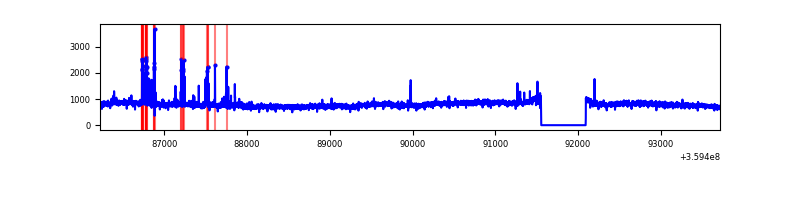 |
| C | 7492 | 6953 | 0 | 0 | 0.00% | 0.00% | 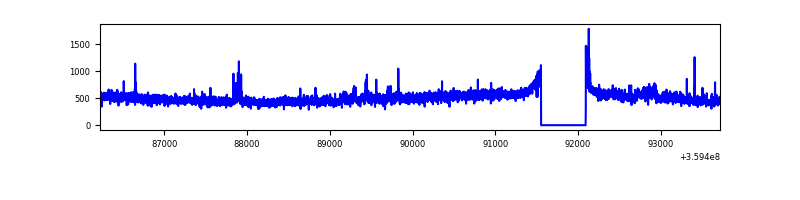 |
| D | 7492 | 6953 | 61 | 61 | 0.81% | 0.88% | 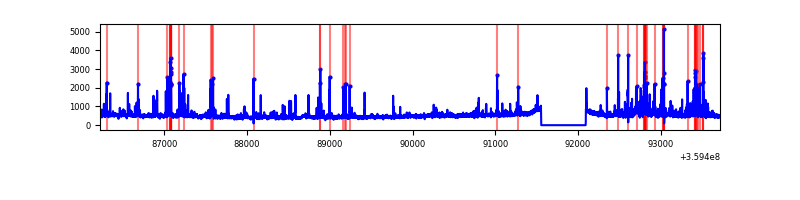 |
Top three noisy pixels from each quadrant. If the there are fewer than three noisy pixels in the level2.evt file, extra rows are filled as -1
| Pixel properties | Quadrant properties | ||||||
|---|---|---|---|---|---|---|---|
| Quadrant | DetID | PixID | Counts | Sigma | Mean | Median | Sigma |
| A | 12 | 96 | 48449 | 275.39 | 869 | 852 | 172.8 |
| A | 13 | 254 | 12679 | 68.43 | 869 | 852 | 172.8 |
| A | 8 | 192 | 12151 | 65.37 | 869 | 852 | 172.8 |
| B | 6 | 159 | 2017791 | 12337.67 | 853 | 832 | 163.5 |
| B | 5 | 255 | 139337 | 847.23 | 853 | 832 | 163.5 |
| B | 3 | 112 | 31817 | 189.53 | 853 | 832 | 163.5 |
| C | 3 | 233 | 168989 | 885.29 | 816 | 820 | 190.0 |
| C | 14 | 238 | 133397 | 697.93 | 816 | 820 | 190.0 |
| C | 2 | 114 | 16393 | 81.98 | 816 | 820 | 190.0 |
| D | 13 | 249 | 230360 | 1171.58 | 828 | 806 | 195.9 |
| D | 1 | 52 | 211978 | 1077.77 | 828 | 806 | 195.9 |
| D | 8 | 195 | 171261 | 869.96 | 828 | 806 | 195.9 |
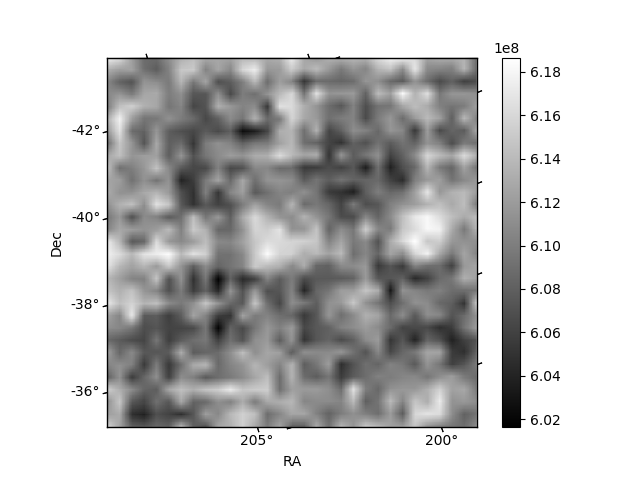
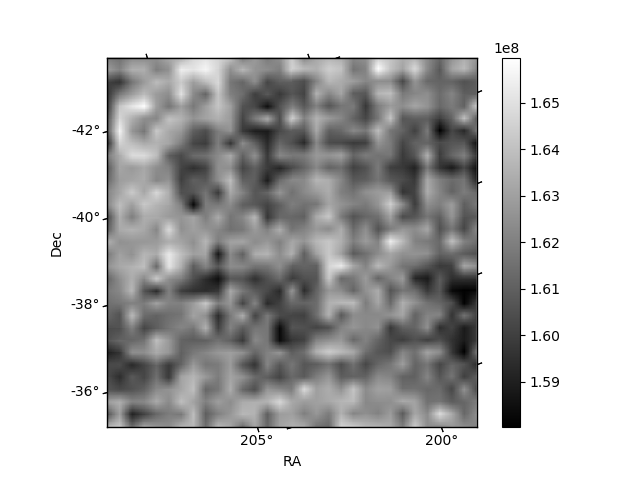
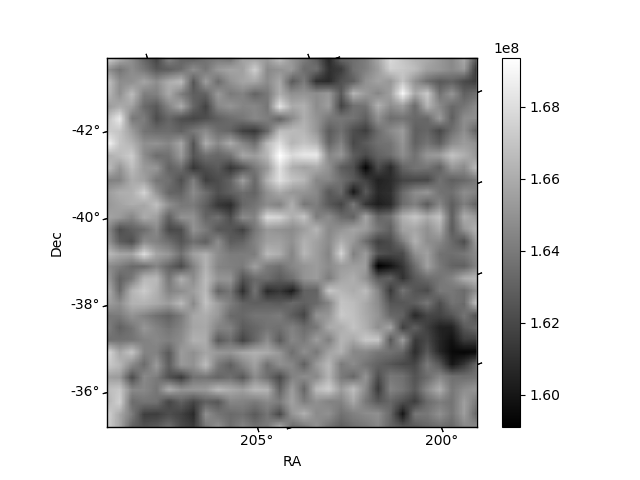
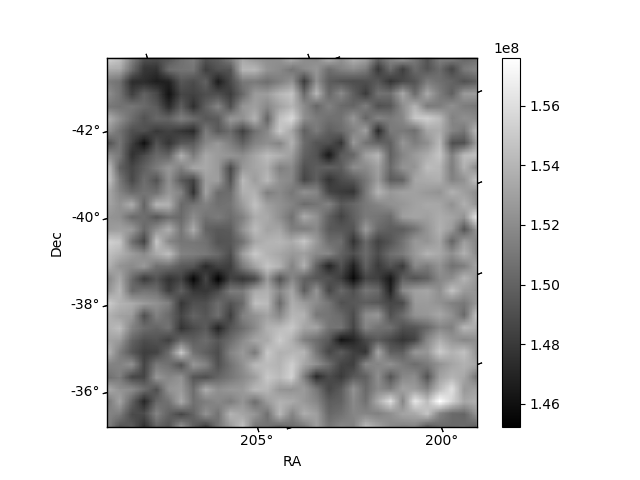
Histogram calculated using DETX and DETY for each event in the final _common_clean file
| Quadrant A | 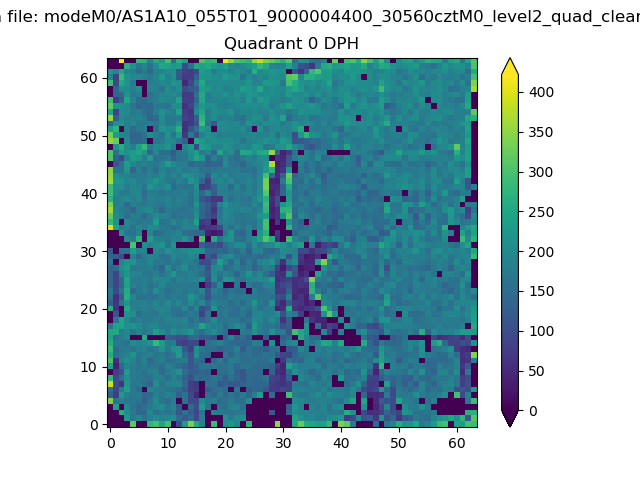 |
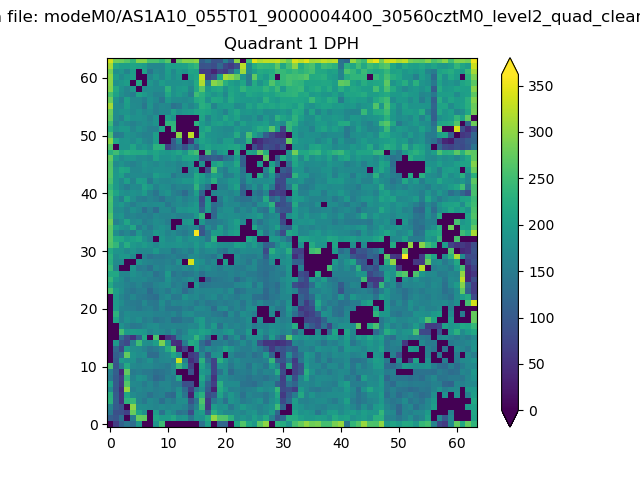 |
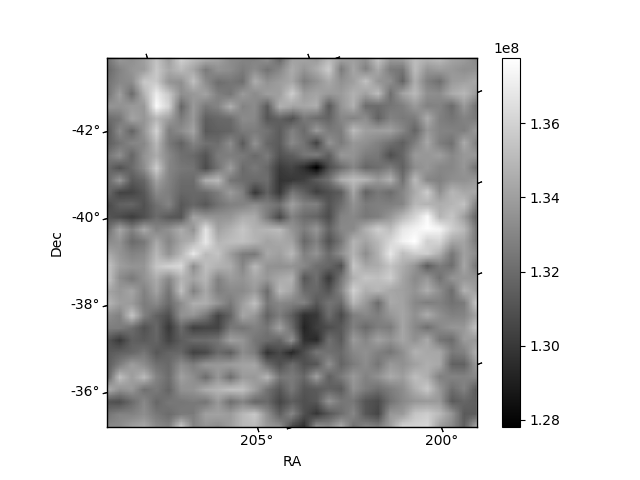
Quadrant B |
|---|---|---|---|
| Quadrant D | 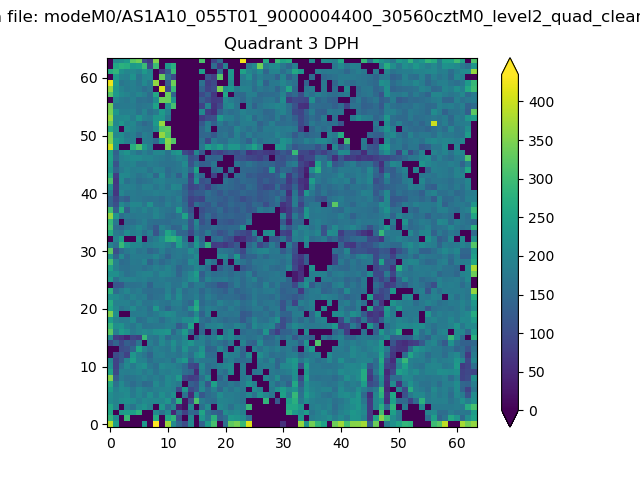 |
 |
Quadrant C |
| Plot type | Count rate plots | Images |
|---|---|---|
| Comparison with Poisson distribution Blue bars denote a histogram of data divided into 1 sec bins. Red curve is a Poisson curve with rate = median count rate of data. |
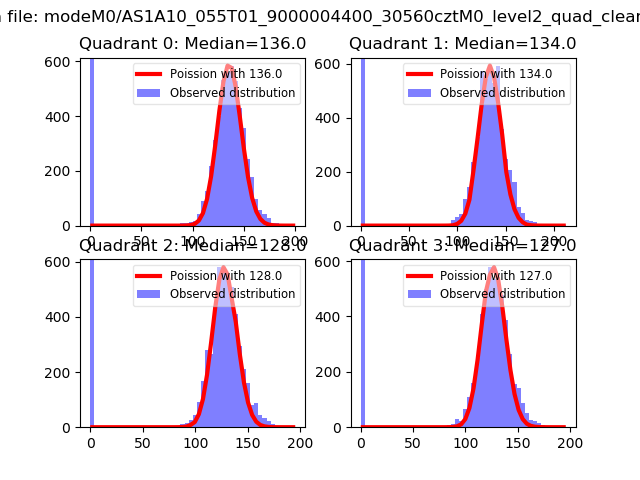 |
 |
| Quadrant-wise count rates Data is divided into 100 sec bins |
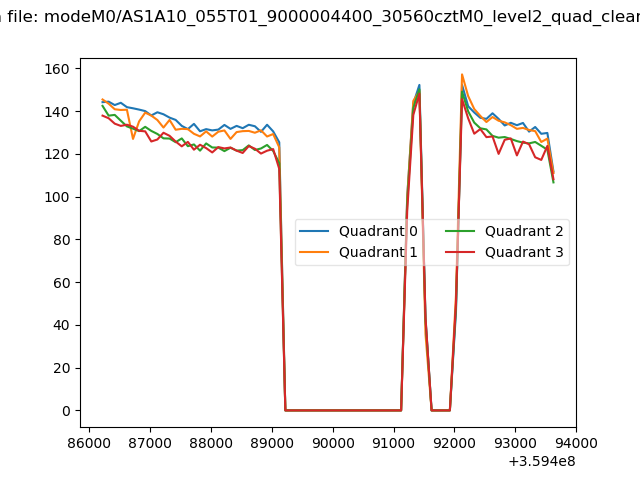 |
|
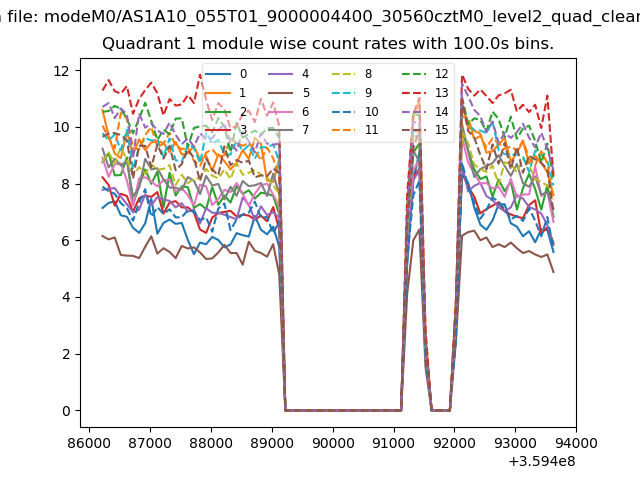
| Module-wise count rates for Quadrant A Data is divided into 100 sec bins |
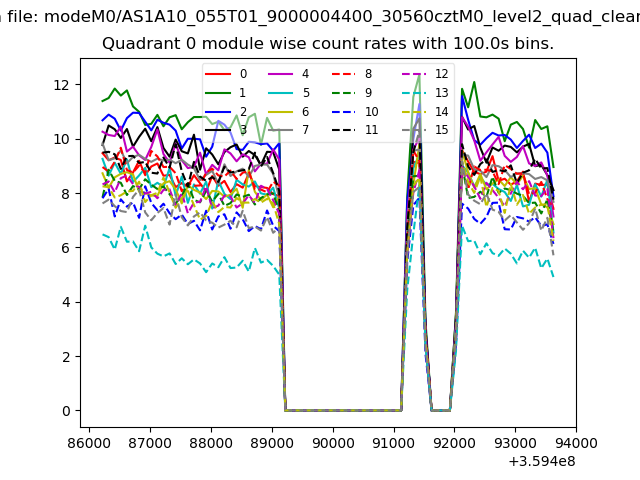 |
 |
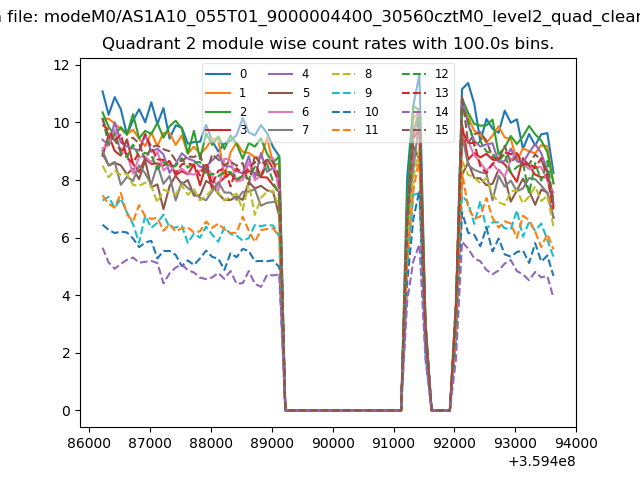
| Module-wise count rates for Quadrant B Data is divided into 100 sec bins |
 |
 |
| Module-wise count rates for Quadrant C Data is divided into 100 sec bins |
 |
 |
| Module-wise count rates for Quadrant D Data is divided into 100 sec bins |
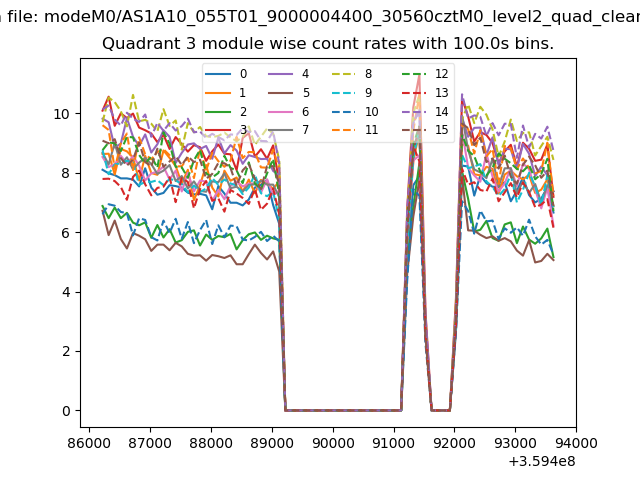 |
 |
| Parameter | Plot |
|---|---|
| CZT HV Monitor | 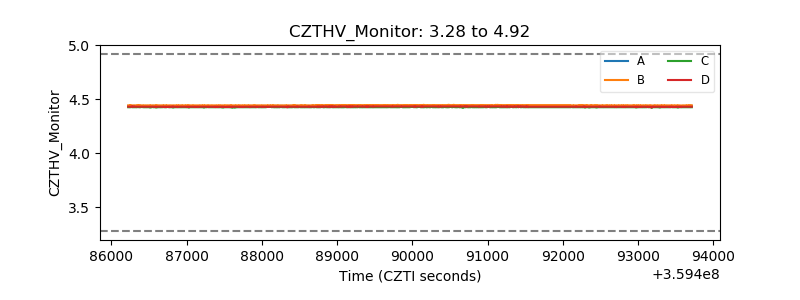 |
| D_VDD | 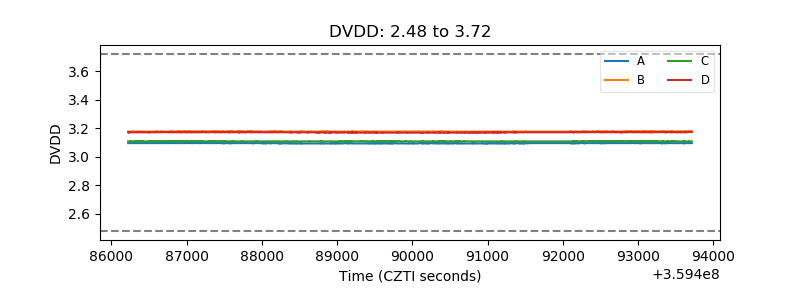 |
| Temperature 1 | 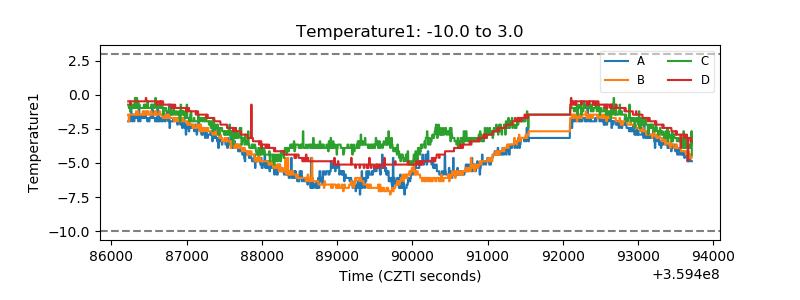 |
| Veto HV Monitor | 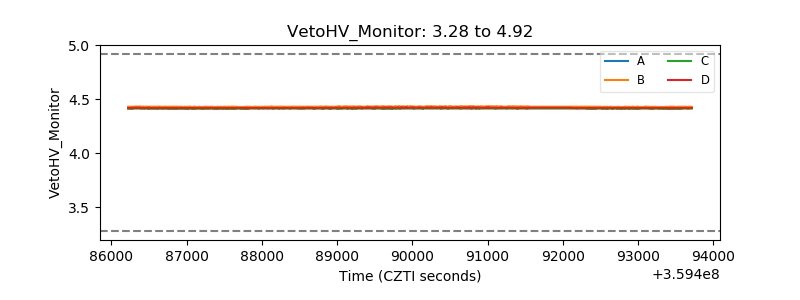 |
| Veto LLD | 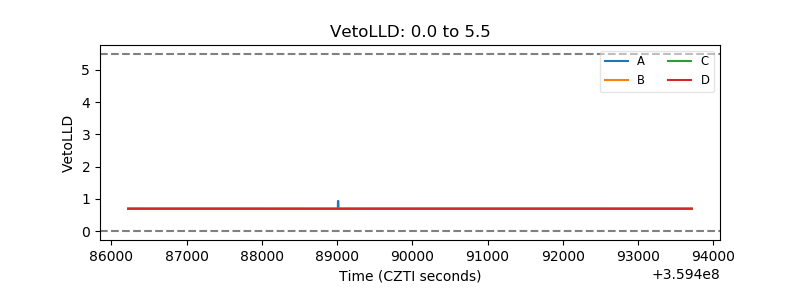 |
| Alpha Counter | 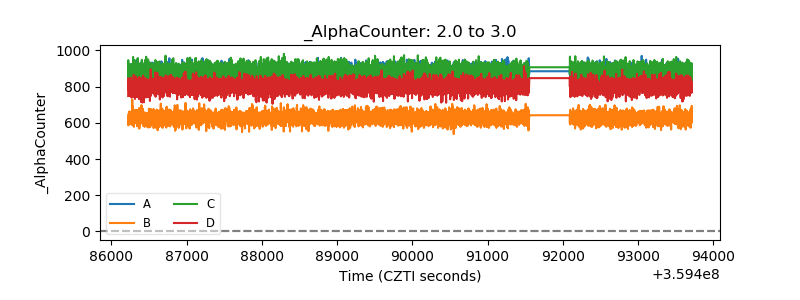 |
| _CPM_Rate | 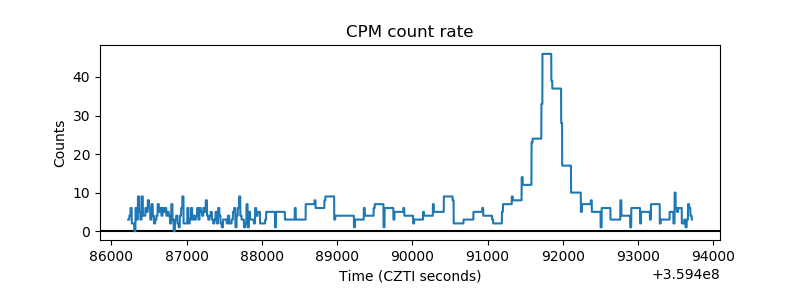 |
| CZT Counter |  |
| +2.5 Volts monitor |  |
| +5 Volts monitor |  |
| _ROLL_ROT | 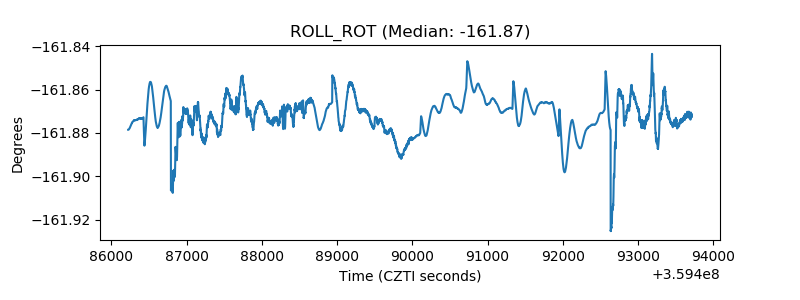 |
| _Roll_DEC | 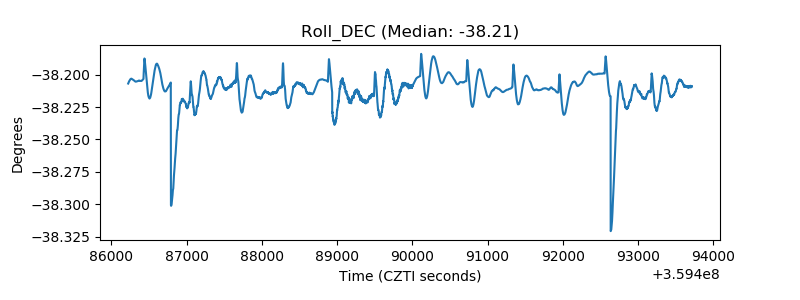 |
| _Roll_RA | 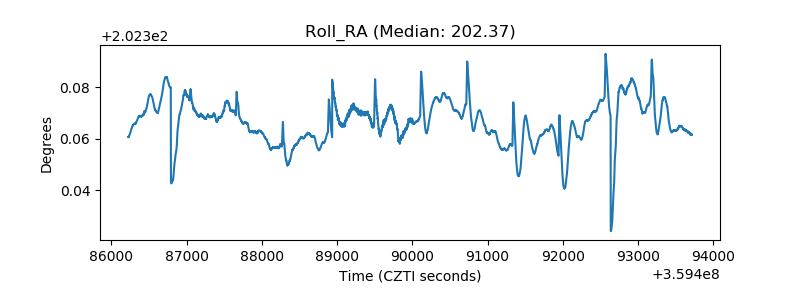 |
| Veto Counter | 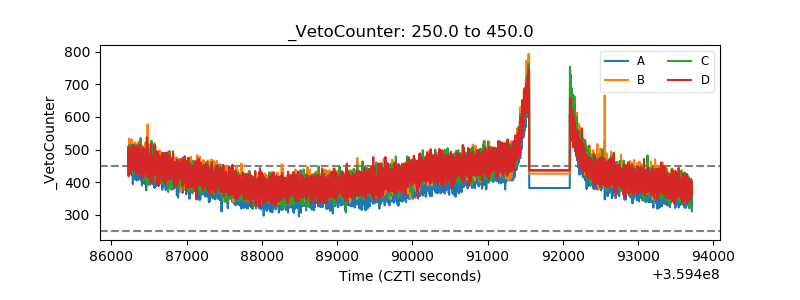 |