| Param | Original file | Final file |
|---|---|---|
| Filename | modeM0/AS1A10_055T01_9000004400_30561cztM0_level2.evt | modeM0/AS1A10_055T01_9000004400_30561cztM0_level2_quad_clean.evt |
| Size (bytes) | 192,519,360 | 45,668,160 |
| Size | 183.6 MB | 43.6 MB |
| Events in quadrant A | 1,181,867 | 313,111 |
| Events in quadrant B | 1,791,313 | 310,954 |
| Events in quadrant C | 1,224,200 | 296,384 |
| Events in quadrant D | 1,471,661 | 293,111 |
| Mode SS | |||
|---|---|---|---|
| Quadrant | BADHDUFLAG | Total packets | Discarded packets |
| A | 0 | 50 | 0 |
| B | 0 | 50 | 0 |
| C | 0 | 50 | 0 |
| D | 0 | 50 | 0 |
| Mode M0 | |||
|---|---|---|---|
| Quadrant | BADHDUFLAG | Total packets | Discarded packets |
| A | 0 | 5113 | 1 |
| B | 0 | 7118 | 1 |
| C | 0 | 5093 | 1 |
| D | 0 | 5933 | 1 |
| Mode M9 | |||
|---|---|---|---|
| Quadrant | BADHDUFLAG | Total packets | Discarded packets |
| A | 0 | 5 | 0 |
| B | 0 | 5 | 0 |
| C | 0 | 5 | 0 |
| D | 0 | 5 | 0 |
| Quadrant | Total seconds | Saturated seconds | Saturation percentage |
|---|---|---|---|
| A | 2342 | 56 | 2.391119% |
| B | 2342 | 83 | 3.543980% |
| C | 2343 | 52 | 2.219377% |
| D | 2343 | 54 | 2.304738% |
Noise dominated data is calculated using 1-second bins in cleaned event files. If a bin has >2000 counts, and if more than 50% of those come from <1% of pixels, then it is considered to be noise-dominated and hence unusable.
| Quadrant | # 1 sec bins | Bins with >0 counts | Bins with >2000 counts | High rate bins dominated by noise | Noise dominated (total time) | Noise dominated (detector-on time) | Marked lightcurve |
|---|---|---|---|---|---|---|---|
| A | 2882 | 2343 | 3 | 3 | 0.10% | 0.13% | 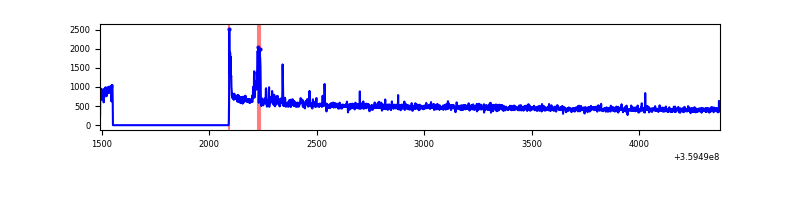 |
| B | 2882 | 2343 | 1 | 1 | 0.03% | 0.04% | 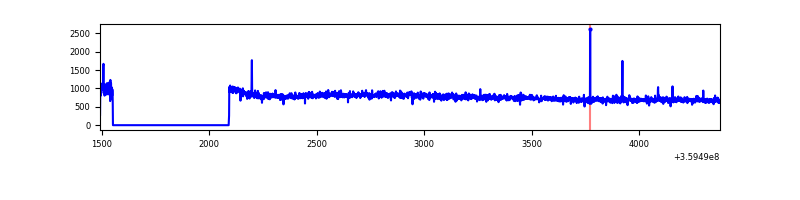 |
| C | 2883 | 2344 | 0 | 0 | 0.00% | 0.00% | 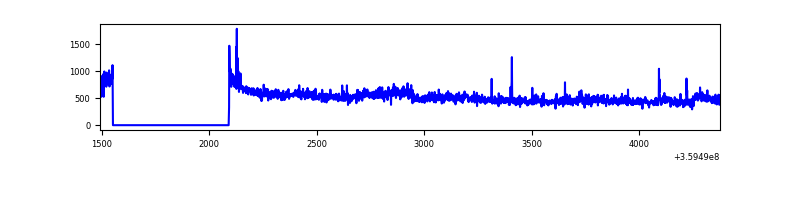 |
| D | 2883 | 2344 | 33 | 33 | 1.14% | 1.41% | 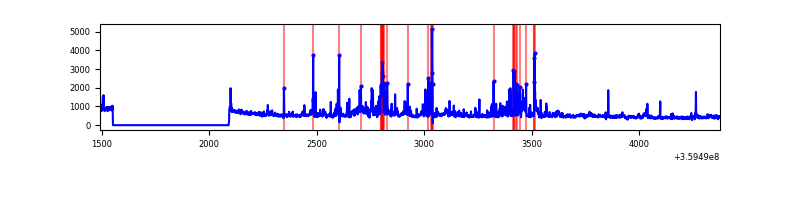 |
Top three noisy pixels from each quadrant. If the there are fewer than three noisy pixels in the level2.evt file, extra rows are filled as -1
| Pixel properties | Quadrant properties | ||||||
|---|---|---|---|---|---|---|---|
| Quadrant | DetID | PixID | Counts | Sigma | Mean | Median | Sigma |
| A | 12 | 96 | 47816 | 795.6 | 290 | 284 | 59.7 |
| A | 8 | 192 | 11323 | 184.77 | 290 | 284 | 59.7 |
| A | 13 | 254 | 4275 | 66.8 | 290 | 284 | 59.7 |
| B | 6 | 159 | 653013 | 11565.89 | 284 | 277 | 56.4 |
| B | 0 | 190 | 10652 | 183.84 | 284 | 277 | 56.4 |
| B | 12 | 111 | 6682 | 113.49 | 284 | 277 | 56.4 |
| C | 3 | 233 | 119096 | 1845.85 | 268 | 269 | 64.4 |
| C | 14 | 238 | 42776 | 660.3 | 268 | 269 | 64.4 |
| C | 0 | 10 | 8702 | 130.99 | 268 | 269 | 64.4 |
| D | 13 | 249 | 140478 | 2082.51 | 275 | 268 | 67.3 |
| D | 1 | 52 | 133313 | 1976.09 | 275 | 268 | 67.3 |
| D | 8 | 195 | 78788 | 1166.24 | 275 | 268 | 67.3 |
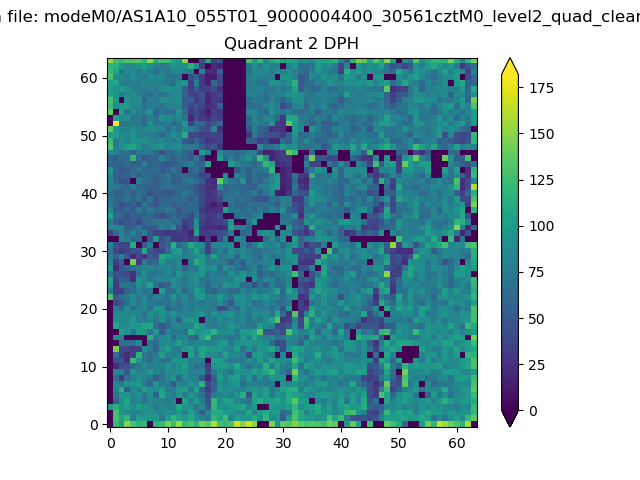
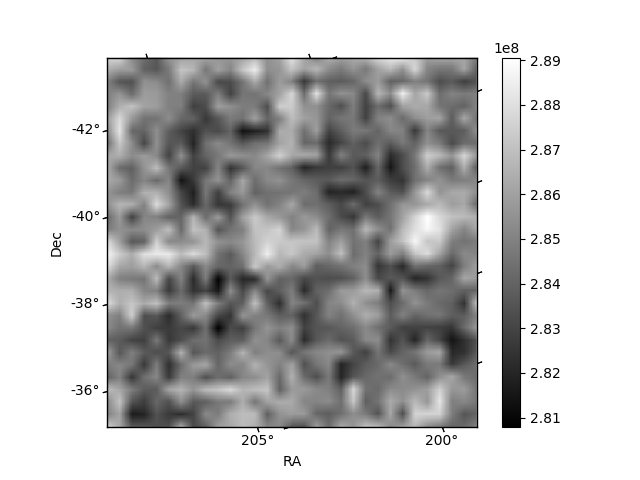
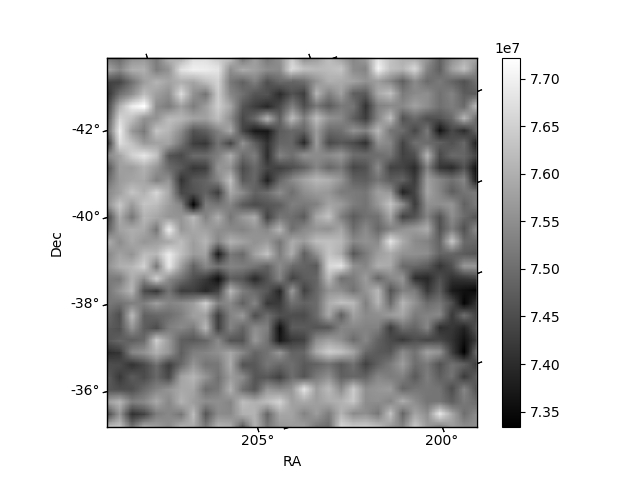
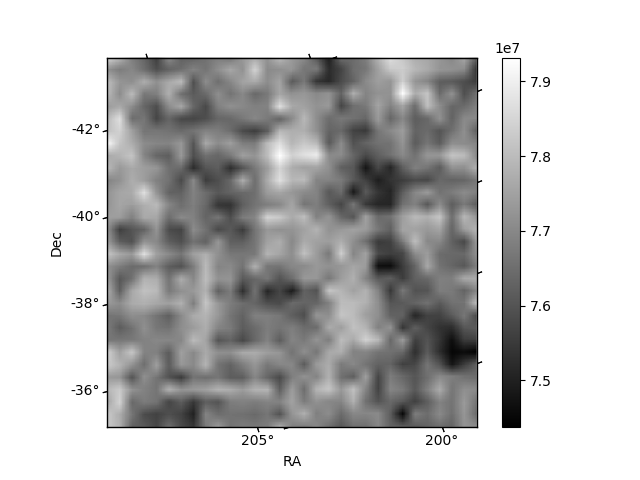
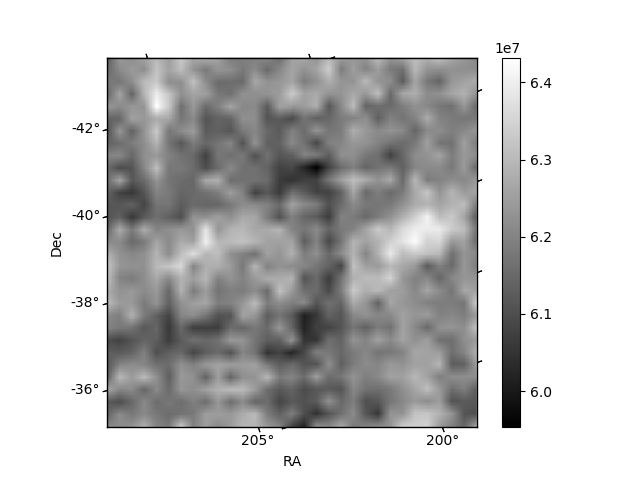
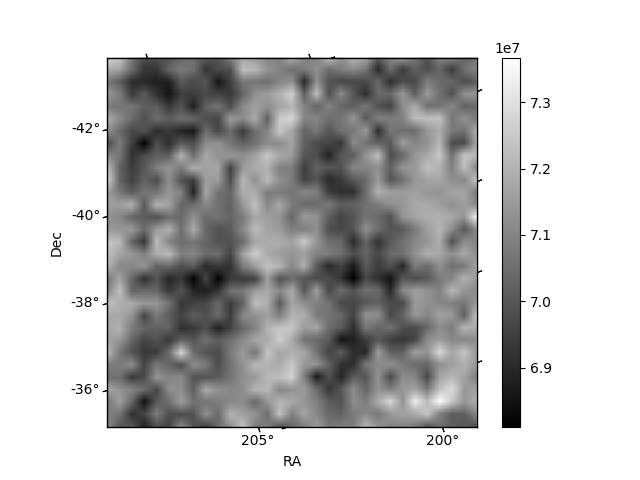
Histogram calculated using DETX and DETY for each event in the final _common_clean file
| Quadrant A | 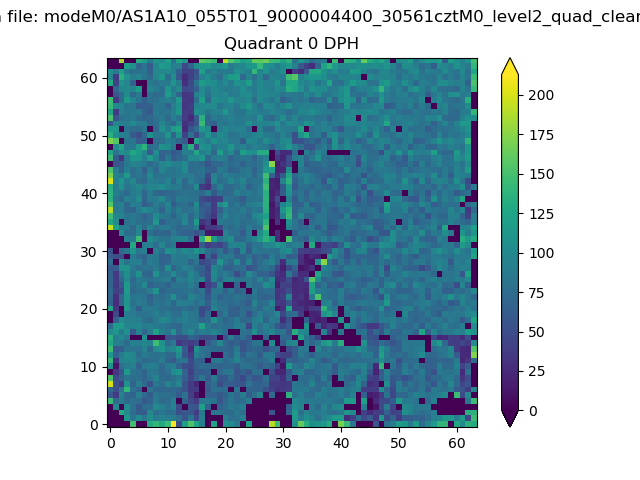 |
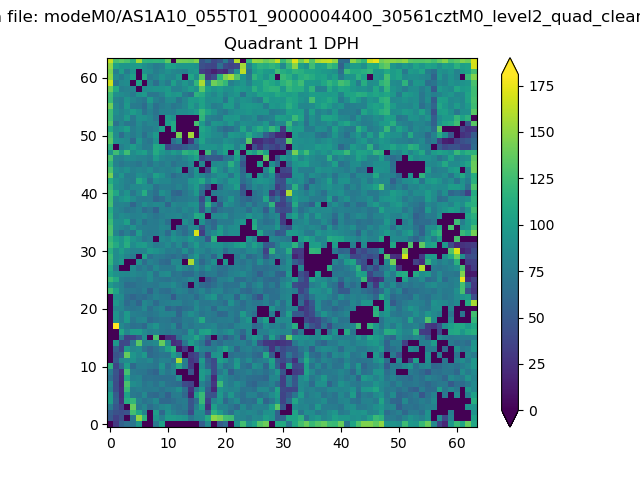 |
Quadrant B |
|---|---|---|---|
| Quadrant D | 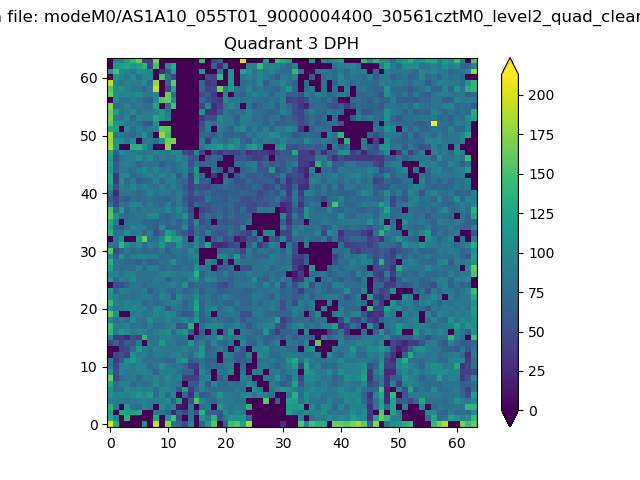 |
 |
Quadrant C |
| Plot type | Count rate plots | Images |
|---|---|---|
| Comparison with Poisson distribution Blue bars denote a histogram of data divided into 1 sec bins. Red curve is a Poisson curve with rate = median count rate of data. |
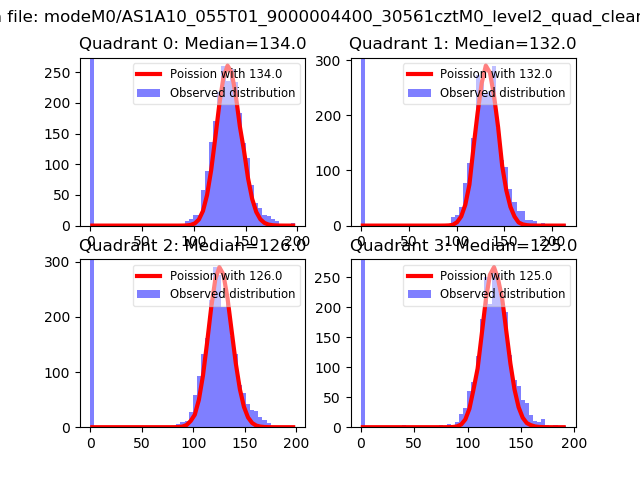 |
 |
| Quadrant-wise count rates Data is divided into 100 sec bins |
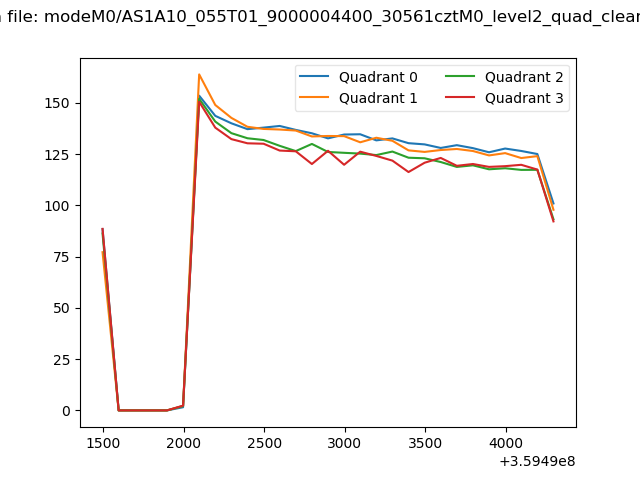 |
|
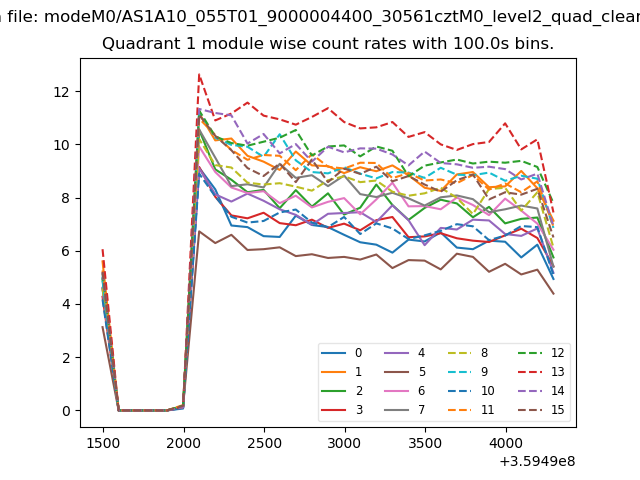
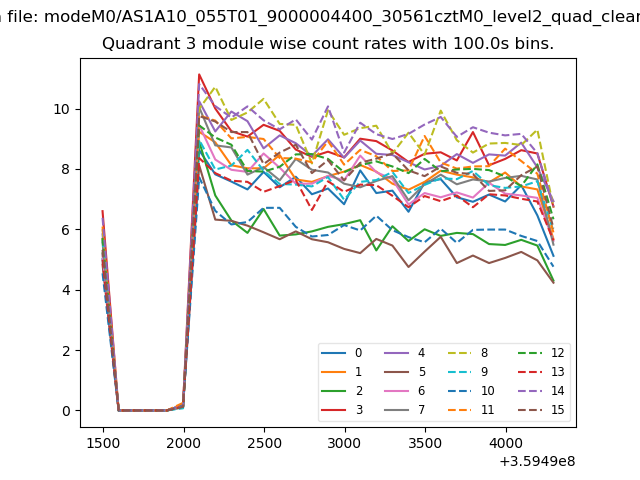
| Module-wise count rates for Quadrant A Data is divided into 100 sec bins |
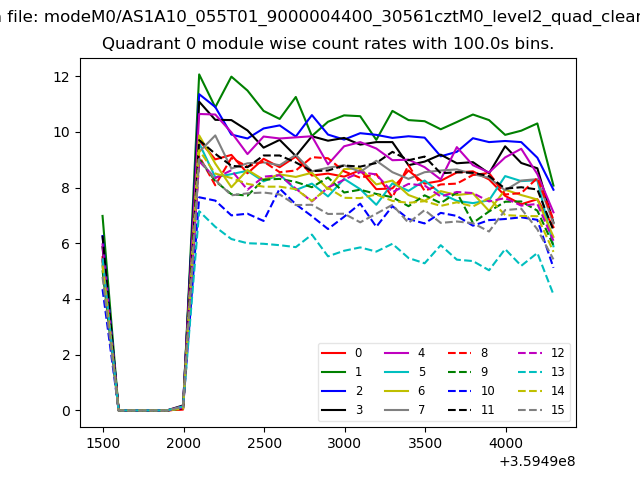 |
 |
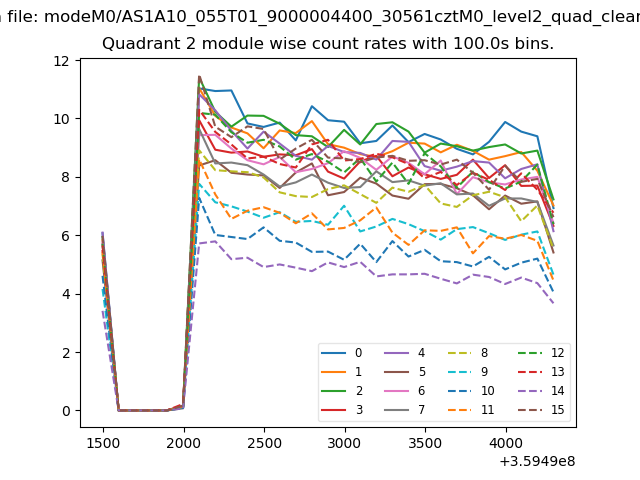
| Module-wise count rates for Quadrant B Data is divided into 100 sec bins |
 |
 |
| Module-wise count rates for Quadrant C Data is divided into 100 sec bins |
 |
 |
| Module-wise count rates for Quadrant D Data is divided into 100 sec bins |
 |
 |
| Parameter | Plot |
|---|---|
| CZT HV Monitor | 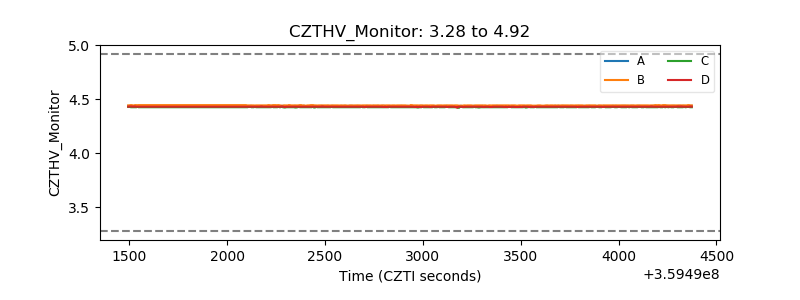 |
| D_VDD | 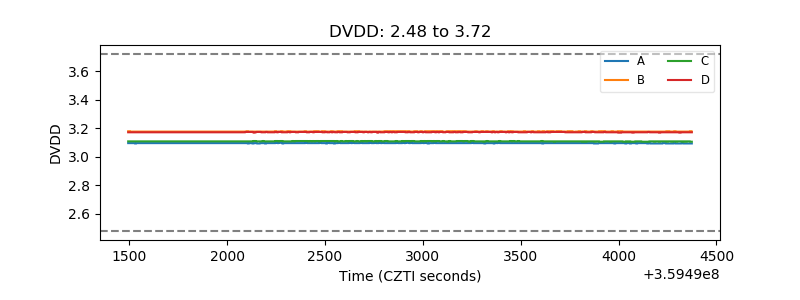 |
| Temperature 1 | 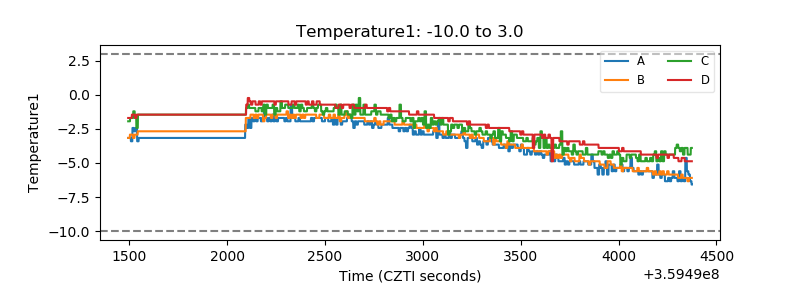 |
| Veto HV Monitor | 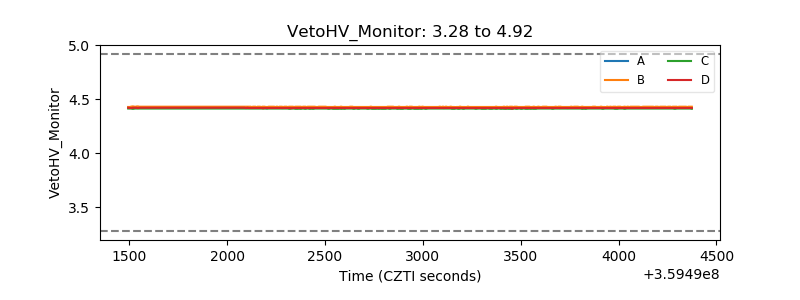 |
| Veto LLD | 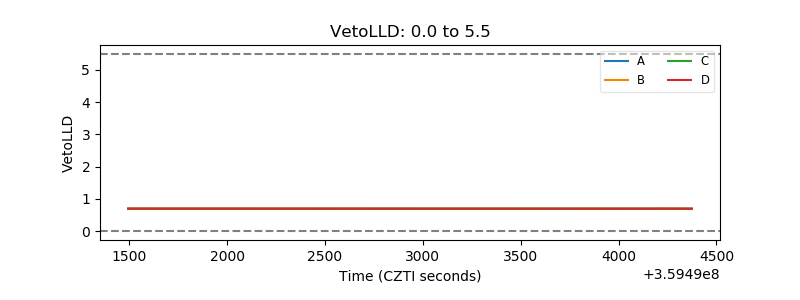 |
| Alpha Counter | 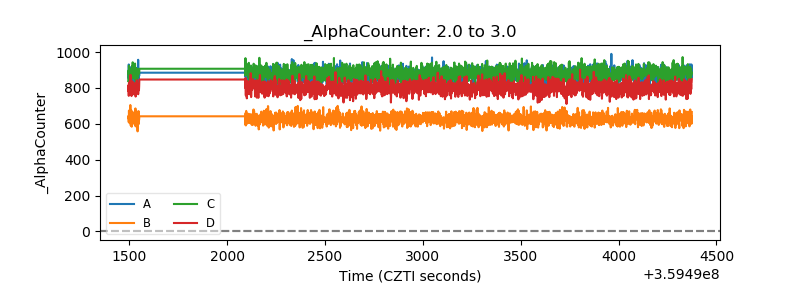 |
| _CPM_Rate | 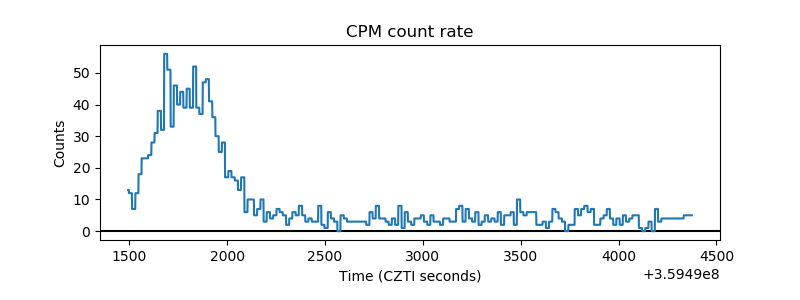 |
| CZT Counter | 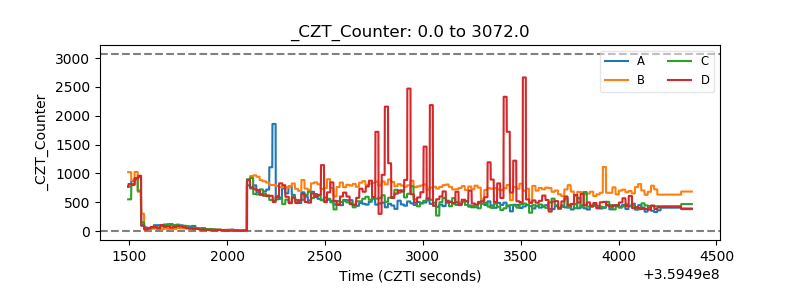 |
| +2.5 Volts monitor |  |
| +5 Volts monitor | 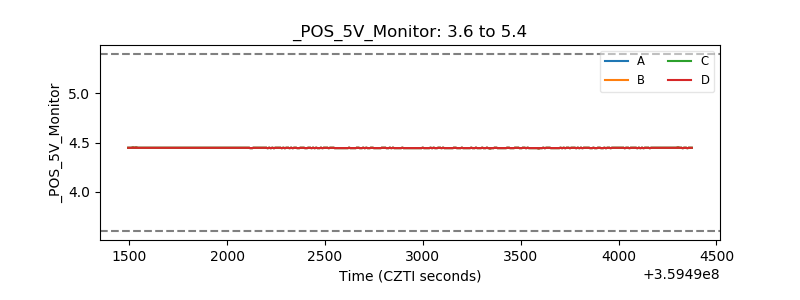 |
| _ROLL_ROT | 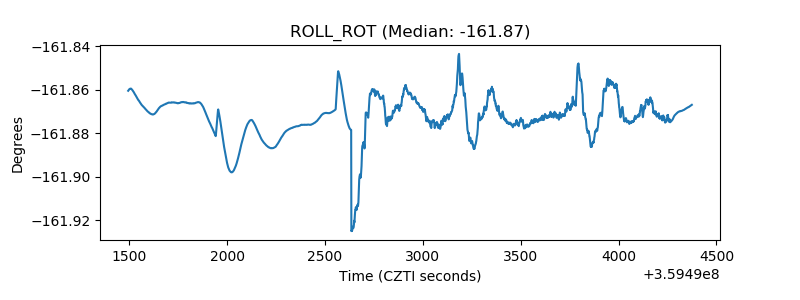 |
| _Roll_DEC |  |
| _Roll_RA | 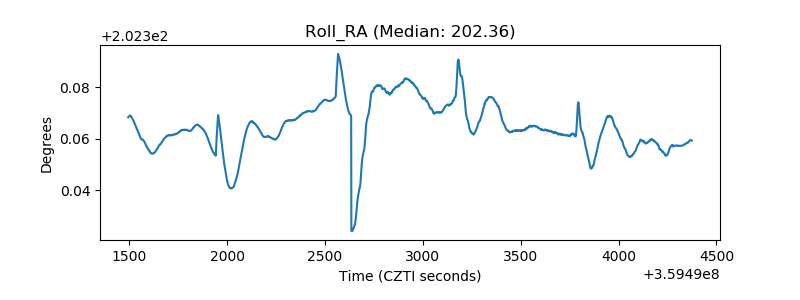 |
| Veto Counter | 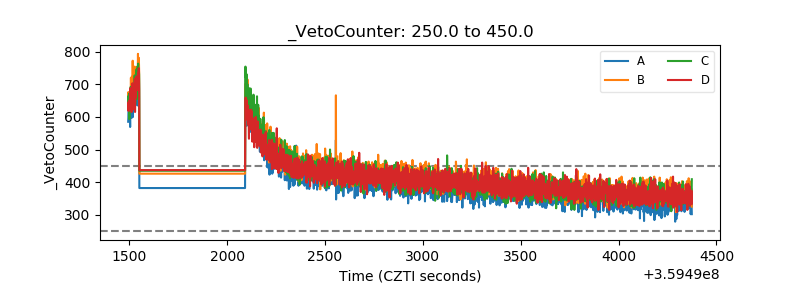 |