| Param | Original file | Final file |
|---|---|---|
| Filename | modeM0/AS1A10_094T78_9000004402cztM0_level2.fits | modeM0/AS1A10_094T78_9000004402cztM0_level2_quad_clean.evt |
| Size (bytes) | 355,720,320 | 427,438,080 |
| Size | 339.2 MB | 407.6 MB |
| Events in quadrant A | 2,216,411 | 2,767,548 |
| Events in quadrant B | 2,060,292 | 2,712,536 |
| Events in quadrant C | 2,116,081 | 2,584,465 |
| Events in quadrant D | 1,860,720 | 2,362,603 |
| Mode M0 | |||
|---|---|---|---|
| Quadrant | BADHDUFLAG | Total packets | Discarded packets |
| A | 0 | 75559 | 0 |
| B | 0 | 111219 | 0 |
| C | 0 | 78647 | 0 |
| D | 0 | 104068 | 0 |
| Mode SS | |||
|---|---|---|---|
| Quadrant | BADHDUFLAG | Total packets | Discarded packets |
| A | 0 | 740 | 0 |
| B | 0 | 742 | 0 |
| C | 0 | 740 | 0 |
| D | 0 | 742 | 0 |
| Mode M9 | |||
|---|---|---|---|
| Quadrant | BADHDUFLAG | Total packets | Discarded packets |
| A | 0 | 47 | 0 |
| B | 0 | 47 | 0 |
| C | 0 | 47 | 0 |
| D | 0 | 47 | 0 |
| Quadrant | Total seconds | Saturated seconds | Saturation percentage |
|---|---|---|---|
| A | 36715 | 387 | 1.054065% |
| B | 36652 | 800 | 2.182691% |
| C | 36722 | 861 | 2.344644% |
| D | 36659 | 1638 | 4.468207% |
Noise dominated data is calculated using 1-second bins in cleaned event files. If a bin has >2000 counts, and if more than 50% of those come from <1% of pixels, then it is considered to be noise-dominated and hence unusable.
| Quadrant | # 1 sec bins | Bins with >0 counts | Bins with >2000 counts | High rate bins dominated by noise | Noise dominated (total time) | Noise dominated (detector-on time) | Marked lightcurve |
|---|---|---|---|---|---|---|---|
| A | 36259 | 34548 | 0 | 0 | 0.00% | 0.00% | 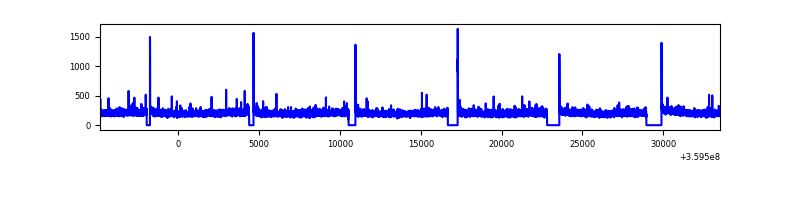 |
| B | 36259 | 34547 | 0 | 0 | 0.00% | 0.00% |  |
| C | 36259 | 34546 | 0 | 0 | 0.00% | 0.00% | 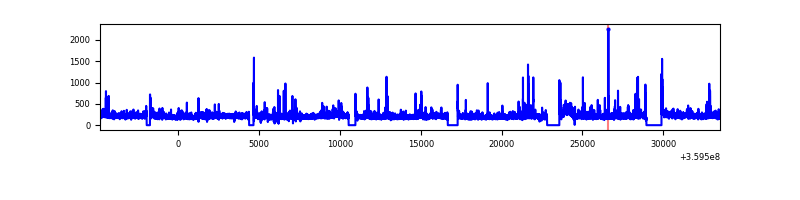 |
| D | 36259 | 34544 | 0 | 0 | 0.00% | 0.00% |  |
Top three noisy pixels from each quadrant. If the there are fewer than three noisy pixels in the level2.evt file, extra rows are filled as -1
| Pixel properties | Quadrant properties | ||||||
|---|---|---|---|---|---|---|---|
| Quadrant | DetID | PixID | Counts | Sigma | Mean | Median | Sigma |
| A | 0 | 29 | 2108 | 10.95 | 578 | 544 | 142.8 |
| A | 7 | 110 | 1683 | 7.97 | 578 | 544 | 142.8 |
| A | 9 | 19 | 1656 | 7.79 | 578 | 544 | 142.8 |
| B | 2 | 9 | 1703 | 10.81 | 545 | 520 | 109.4 |
| B | 2 | 8 | 1406 | 8.1 | 545 | 520 | 109.4 |
| B | 3 | 17 | 1373 | 7.79 | 545 | 520 | 109.4 |
| C | 1 | 81 | 1686 | 8.23 | 559 | 524 | 141.1 |
| C | 1 | 80 | 1642 | 7.92 | 559 | 524 | 141.1 |
| C | 12 | 241 | 1577 | 7.46 | 559 | 524 | 141.1 |
| D | 15 | 46 | 1525 | 7.38 | 531 | 484 | 141.1 |
| D | 3 | 14 | 1370 | 6.28 | 531 | 484 | 141.1 |
| D | 7 | 3 | 1309 | 5.85 | 531 | 484 | 141.1 |
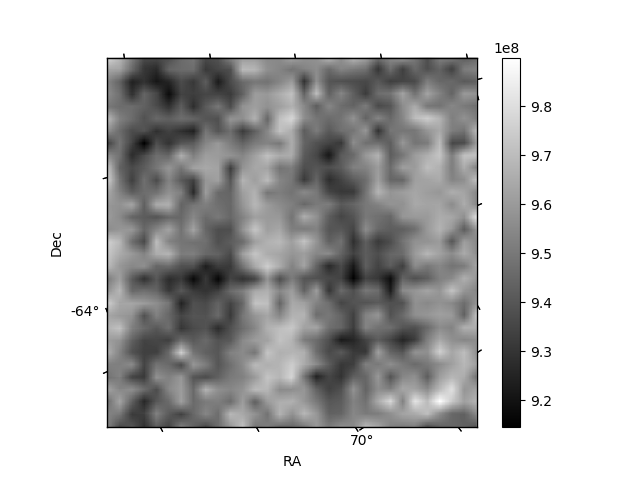
Histogram calculated using DETX and DETY for each event in the final _common_clean file
| Quadrant A | 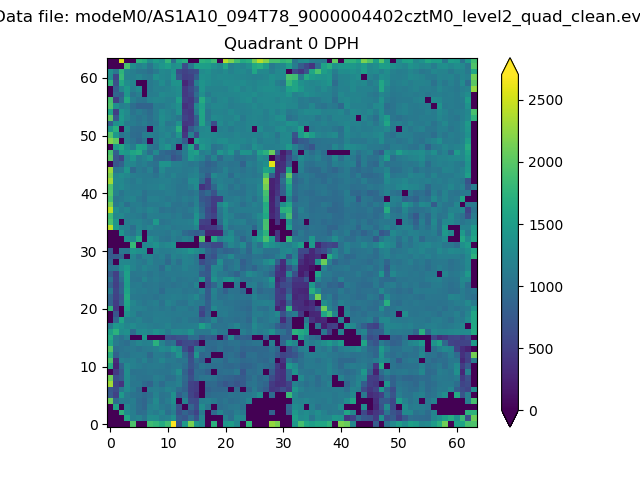 |
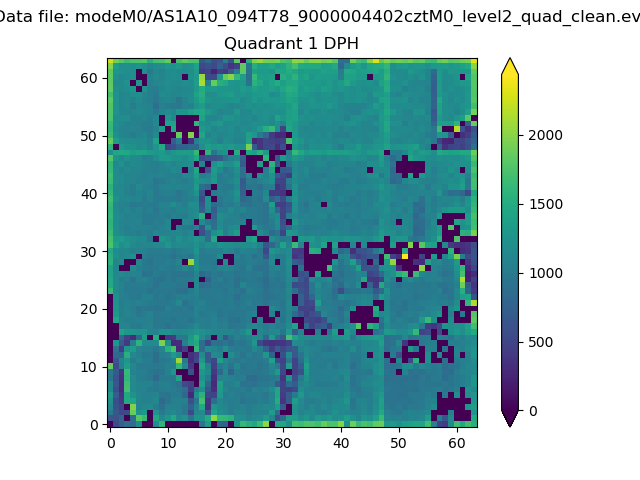 |
Quadrant B |
|---|---|---|---|
| Quadrant D |  |
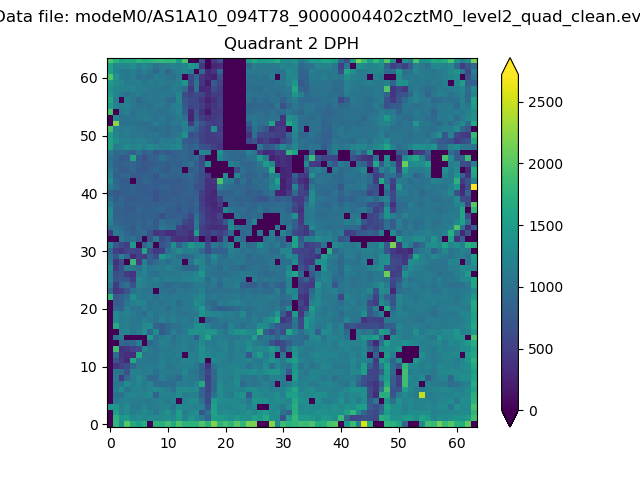 |
Quadrant C |
| Plot type | Count rate plots | Images |
|---|---|---|
| Comparison with Poisson distribution Blue bars denote a histogram of data divided into 1 sec bins. Red curve is a Poisson curve with rate = median count rate of data. |
 |
 |
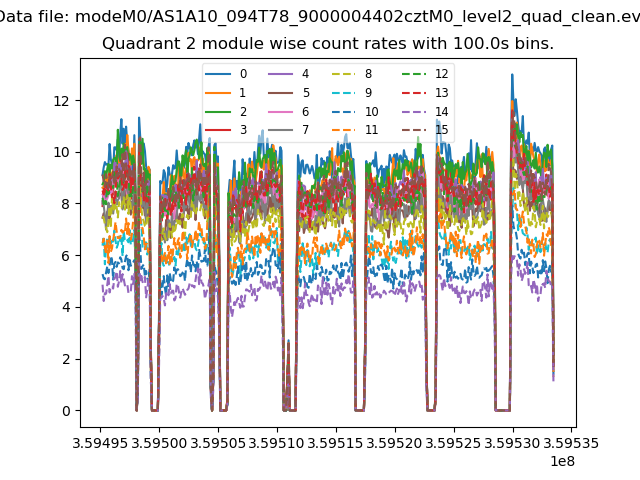
| Quadrant-wise count rates Data is divided into 100 sec bins |
 |
|
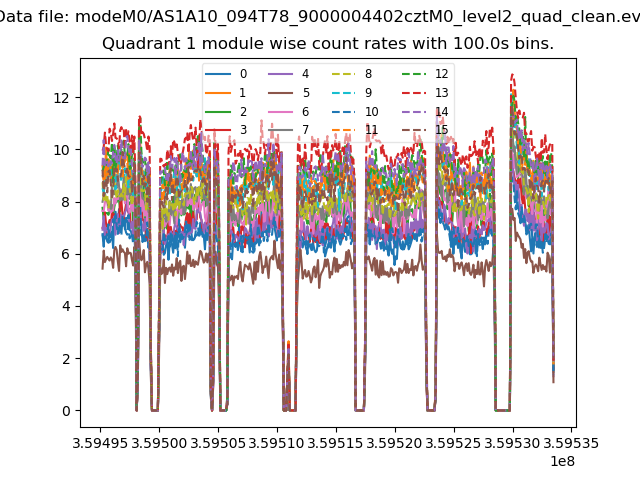
| Module-wise count rates for Quadrant A Data is divided into 100 sec bins |
 |
 |
| Module-wise count rates for Quadrant B Data is divided into 100 sec bins |
 |
 |
| Module-wise count rates for Quadrant C Data is divided into 100 sec bins |
 |
 |
| Module-wise count rates for Quadrant D Data is divided into 100 sec bins |
 |
 |
| Parameter | Plot |
|---|---|
| CZT HV Monitor |  |
| D_VDD | 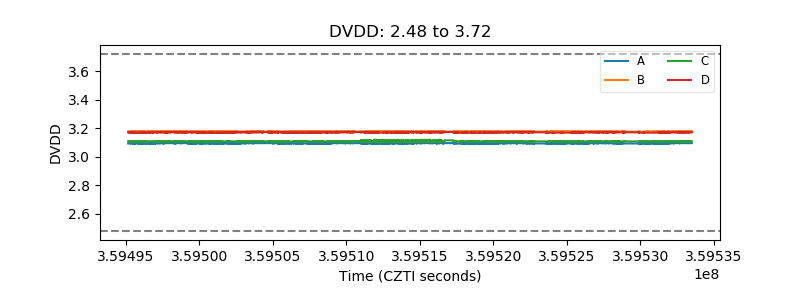 |
| Temperature 1 |  |
| Veto HV Monitor |  |
| Veto LLD |  |
| Alpha Counter |  |
| _CPM_Rate | 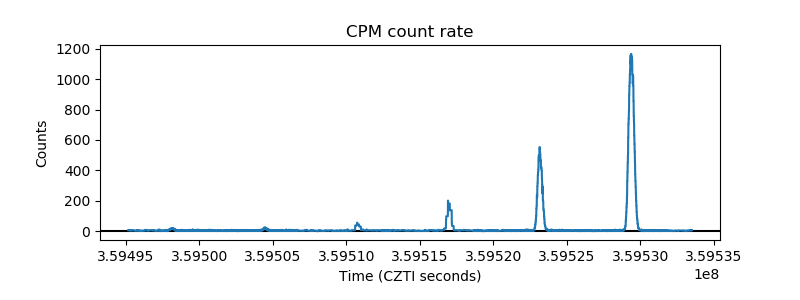 |
| CZT Counter |  |
| +2.5 Volts monitor |  |
| +5 Volts monitor |  |
| _ROLL_ROT |  |
| _Roll_DEC |  |
| _Roll_RA | 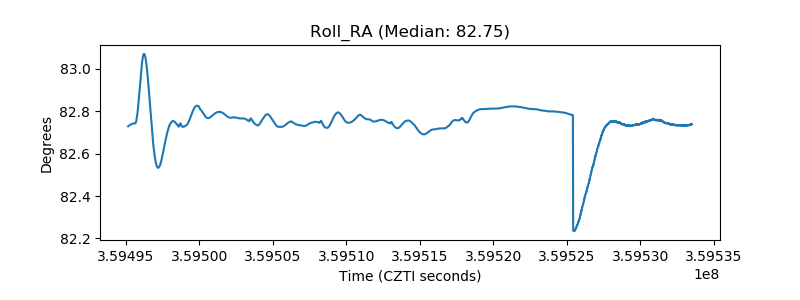 |
| Veto Counter |  |