| Param | Original file | Final file |
|---|---|---|
| Filename | modeM0/AS1A10_094T78_9000004402_30565cztM0_level2.evt | modeM0/AS1A10_094T78_9000004402_30565cztM0_level2_quad_clean.evt |
| Size (bytes) | 1,377,331,200 | 283,570,560 |
| Size | 1.3 GB | 270.4 MB |
| Events in quadrant A | 7,693,137 | 1,917,615 |
| Events in quadrant B | 12,486,736 | 1,895,684 |
| Events in quadrant C | 8,143,158 | 1,835,292 |
| Events in quadrant D | 12,265,695 | 1,791,207 |
| Mode M0 | |||
|---|---|---|---|
| Quadrant | BADHDUFLAG | Total packets | Discarded packets |
| A | 0 | 33883 | 3 |
| B | 0 | 50326 | 3 |
| C | 0 | 34546 | 4 |
| D | 0 | 47560 | 3 |
| Mode SS | |||
|---|---|---|---|
| Quadrant | BADHDUFLAG | Total packets | Discarded packets |
| A | 0 | 336 | 0 |
| B | 0 | 336 | 0 |
| C | 0 | 336 | 0 |
| D | 0 | 336 | 0 |
| Mode M9 | |||
|---|---|---|---|
| Quadrant | BADHDUFLAG | Total packets | Discarded packets |
| A | 0 | 12 | 0 |
| B | 0 | 13 | 0 |
| C | 0 | 13 | 0 |
| D | 0 | 13 | 0 |
| Quadrant | Total seconds | Saturated seconds | Saturation percentage |
|---|---|---|---|
| A | 16673 | 126 | 0.755713% |
| B | 16673 | 259 | 1.553410% |
| C | 16672 | 309 | 1.853407% |
| D | 16672 | 896 | 5.374280% |
Noise dominated data is calculated using 1-second bins in cleaned event files. If a bin has >2000 counts, and if more than 50% of those come from <1% of pixels, then it is considered to be noise-dominated and hence unusable.
| Quadrant | # 1 sec bins | Bins with >0 counts | Bins with >2000 counts | High rate bins dominated by noise | Noise dominated (total time) | Noise dominated (detector-on time) | Marked lightcurve |
|---|---|---|---|---|---|---|---|
| A | 17708 | 16675 | 2 | 2 | 0.01% | 0.01% | 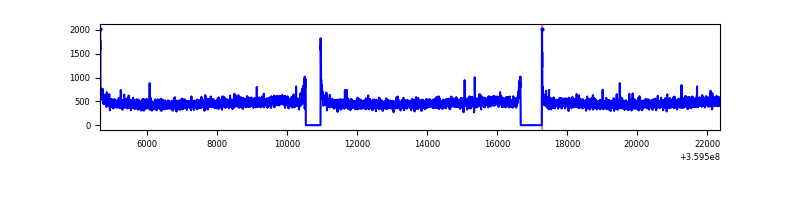 |
| B | 17708 | 16675 | 20 | 20 | 0.11% | 0.12% | 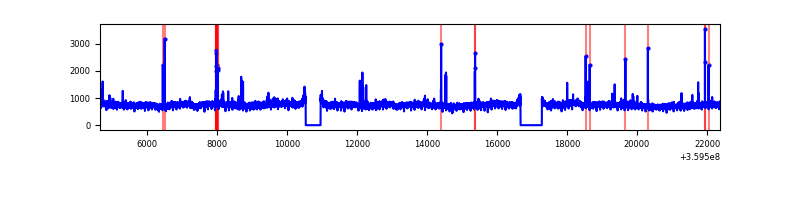 |
| C | 17707 | 16674 | 2 | 2 | 0.01% | 0.01% | 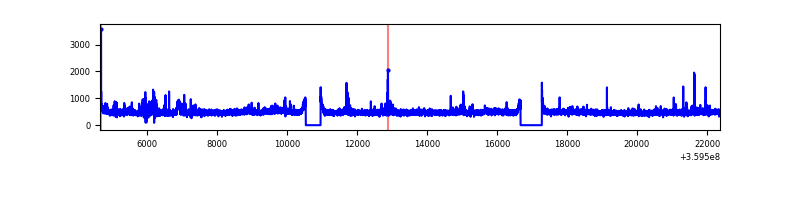 |
| D | 17707 | 16674 | 798 | 798 | 4.51% | 4.79% | 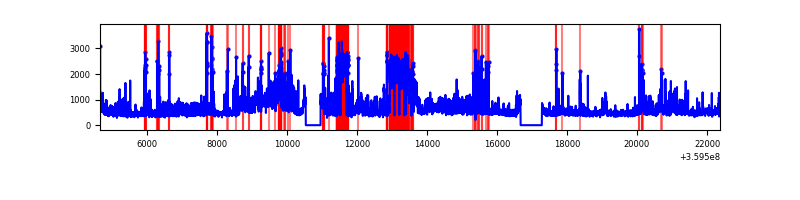 |
Top three noisy pixels from each quadrant. If the there are fewer than three noisy pixels in the level2.evt file, extra rows are filled as -1
| Pixel properties | Quadrant properties | ||||||
|---|---|---|---|---|---|---|---|
| Quadrant | DetID | PixID | Counts | Sigma | Mean | Median | Sigma |
| A | 8 | 192 | 39965 | 95.75 | 1984 | 1936 | 397.2 |
| A | 13 | 254 | 26532 | 61.93 | 1984 | 1936 | 397.2 |
| A | 3 | 137 | 19892 | 45.21 | 1984 | 1936 | 397.2 |
| B | 6 | 159 | 4674173 | 12677.42 | 1948 | 1895 | 368.6 |
| B | 4 | 171 | 71996 | 190.21 | 1948 | 1895 | 368.6 |
| B | 12 | 111 | 46706 | 121.59 | 1948 | 1895 | 368.6 |
| C | 14 | 238 | 354806 | 809.72 | 1886 | 1895 | 435.8 |
| C | 3 | 233 | 241312 | 549.32 | 1886 | 1895 | 435.8 |
| C | 14 | 254 | 63146 | 140.53 | 1886 | 1895 | 435.8 |
| D | 1 | 52 | 4053460 | 9080.44 | 1902 | 1854 | 446.2 |
| D | 8 | 195 | 657263 | 1468.9 | 1902 | 1854 | 446.2 |
| D | 13 | 249 | 174353 | 386.6 | 1902 | 1854 | 446.2 |
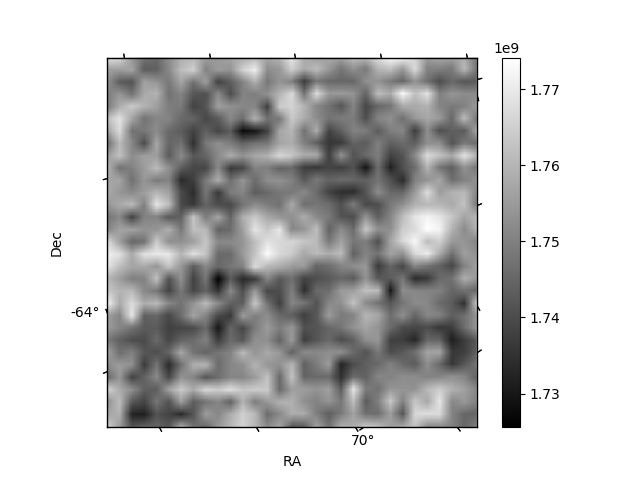
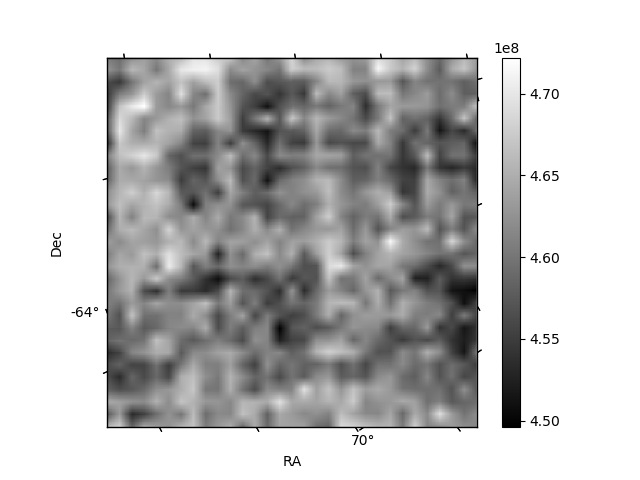
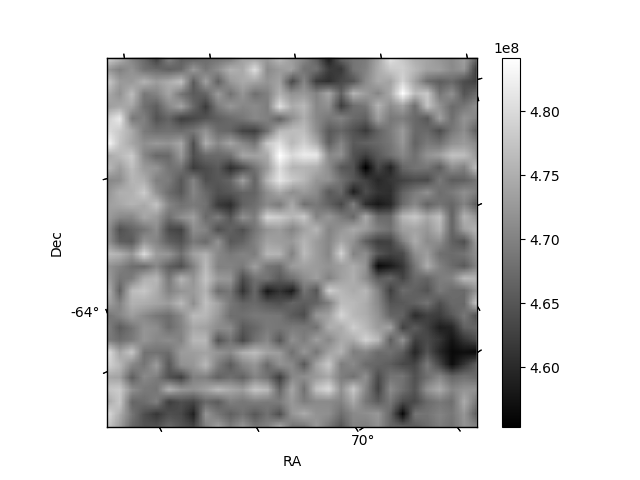
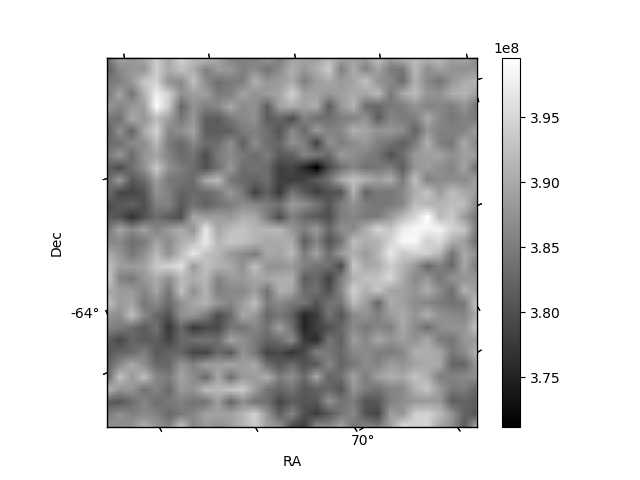
Histogram calculated using DETX and DETY for each event in the final _common_clean file
| Quadrant A |  |
 |
Quadrant B |
|---|---|---|---|
| Quadrant D |  |
 |
Quadrant C |
| Plot type | Count rate plots | Images |
|---|---|---|
| Comparison with Poisson distribution Blue bars denote a histogram of data divided into 1 sec bins. Red curve is a Poisson curve with rate = median count rate of data. |
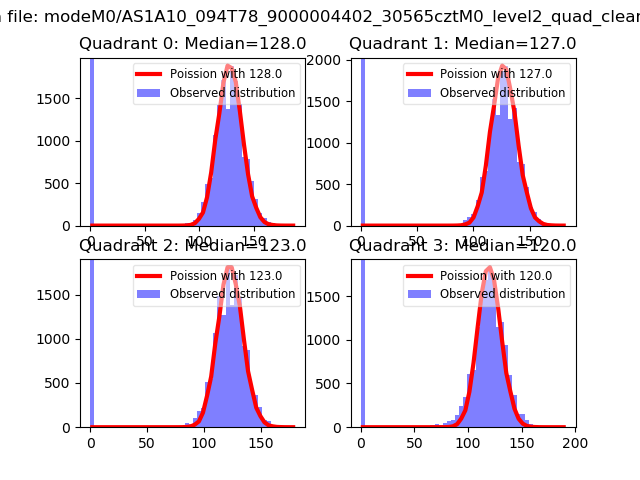 |
 |
| Quadrant-wise count rates Data is divided into 100 sec bins |
 |
|
| Module-wise count rates for Quadrant A Data is divided into 100 sec bins |
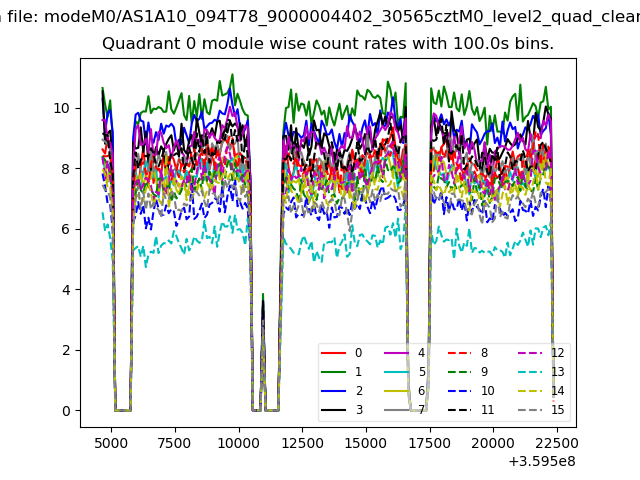 |
 |
| Module-wise count rates for Quadrant B Data is divided into 100 sec bins |
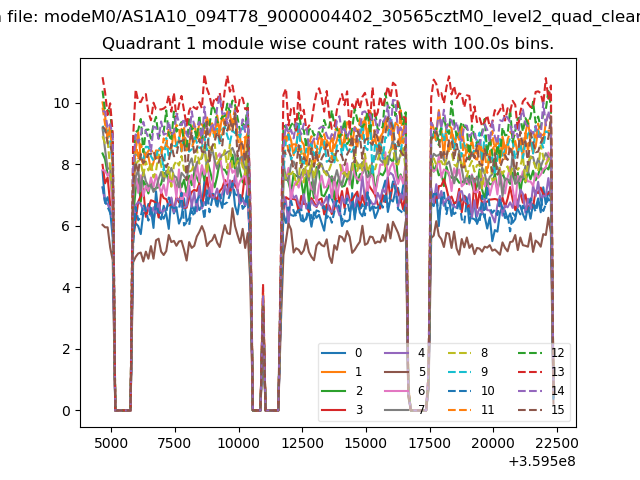 |
 |
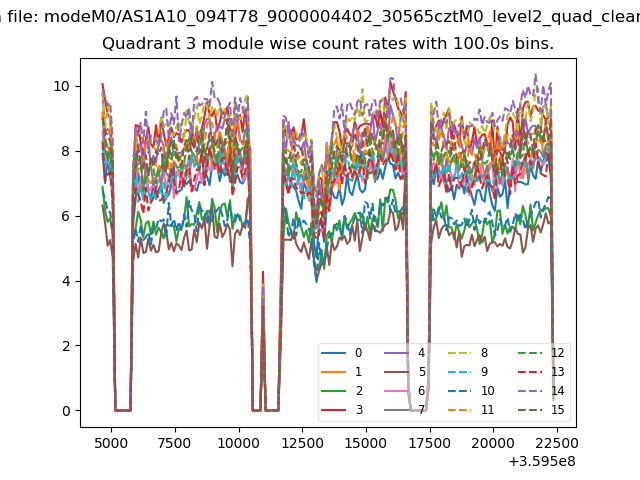
| Module-wise count rates for Quadrant C Data is divided into 100 sec bins |
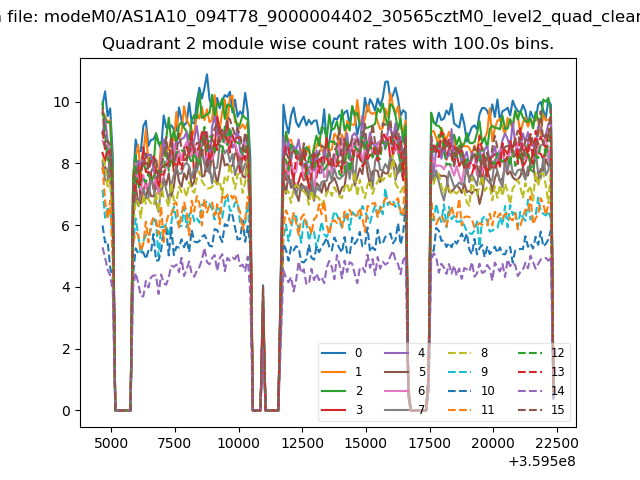 |
 |
| Module-wise count rates for Quadrant D Data is divided into 100 sec bins |
 |
 |
| Parameter | Plot |
|---|---|
| CZT HV Monitor |  |
| D_VDD | 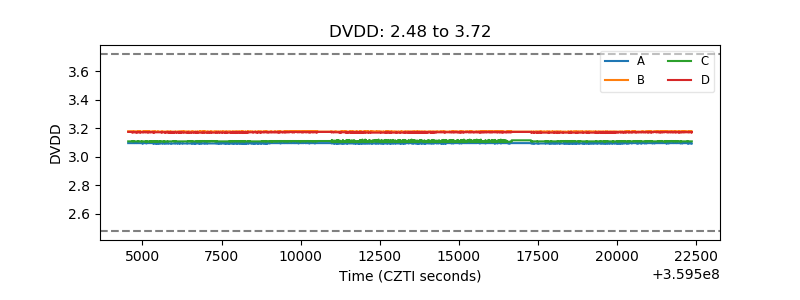 |
| Temperature 1 | 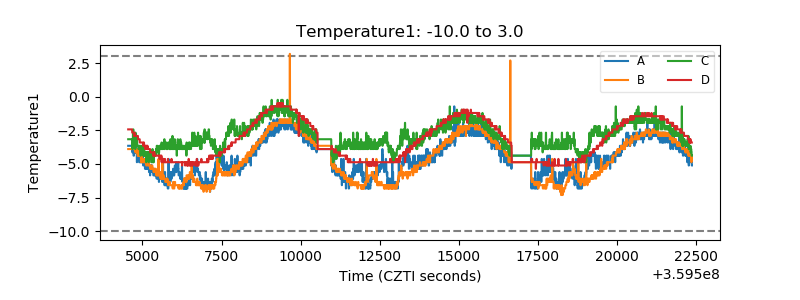 |
| Veto HV Monitor | 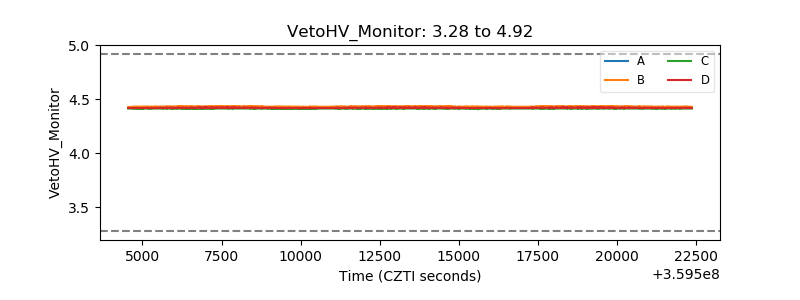 |
| Veto LLD | 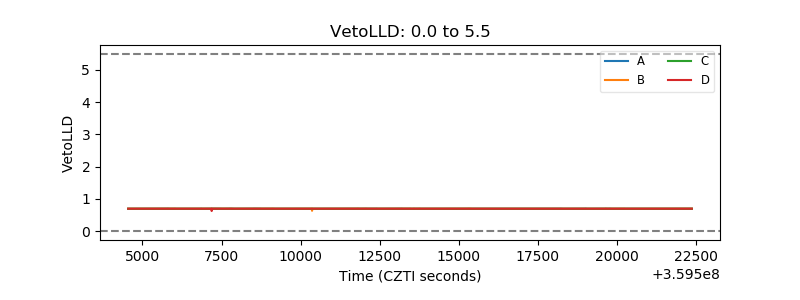 |
| Alpha Counter | 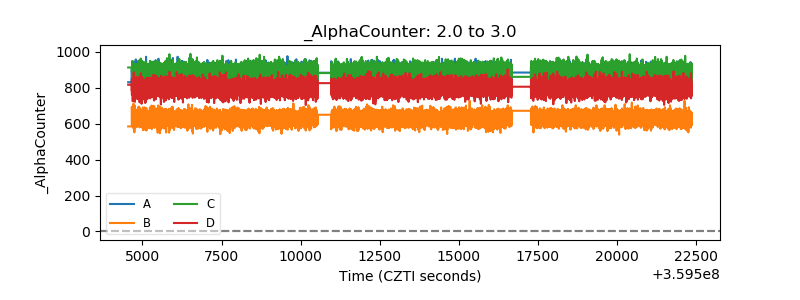 |
| _CPM_Rate | 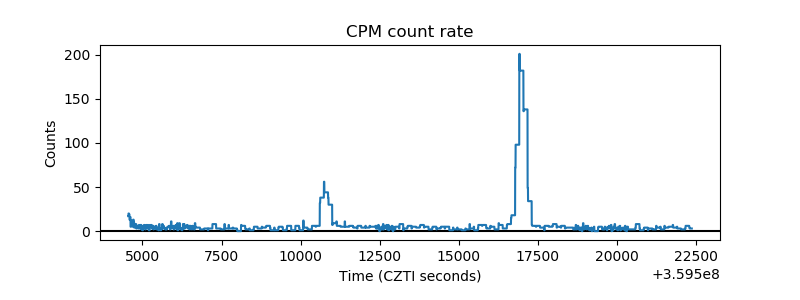 |
| CZT Counter | 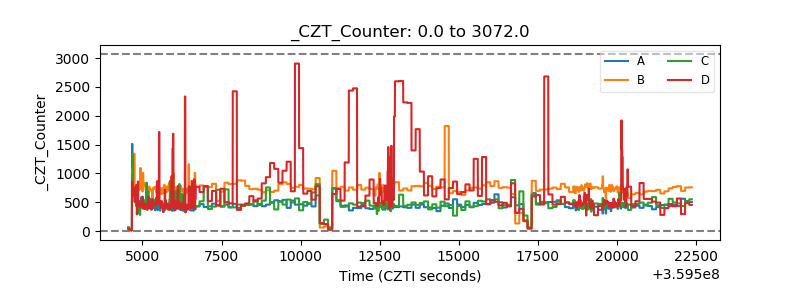 |
| +2.5 Volts monitor | 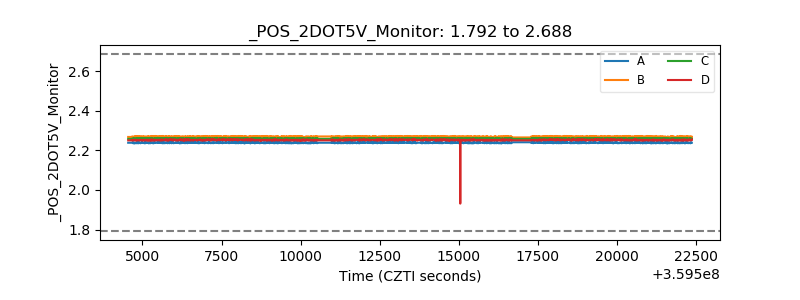 |
| +5 Volts monitor | 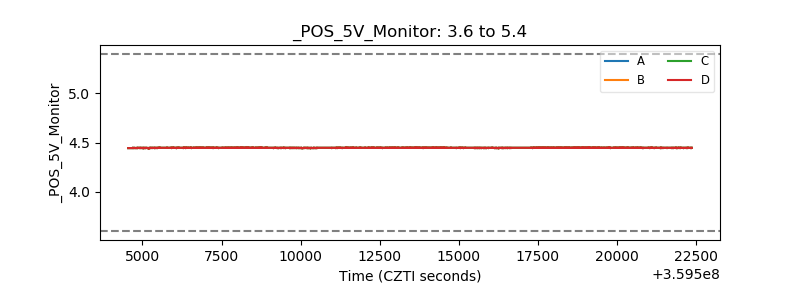 |
| _ROLL_ROT | 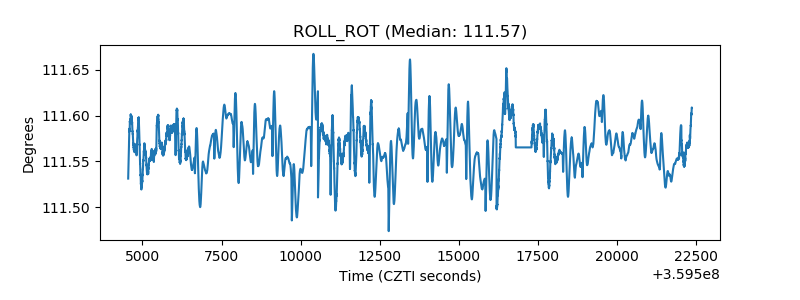 |
| _Roll_DEC | 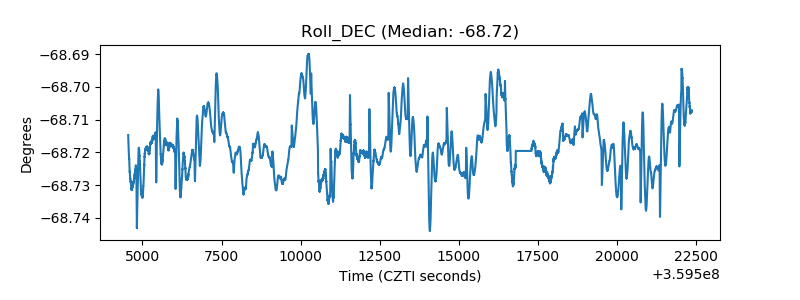 |
| _Roll_RA | 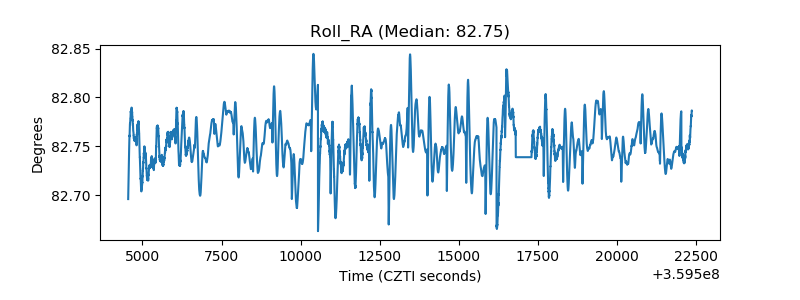 |
| Veto Counter | 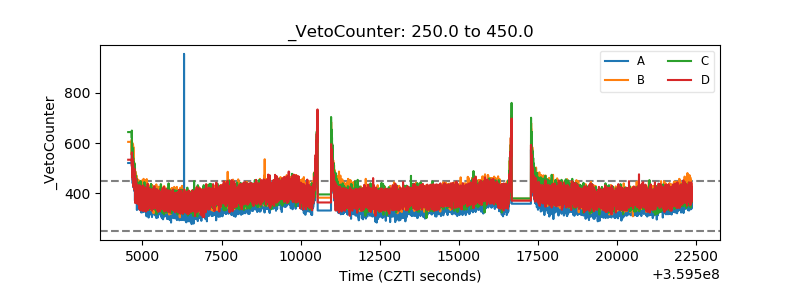 |