| Param | Original file | Final file |
|---|---|---|
| Filename | modeM0/AS1A10_094T78_9000004402_30566cztM0_level2.evt | modeM0/AS1A10_094T78_9000004402_30566cztM0_level2_quad_clean.evt |
| Size (bytes) | 650,810,880 | 154,716,480 |
| Size | 620.7 MB | 147.5 MB |
| Events in quadrant A | 4,014,536 | 1,050,008 |
| Events in quadrant B | 6,274,116 | 1,043,790 |
| Events in quadrant C | 4,413,930 | 1,011,386 |
| Events in quadrant D | 4,443,594 | 1,002,788 |
| Mode M0 | |||
|---|---|---|---|
| Quadrant | BADHDUFLAG | Total packets | Discarded packets |
| A | 0 | 17108 | 2 |
| B | 0 | 25081 | 2 |
| C | 0 | 18339 | 2 |
| D | 0 | 18294 | 2 |
| Mode SS | |||
|---|---|---|---|
| Quadrant | BADHDUFLAG | Total packets | Discarded packets |
| A | 0 | 168 | 0 |
| B | 0 | 168 | 0 |
| C | 0 | 168 | 0 |
| D | 0 | 168 | 0 |
| Mode M9 | |||
|---|---|---|---|
| Quadrant | BADHDUFLAG | Total packets | Discarded packets |
| A | 0 | 17 | 0 |
| B | 0 | 17 | 0 |
| C | 0 | 17 | 0 |
| D | 0 | 17 | 0 |
| Quadrant | Total seconds | Saturated seconds | Saturation percentage |
|---|---|---|---|
| A | 8325 | 118 | 1.417417% |
| B | 8326 | 177 | 2.125871% |
| C | 8326 | 234 | 2.810473% |
| D | 8326 | 121 | 1.453279% |
Noise dominated data is calculated using 1-second bins in cleaned event files. If a bin has >2000 counts, and if more than 50% of those come from <1% of pixels, then it is considered to be noise-dominated and hence unusable.
| Quadrant | # 1 sec bins | Bins with >0 counts | Bins with >2000 counts | High rate bins dominated by noise | Noise dominated (total time) | Noise dominated (detector-on time) | Marked lightcurve |
|---|---|---|---|---|---|---|---|
| A | 10020 | 8327 | 0 | 0 | 0.00% | 0.00% | 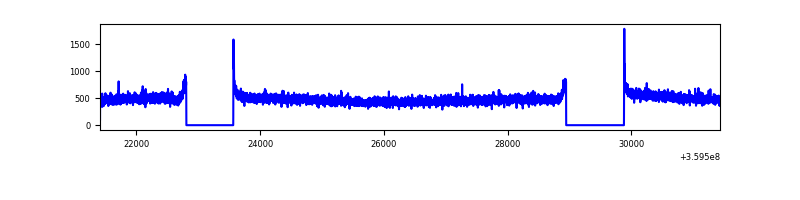 |
| B | 10021 | 8328 | 4 | 4 | 0.04% | 0.05% | 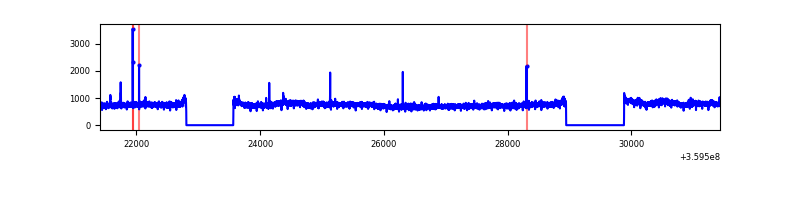 |
| C | 10021 | 8328 | 4 | 4 | 0.04% | 0.05% | 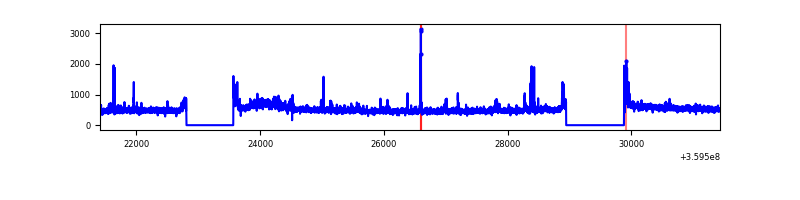 |
| D | 10021 | 8328 | 25 | 25 | 0.25% | 0.30% | 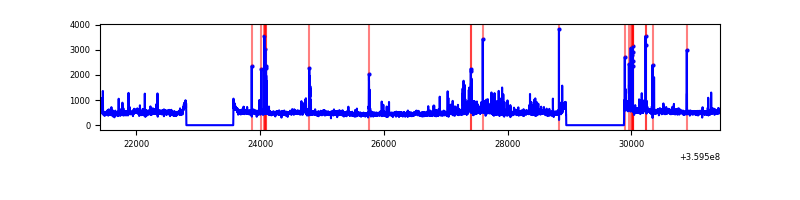 |
Top three noisy pixels from each quadrant. If the there are fewer than three noisy pixels in the level2.evt file, extra rows are filled as -1
| Pixel properties | Quadrant properties | ||||||
|---|---|---|---|---|---|---|---|
| Quadrant | DetID | PixID | Counts | Sigma | Mean | Median | Sigma |
| A | 8 | 192 | 21470 | 99.27 | 1035 | 1012 | 206.1 |
| A | 13 | 254 | 13639 | 61.27 | 1035 | 1012 | 206.1 |
| A | 3 | 137 | 10296 | 45.05 | 1035 | 1012 | 206.1 |
| B | 6 | 159 | 2225346 | 11427.45 | 1018 | 993 | 194.6 |
| B | 12 | 111 | 24476 | 120.64 | 1018 | 993 | 194.6 |
| B | 6 | 36 | 24370 | 120.1 | 1018 | 993 | 194.6 |
| C | 3 | 233 | 225060 | 979.59 | 989 | 993 | 228.7 |
| C | 14 | 238 | 166511 | 723.62 | 989 | 993 | 228.7 |
| C | 0 | 10 | 51532 | 220.95 | 989 | 993 | 228.7 |
| D | 8 | 195 | 253853 | 1072.79 | 1005 | 979 | 235.7 |
| D | 5 | 222 | 211986 | 895.18 | 1005 | 979 | 235.7 |
| D | 2 | 250 | 57321 | 239.03 | 1005 | 979 | 235.7 |
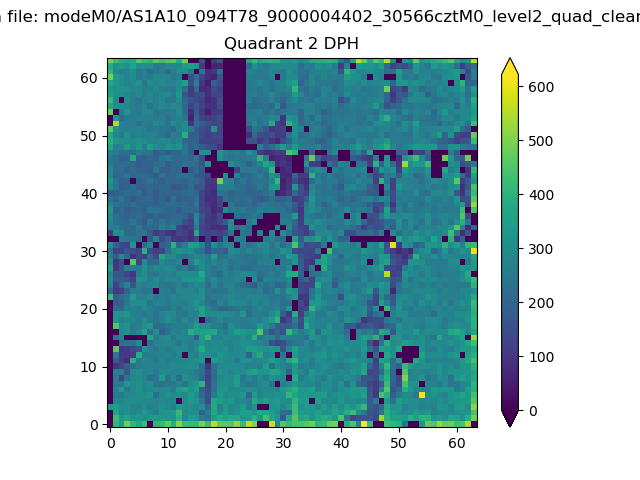
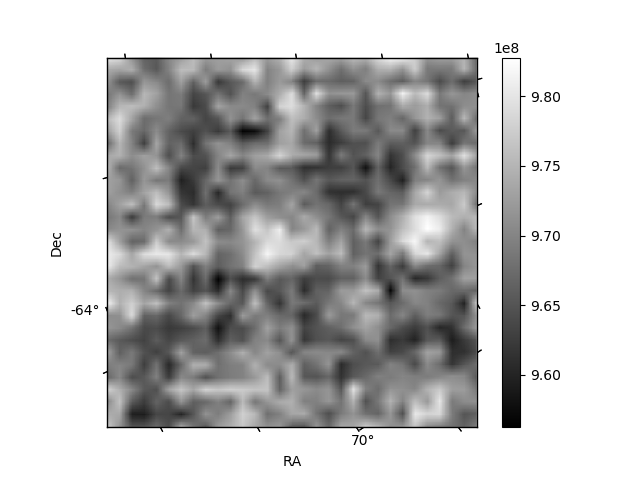
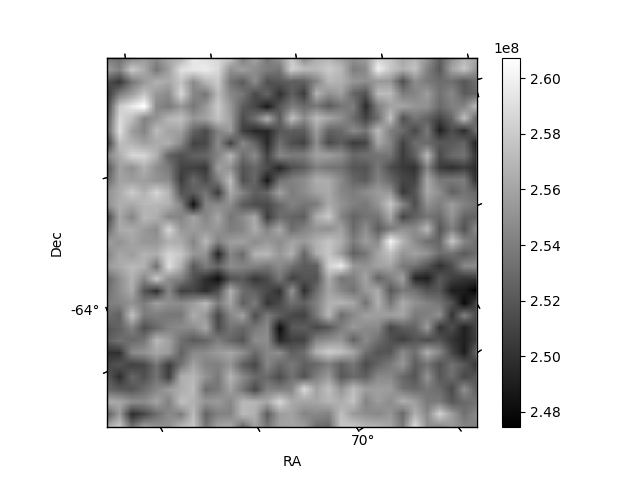
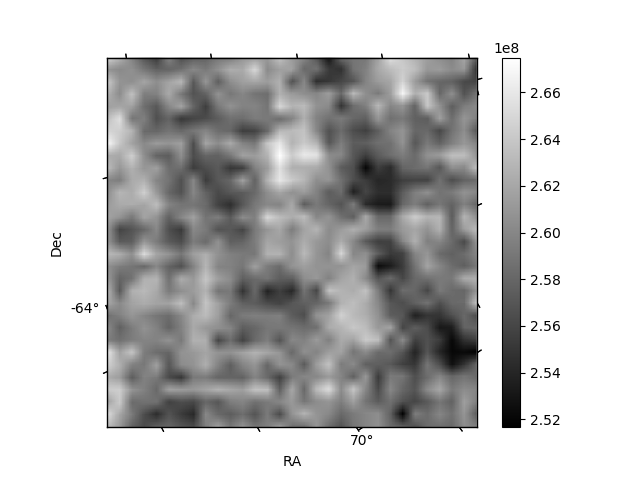
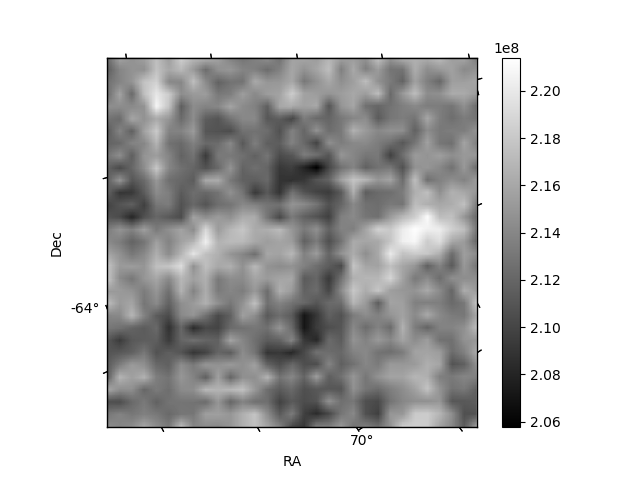
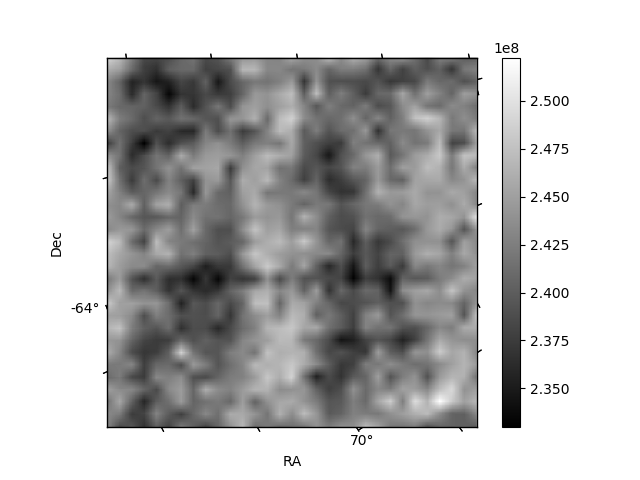
Histogram calculated using DETX and DETY for each event in the final _common_clean file
| Quadrant A | 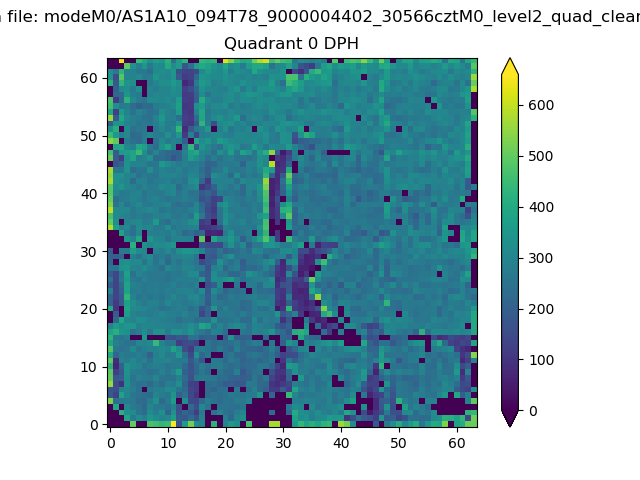 |
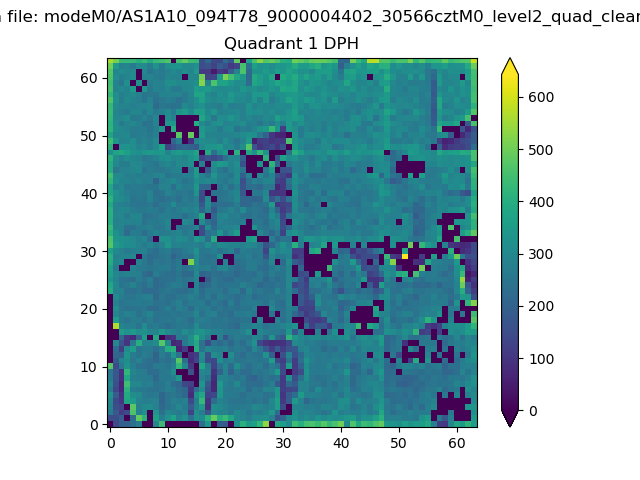 |
Quadrant B |
|---|---|---|---|
| Quadrant D | 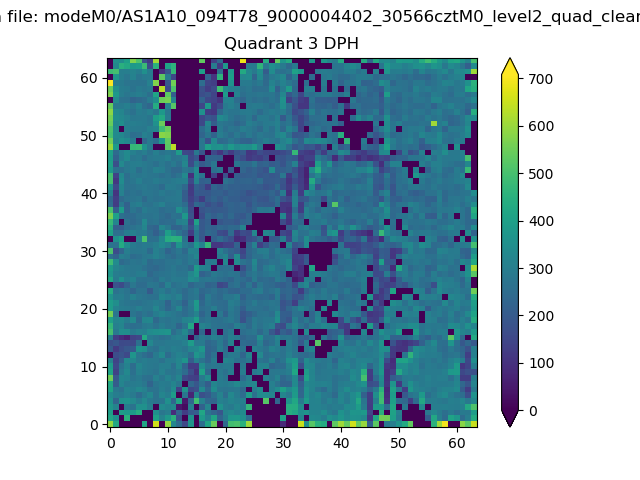 |
 |
Quadrant C |
| Plot type | Count rate plots | Images |
|---|---|---|
| Comparison with Poisson distribution Blue bars denote a histogram of data divided into 1 sec bins. Red curve is a Poisson curve with rate = median count rate of data. |
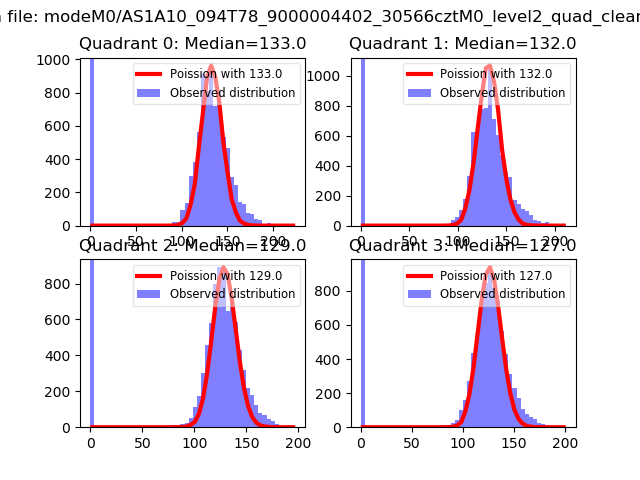 |
 |
| Quadrant-wise count rates Data is divided into 100 sec bins |
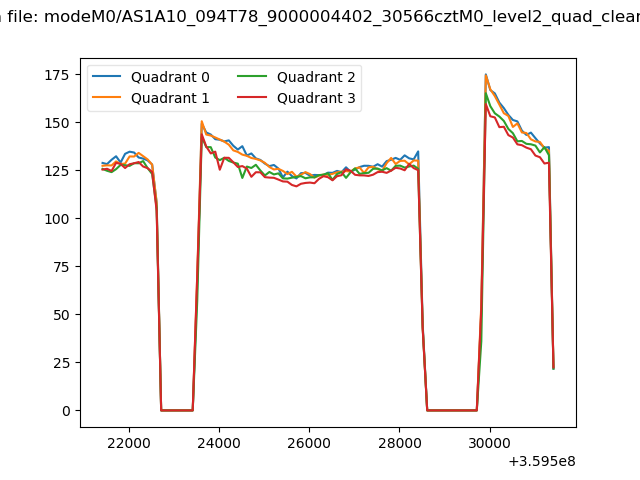 |
|
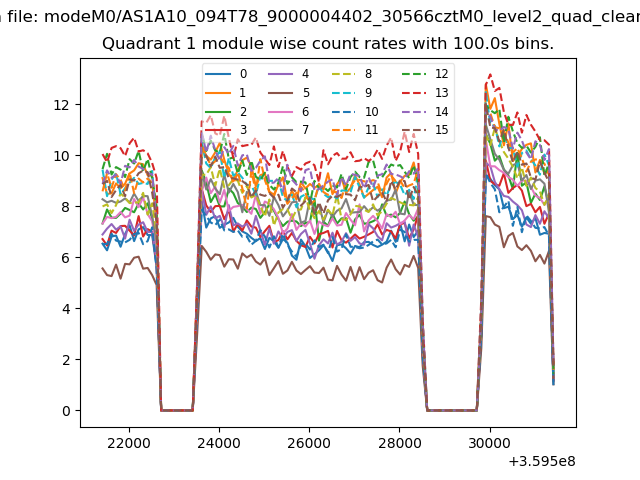
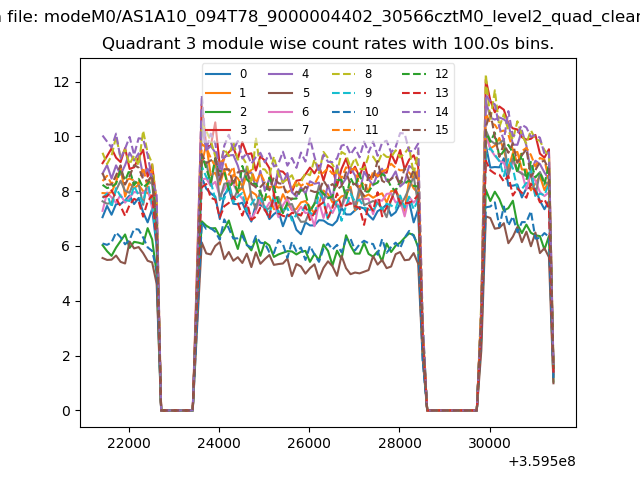
| Module-wise count rates for Quadrant A Data is divided into 100 sec bins |
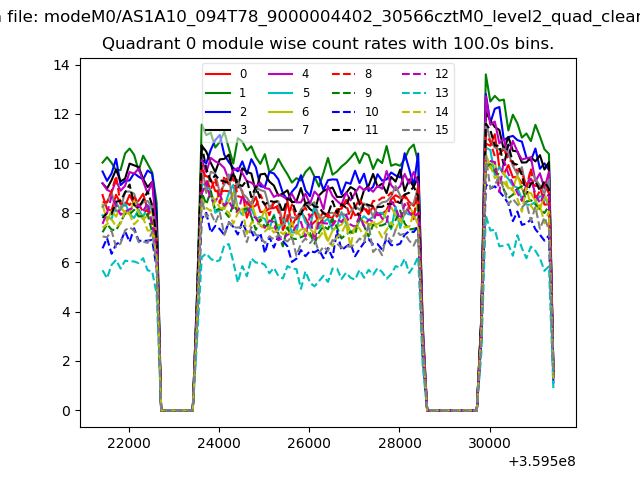 |
 |
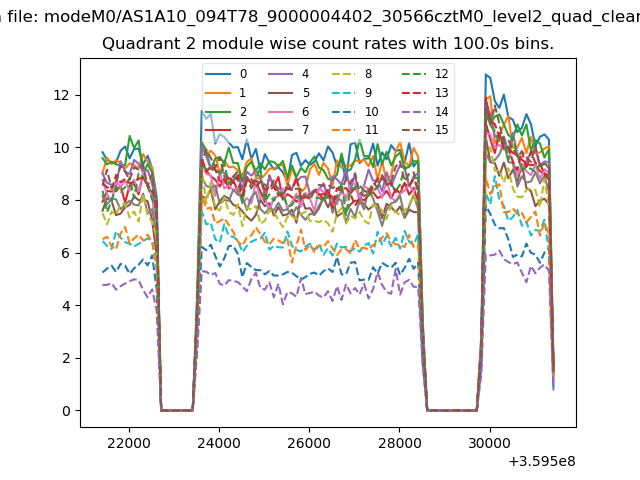
| Module-wise count rates for Quadrant B Data is divided into 100 sec bins |
 |
 |
| Module-wise count rates for Quadrant C Data is divided into 100 sec bins |
 |
 |
| Module-wise count rates for Quadrant D Data is divided into 100 sec bins |
 |
 |
| Parameter | Plot |
|---|---|
| CZT HV Monitor | 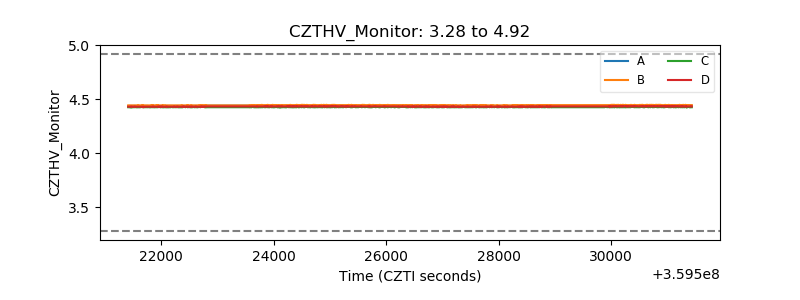 |
| D_VDD | 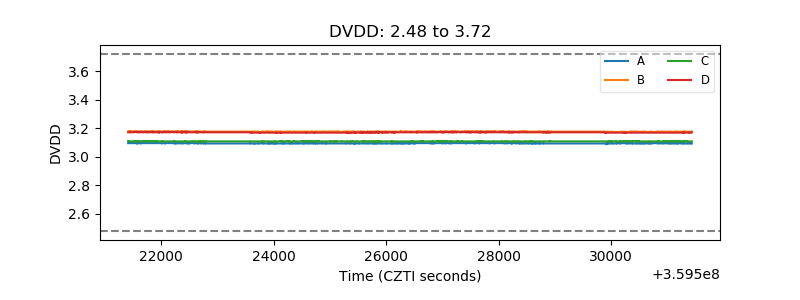 |
| Temperature 1 | 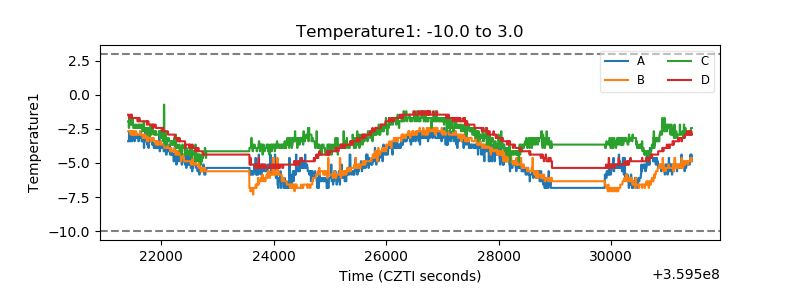 |
| Veto HV Monitor | 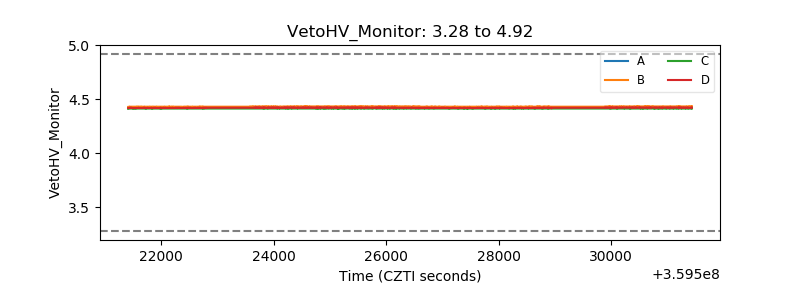 |
| Veto LLD | 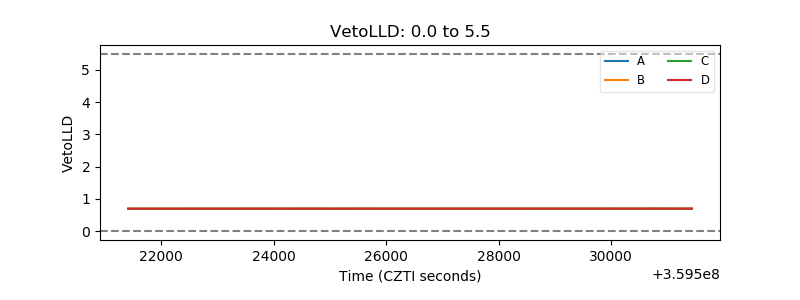 |
| Alpha Counter | 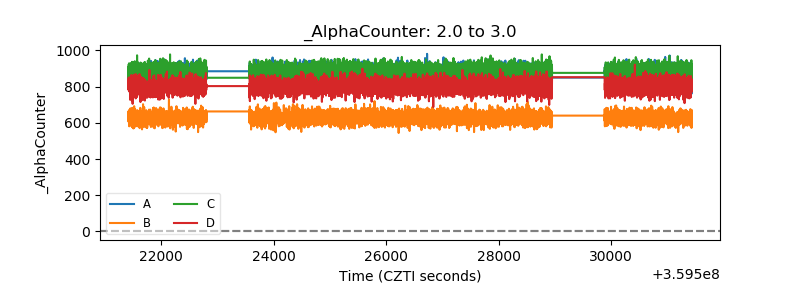 |
| _CPM_Rate | 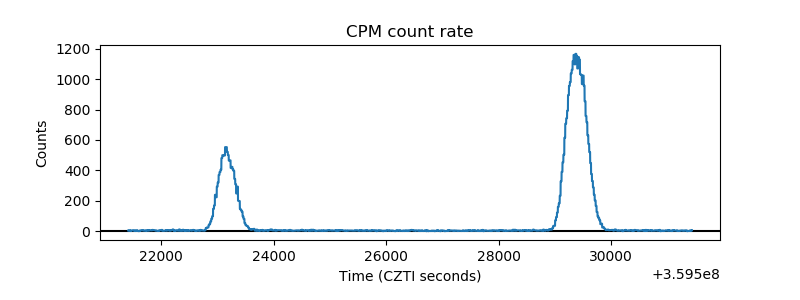 |
| CZT Counter | 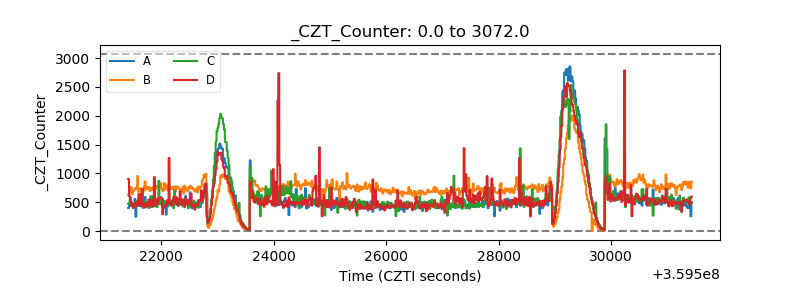 |
| +2.5 Volts monitor |  |
| +5 Volts monitor |  |
| _ROLL_ROT | 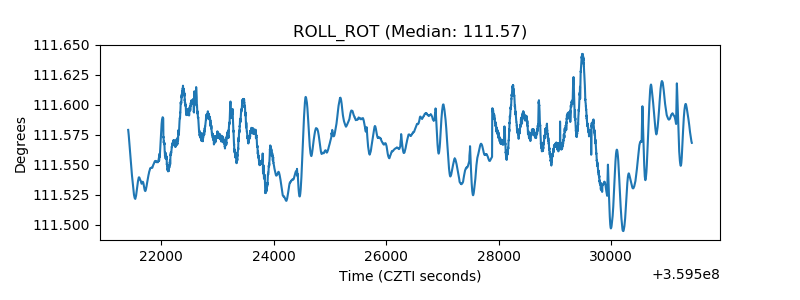 |
| _Roll_DEC | 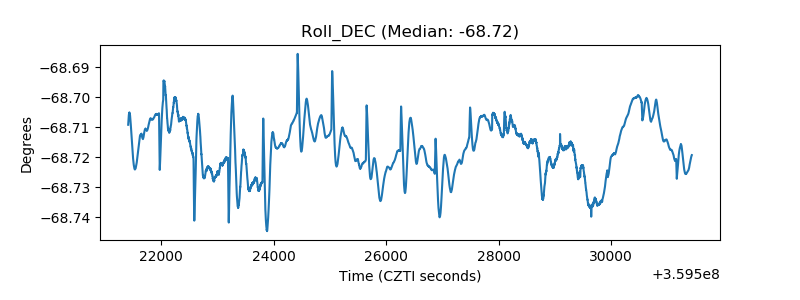 |
| _Roll_RA | 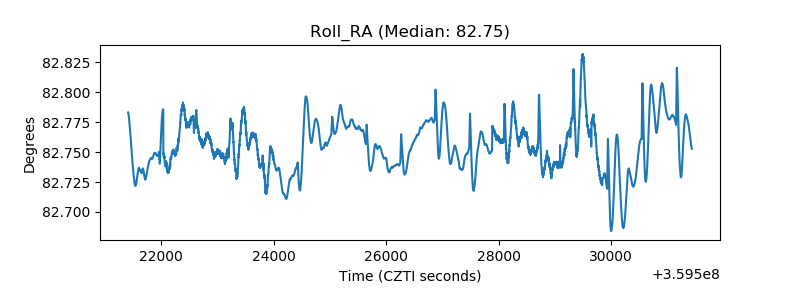 |
| Veto Counter | 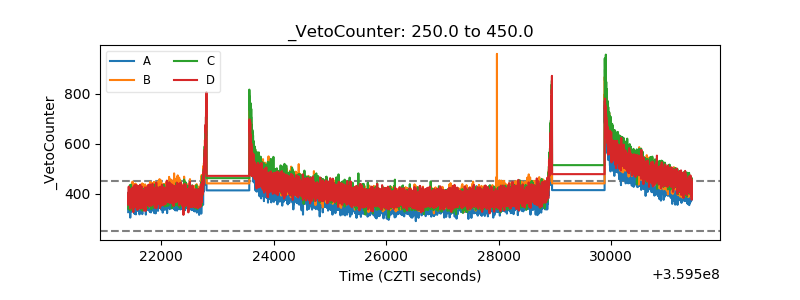 |