| Param | Original file | Final file |
|---|---|---|
| Filename | modeM0/AS1A10_094T78_9000004402_30568cztM0_level2.evt | modeM0/AS1A10_094T78_9000004402_30568cztM0_level2_quad_clean.evt |
| Size (bytes) | 219,559,680 | 57,378,240 |
| Size | 209.4 MB | 54.7 MB |
| Events in quadrant A | 1,336,215 | 388,621 |
| Events in quadrant B | 2,123,327 | 386,374 |
| Events in quadrant C | 1,459,753 | 380,291 |
| Events in quadrant D | 1,529,843 | 373,874 |
| Mode M0 | |||
|---|---|---|---|
| Quadrant | BADHDUFLAG | Total packets | Discarded packets |
| A | 0 | 5858 | 0 |
| B | 0 | 8740 | 0 |
| C | 0 | 6041 | 0 |
| D | 0 | 6238 | 0 |
| Mode SS | |||
|---|---|---|---|
| Quadrant | BADHDUFLAG | Total packets | Discarded packets |
| A | 0 | 58 | 0 |
| B | 0 | 58 | 0 |
| C | 0 | 58 | 0 |
| D | 0 | 58 | 0 |
| Quadrant | Total seconds | Saturated seconds | Saturation percentage |
|---|---|---|---|
| A | 2921 | 2 | 0.068470% |
| B | 2921 | 10 | 0.342349% |
| C | 2922 | 12 | 0.410678% |
| D | 2922 | 8 | 0.273785% |
Noise dominated data is calculated using 1-second bins in cleaned event files. If a bin has >2000 counts, and if more than 50% of those come from <1% of pixels, then it is considered to be noise-dominated and hence unusable.
| Quadrant | # 1 sec bins | Bins with >0 counts | Bins with >2000 counts | High rate bins dominated by noise | Noise dominated (total time) | Noise dominated (detector-on time) | Marked lightcurve |
|---|---|---|---|---|---|---|---|
| A | 2921 | 2921 | 0 | 0 | 0.00% | 0.00% | 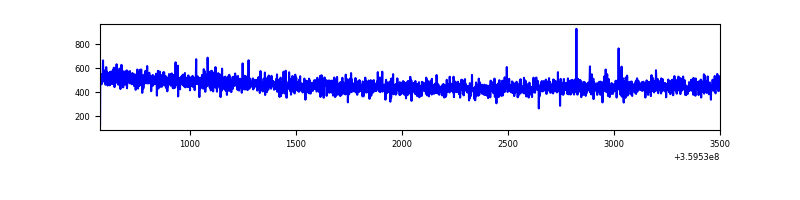 |
| B | 2921 | 2921 | 1 | 1 | 0.03% | 0.03% | 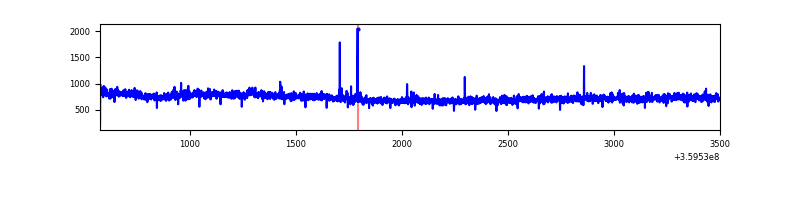 |
| C | 2922 | 2922 | 0 | 0 | 0.00% | 0.00% | 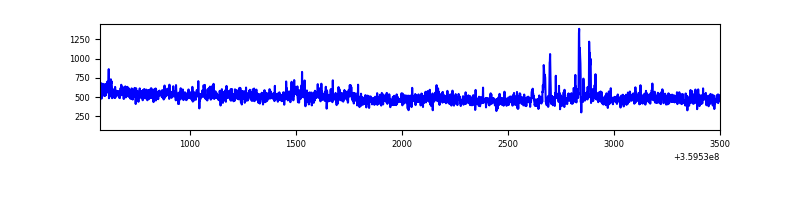 |
| D | 2922 | 2922 | 7 | 7 | 0.24% | 0.24% | 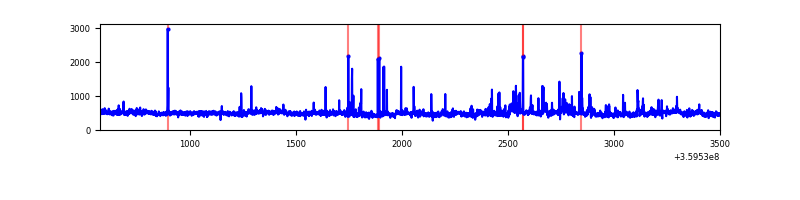 |
Top three noisy pixels from each quadrant. If the there are fewer than three noisy pixels in the level2.evt file, extra rows are filled as -1
| Pixel properties | Quadrant properties | ||||||
|---|---|---|---|---|---|---|---|
| Quadrant | DetID | PixID | Counts | Sigma | Mean | Median | Sigma |
| A | 13 | 254 | 4723 | 62.26 | 346 | 339 | 70.4 |
| A | 3 | 137 | 3219 | 40.9 | 346 | 339 | 70.4 |
| A | 0 | 226 | 2912 | 36.54 | 346 | 339 | 70.4 |
| B | 6 | 159 | 786842 | 12141.59 | 337 | 329 | 64.8 |
| B | 12 | 111 | 7593 | 112.14 | 337 | 329 | 64.8 |
| B | 11 | 111 | 7202 | 106.1 | 337 | 329 | 64.8 |
| C | 3 | 233 | 101482 | 1296.35 | 332 | 334 | 78.0 |
| C | 14 | 238 | 53727 | 684.3 | 332 | 334 | 78.0 |
| C | 2 | 114 | 6766 | 82.43 | 332 | 334 | 78.0 |
| D | 8 | 195 | 119429 | 1457.05 | 340 | 330 | 81.7 |
| D | 2 | 250 | 32457 | 393.04 | 340 | 330 | 81.7 |
| D | 10 | 253 | 32059 | 388.17 | 340 | 330 | 81.7 |
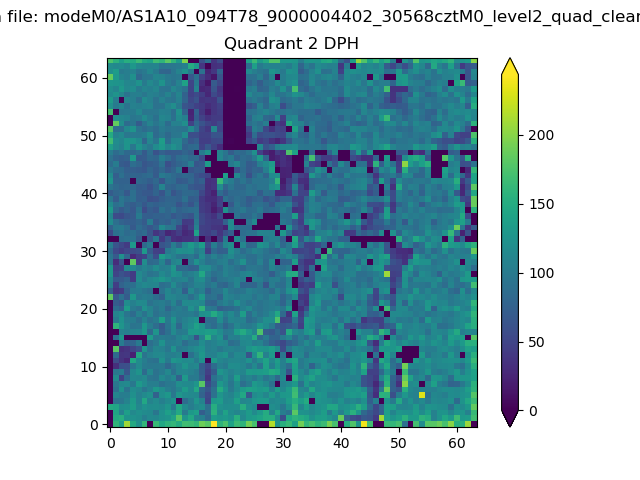
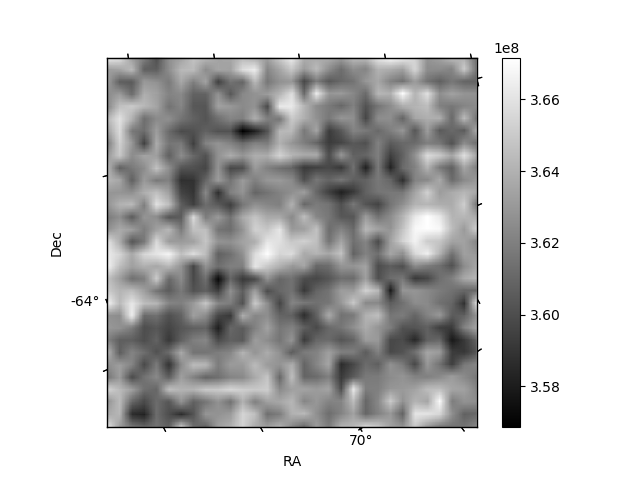
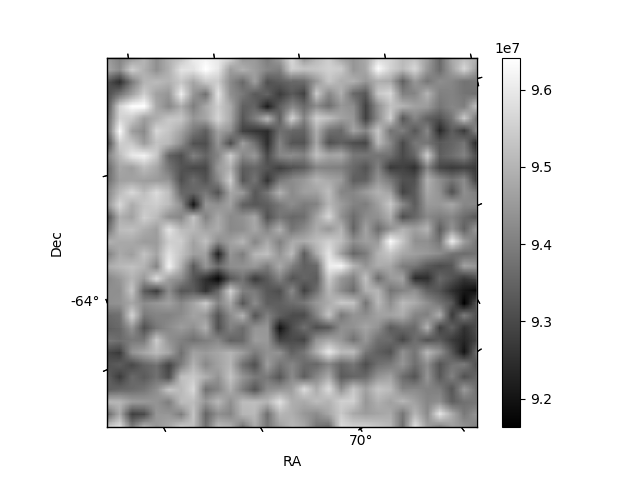
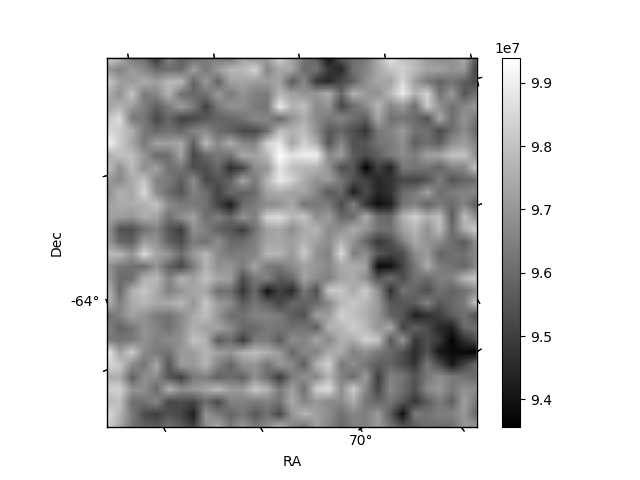
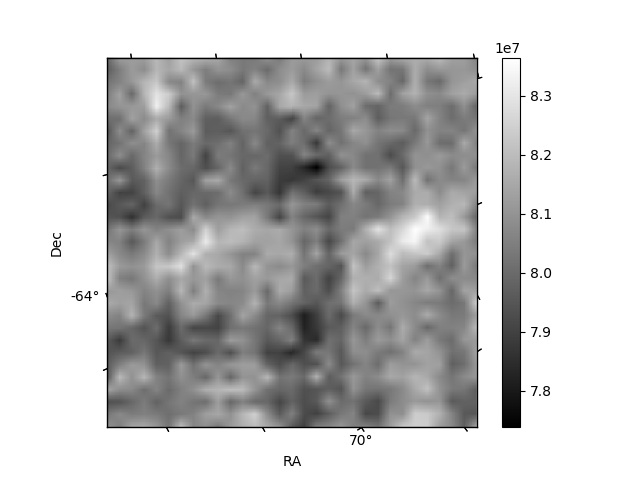
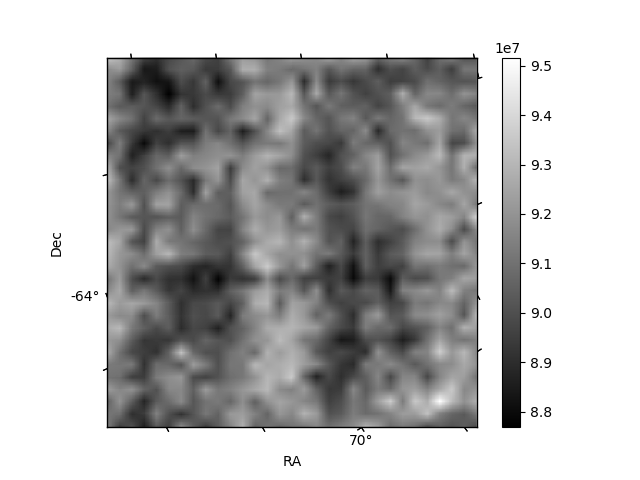
Histogram calculated using DETX and DETY for each event in the final _common_clean file
| Quadrant A | 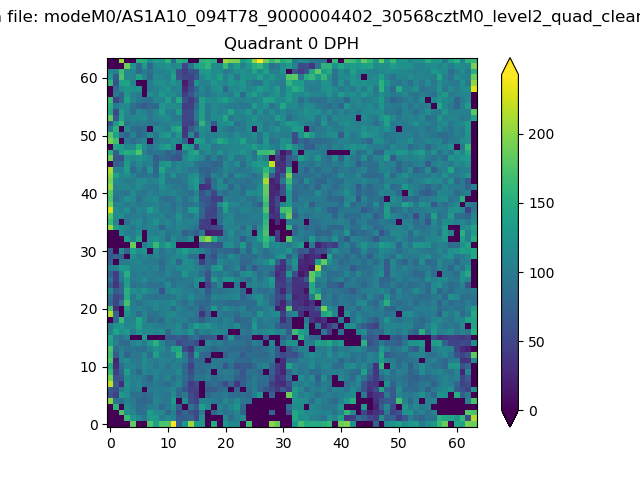 |
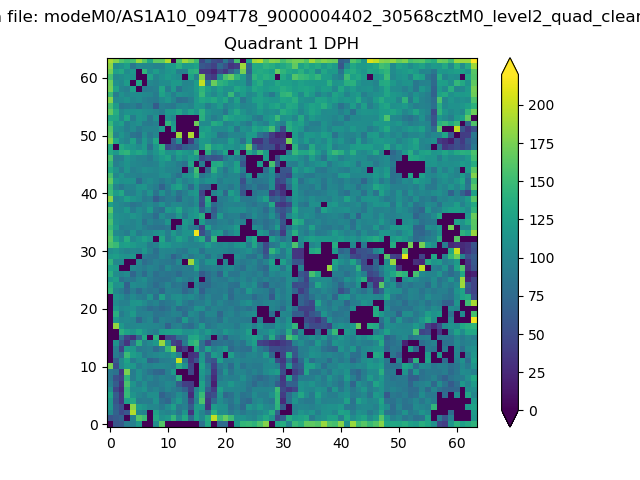 |
Quadrant B |
|---|---|---|---|
| Quadrant D | 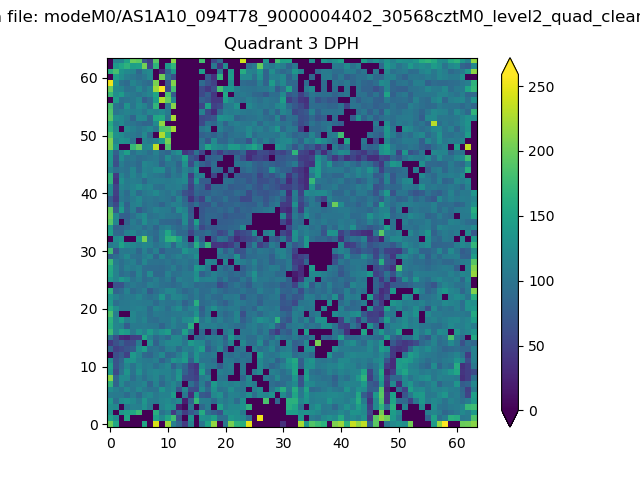 |
 |
Quadrant C |
| Plot type | Count rate plots | Images |
|---|---|---|
| Comparison with Poisson distribution Blue bars denote a histogram of data divided into 1 sec bins. Red curve is a Poisson curve with rate = median count rate of data. |
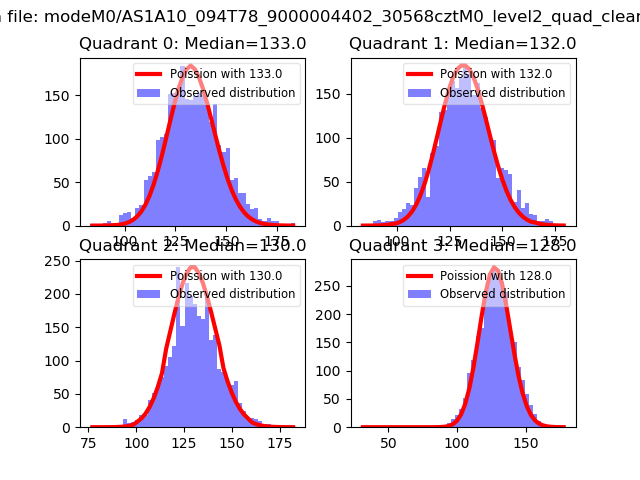 |
 |
| Quadrant-wise count rates Data is divided into 100 sec bins |
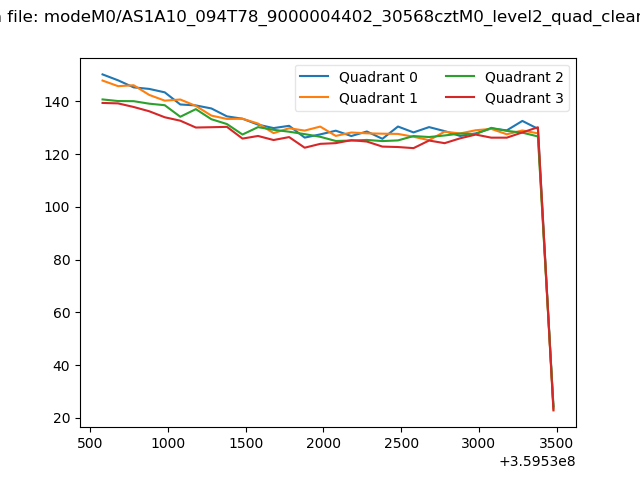 |
|
| Module-wise count rates for Quadrant A Data is divided into 100 sec bins |
 |
 |
| Module-wise count rates for Quadrant B Data is divided into 100 sec bins |
 |
 |
| Module-wise count rates for Quadrant C Data is divided into 100 sec bins |
 |
 |
| Module-wise count rates for Quadrant D Data is divided into 100 sec bins |
 |
 |
| Parameter | Plot |
|---|---|
| CZT HV Monitor | 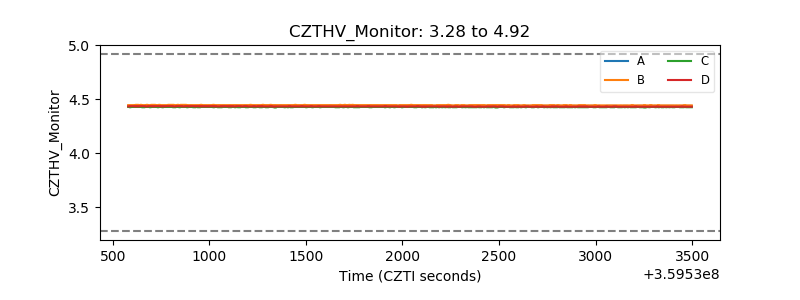 |
| D_VDD | 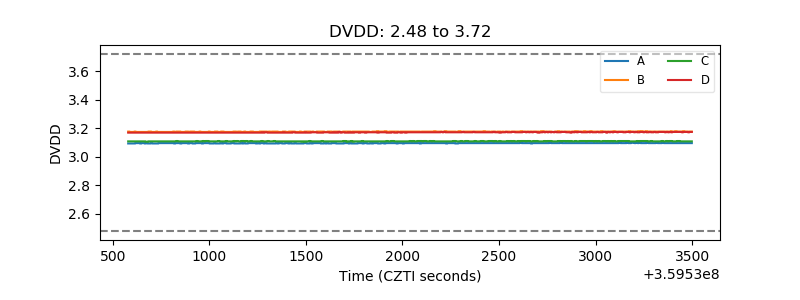 |
| Temperature 1 |  |
| Veto HV Monitor | 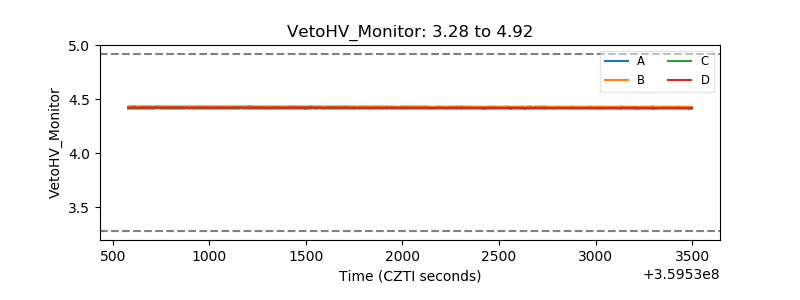 |
| Veto LLD |  |
| Alpha Counter | 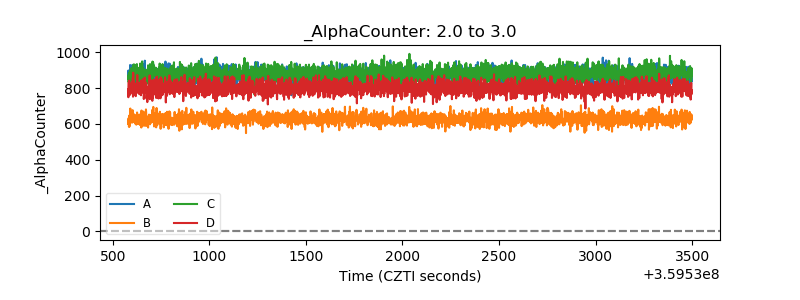 |
| _CPM_Rate | 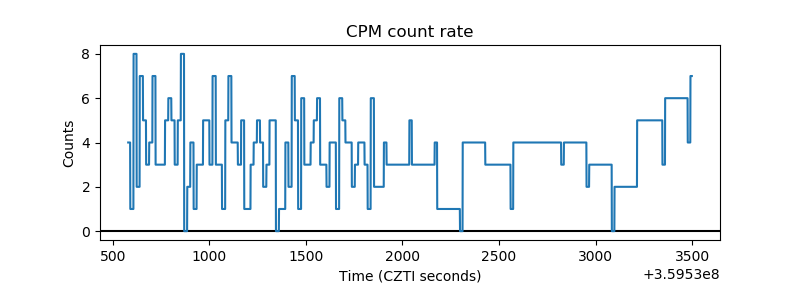 |
| CZT Counter | 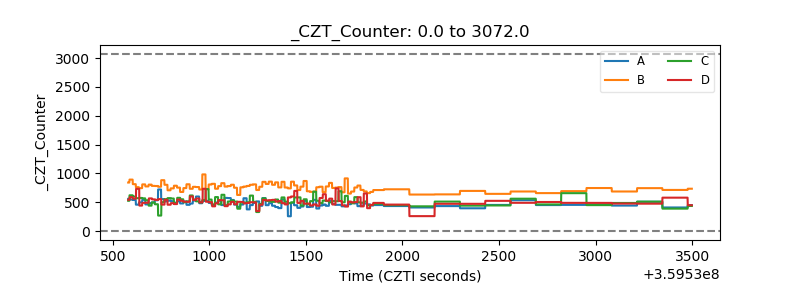 |
| +2.5 Volts monitor |  |
| +5 Volts monitor | 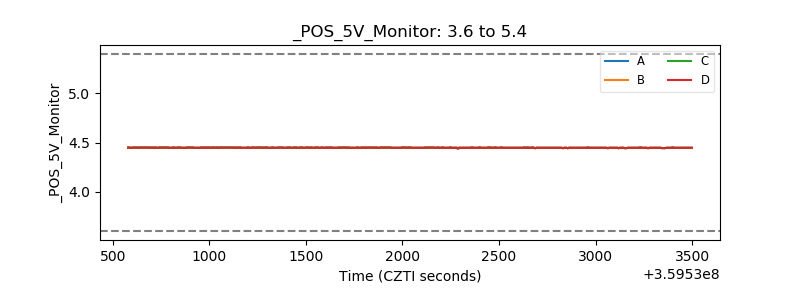 |
| _ROLL_ROT | 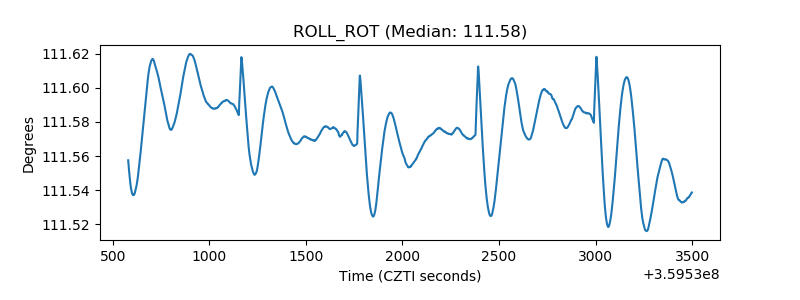 |
| _Roll_DEC | 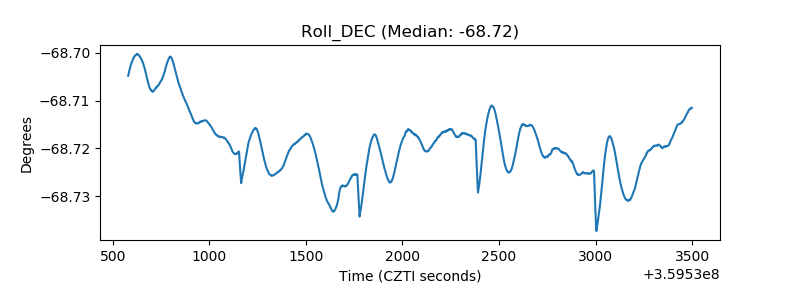 |
| _Roll_RA | 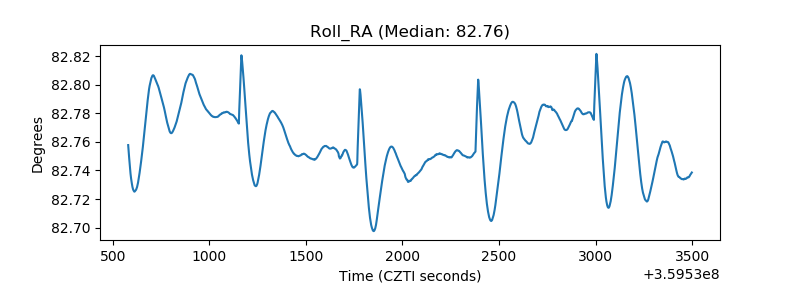 |
| Veto Counter |  |