| Param | Original file | Final file |
|---|---|---|
| Filename | modeM0/AS1A10_053T23_9000004404cztM0_level2.fits | modeM0/AS1A10_053T23_9000004404cztM0_level2_quad_clean.evt |
| Size (bytes) | 534,432,960 | 324,622,080 |
| Size | 509.7 MB | 309.6 MB |
| Events in quadrant A | 3,420,750 | 1,668,601 |
| Events in quadrant B | 3,164,274 | 1,645,812 |
| Events in quadrant C | 3,198,480 | 1,552,159 |
| Events in quadrant D | 2,900,140 | 1,460,962 |
| Mode SS | |||
|---|---|---|---|
| Quadrant | BADHDUFLAG | Total packets | Discarded packets |
| A | 0 | 1044 | 0 |
| B | 0 | 1044 | 0 |
| C | 0 | 1044 | 0 |
| D | 0 | 1044 | 0 |
| Mode M0 | |||
|---|---|---|---|
| Quadrant | BADHDUFLAG | Total packets | Discarded packets |
| A | 0 | 108814 | 0 |
| B | 0 | 157949 | 0 |
| C | 0 | 113748 | 0 |
| D | 0 | 127096 | 0 |
| Mode M9 | |||
|---|---|---|---|
| Quadrant | BADHDUFLAG | Total packets | Discarded packets |
| A | 0 | 88 | 0 |
| B | 0 | 88 | 0 |
| C | 0 | 88 | 0 |
| D | 0 | 88 | 0 |
| Quadrant | Total seconds | Saturated seconds | Saturation percentage |
|---|---|---|---|
| A | 51012 | 857 | 1.679997% |
| B | 51012 | 1763 | 3.456050% |
| C | 51012 | 2057 | 4.032385% |
| D | 51012 | 1681 | 3.295303% |
Noise dominated data is calculated using 1-second bins in cleaned event files. If a bin has >2000 counts, and if more than 50% of those come from <1% of pixels, then it is considered to be noise-dominated and hence unusable.
| Quadrant | # 1 sec bins | Bins with >0 counts | Bins with >2000 counts | High rate bins dominated by noise | Noise dominated (total time) | Noise dominated (detector-on time) | Marked lightcurve |
|---|---|---|---|---|---|---|---|
| A | 59917 | 51011 | 0 | 0 | 0.00% | 0.00% | 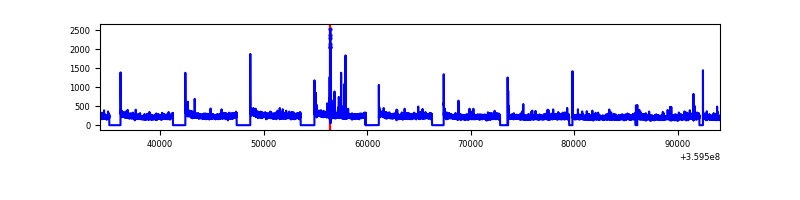 |
| B | 59917 | 51012 | 0 | 0 | 0.00% | 0.00% | 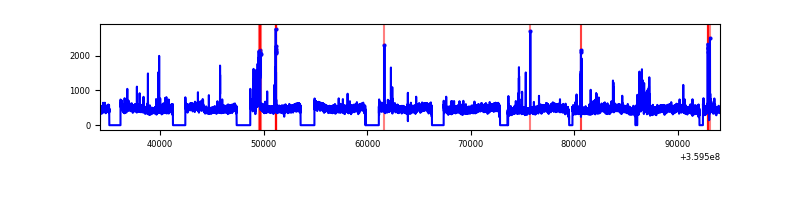 |
| C | 59917 | 51000 | 0 | 0 | 0.00% | 0.00% |  |
| D | 59917 | 50999 | 0 | 0 | 0.00% | 0.00% |  |
Top three noisy pixels from each quadrant. If the there are fewer than three noisy pixels in the level2.evt file, extra rows are filled as -1
| Pixel properties | Quadrant properties | ||||||
|---|---|---|---|---|---|---|---|
| Quadrant | DetID | PixID | Counts | Sigma | Mean | Median | Sigma |
| A | 0 | 29 | 3139 | 10.71 | 891 | 840 | 214.7 |
| A | 9 | 19 | 2544 | 7.94 | 891 | 840 | 214.7 |
| A | 7 | 110 | 2542 | 7.93 | 891 | 840 | 214.7 |
| B | 2 | 9 | 2472 | 10.14 | 835 | 800 | 164.9 |
| B | 3 | 80 | 2197 | 8.47 | 835 | 800 | 164.9 |
| B | 2 | 8 | 2060 | 7.64 | 835 | 800 | 164.9 |
| C | 1 | 80 | 2476 | 7.82 | 845 | 793 | 215.3 |
| C | 1 | 81 | 2369 | 7.32 | 845 | 793 | 215.3 |
| C | 12 | 241 | 2217 | 6.61 | 845 | 793 | 215.3 |
| D | 15 | 46 | 2104 | 6.26 | 829 | 760 | 214.6 |
| D | 10 | 189 | 2101 | 6.25 | 829 | 760 | 214.6 |
| D | 6 | 67 | 2019 | 5.87 | 829 | 760 | 214.6 |
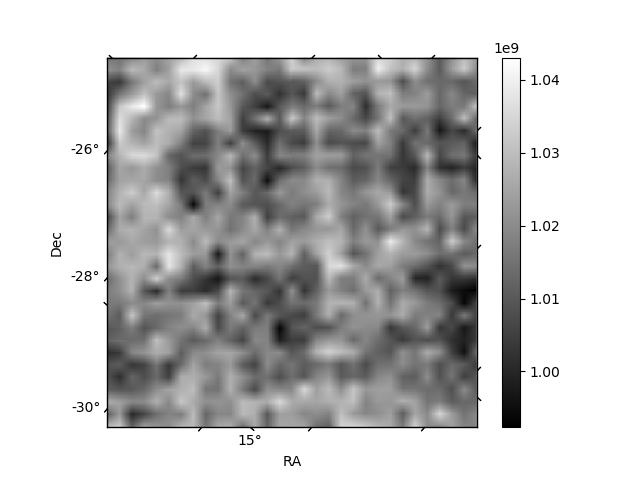
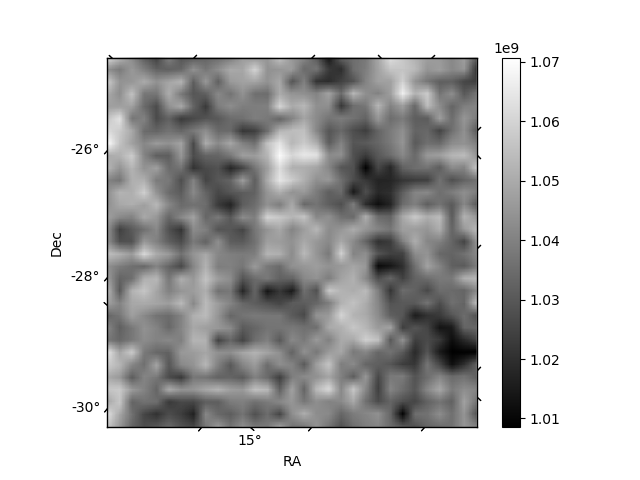
Histogram calculated using DETX and DETY for each event in the final _common_clean file
| Quadrant A | 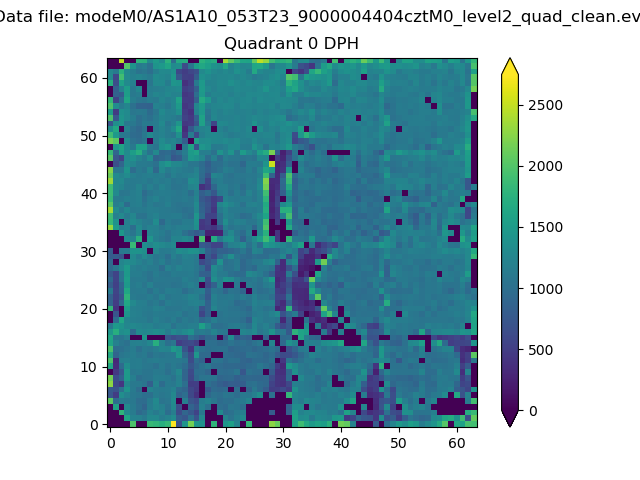 |
 |
Quadrant B |
|---|---|---|---|
| Quadrant D | 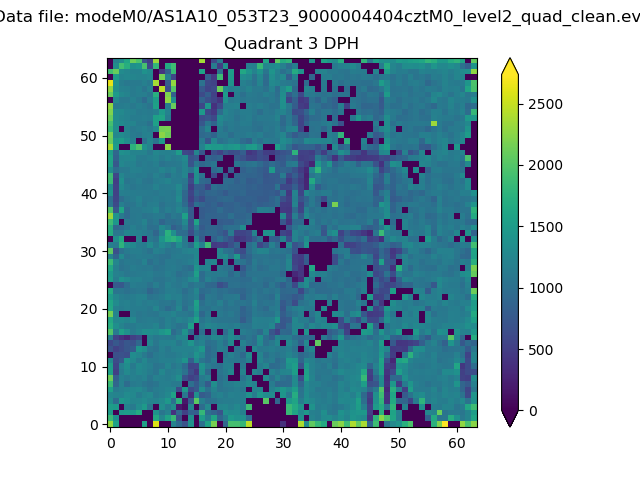 |
 |
Quadrant C |
| Plot type | Count rate plots | Images |
|---|---|---|
| Comparison with Poisson distribution Blue bars denote a histogram of data divided into 1 sec bins. Red curve is a Poisson curve with rate = median count rate of data. |
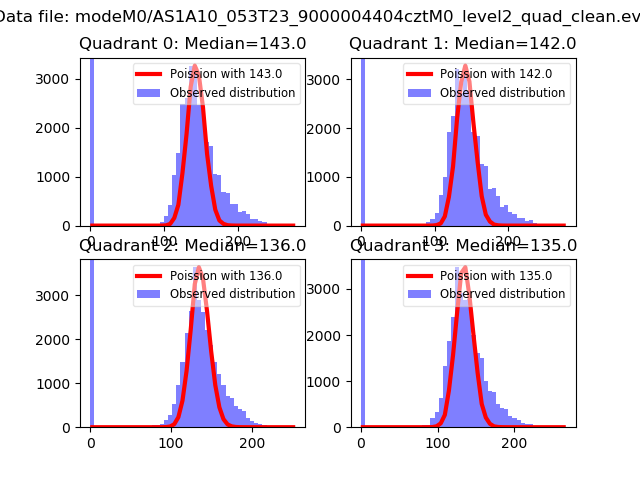 |
 |
| Quadrant-wise count rates Data is divided into 100 sec bins |
 |
|
| Module-wise count rates for Quadrant A Data is divided into 100 sec bins |
 |
 |
| Module-wise count rates for Quadrant B Data is divided into 100 sec bins |
 |
 |
| Module-wise count rates for Quadrant C Data is divided into 100 sec bins |
 |
 |
| Module-wise count rates for Quadrant D Data is divided into 100 sec bins |
 |
 |
| Parameter | Plot |
|---|---|
| CZT HV Monitor |  |
| D_VDD | 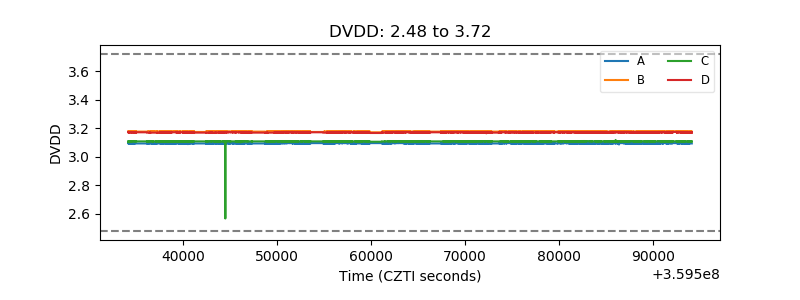 |
| Temperature 1 |  |
| Veto HV Monitor |  |
| Veto LLD |  |
| Alpha Counter | 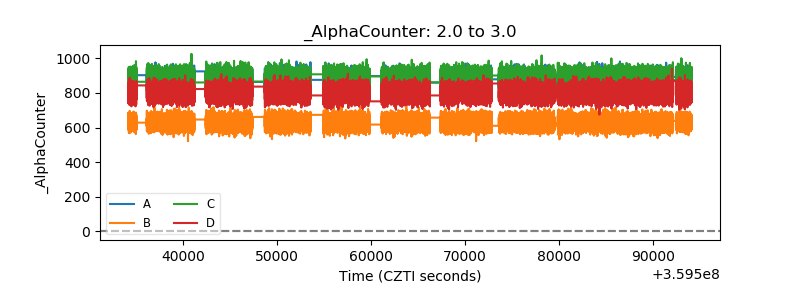 |
| _CPM_Rate | 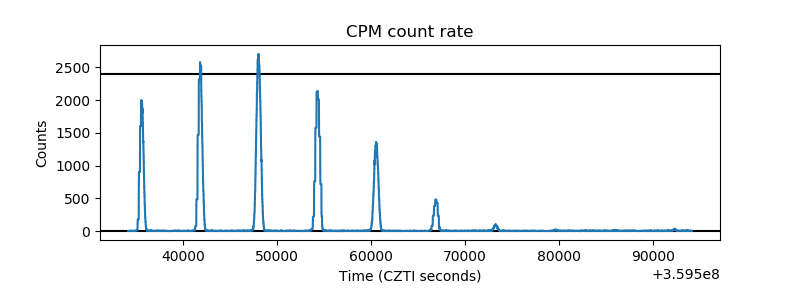 |
| CZT Counter | 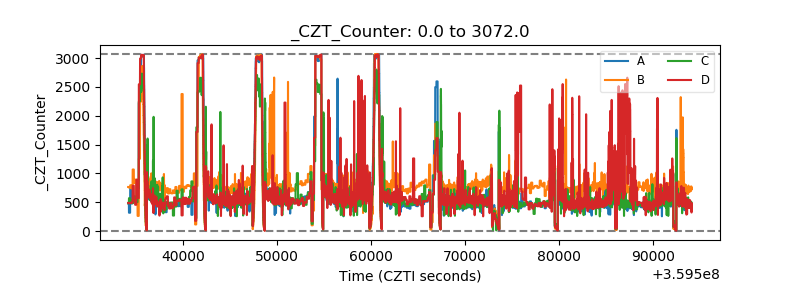 |
| +2.5 Volts monitor |  |
| +5 Volts monitor |  |
| _ROLL_ROT |  |
| _Roll_DEC | 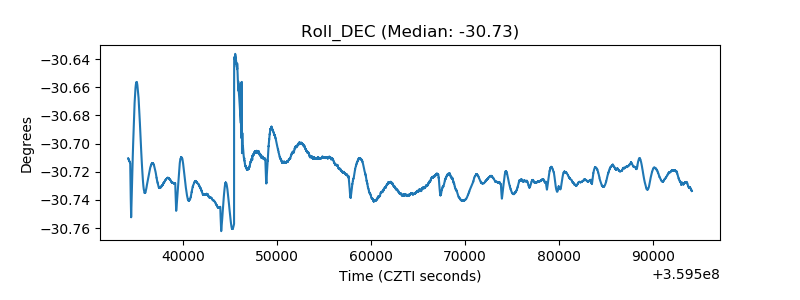 |
| _Roll_RA | 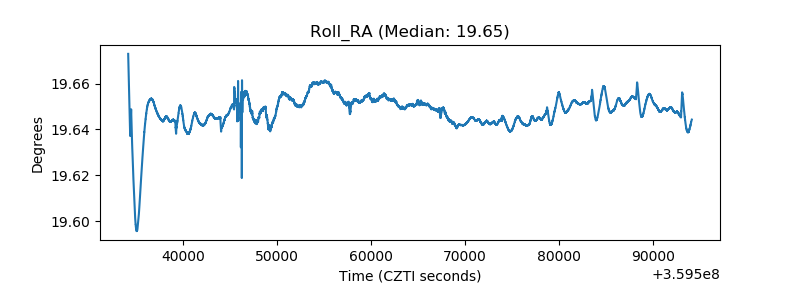 |
| Veto Counter | 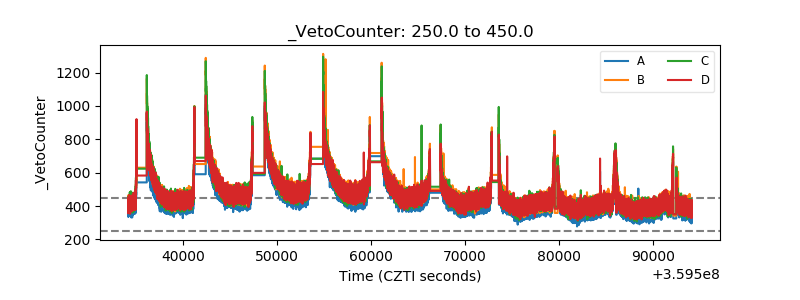 |