| Param | Original file | Final file |
|---|---|---|
| Filename | modeM0/AS1A10_053T23_9000004404_30568cztM0_level2.evt | modeM0/AS1A10_053T23_9000004404_30568cztM0_level2_quad_clean.evt |
| Size (bytes) | 196,637,760 | 34,856,640 |
| Size | 187.5 MB | 33.2 MB |
| Events in quadrant A | 1,238,285 | 228,665 |
| Events in quadrant B | 1,840,043 | 229,388 |
| Events in quadrant C | 1,423,641 | 215,238 |
| Events in quadrant D | 1,299,421 | 220,276 |
| Mode SS | |||
|---|---|---|---|
| Quadrant | BADHDUFLAG | Total packets | Discarded packets |
| A | 0 | 46 | 0 |
| B | 0 | 46 | 0 |
| C | 0 | 46 | 0 |
| D | 0 | 46 | 0 |
| Mode M0 | |||
|---|---|---|---|
| Quadrant | BADHDUFLAG | Total packets | Discarded packets |
| A | 0 | 4961 | 1 |
| B | 0 | 6915 | 1 |
| C | 0 | 5735 | 1 |
| D | 0 | 5199 | 1 |
| Mode M9 | |||
|---|---|---|---|
| Quadrant | BADHDUFLAG | Total packets | Discarded packets |
| A | 0 | 11 | 0 |
| B | 0 | 11 | 0 |
| C | 0 | 11 | 0 |
| D | 0 | 11 | 0 |
| Quadrant | Total seconds | Saturated seconds | Saturation percentage |
|---|---|---|---|
| A | 2239 | 41 | 1.831175% |
| B | 2239 | 80 | 3.573024% |
| C | 2239 | 145 | 6.476105% |
| D | 2238 | 31 | 1.385165% |
Noise dominated data is calculated using 1-second bins in cleaned event files. If a bin has >2000 counts, and if more than 50% of those come from <1% of pixels, then it is considered to be noise-dominated and hence unusable.
| Quadrant | # 1 sec bins | Bins with >0 counts | Bins with >2000 counts | High rate bins dominated by noise | Noise dominated (total time) | Noise dominated (detector-on time) | Marked lightcurve |
|---|---|---|---|---|---|---|---|
| A | 3329 | 2240 | 0 | 0 | 0.00% | 0.00% | 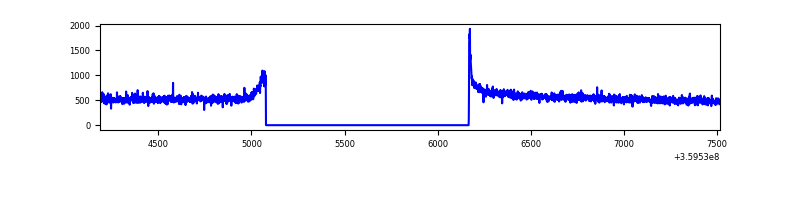 |
| B | 3329 | 2240 | 0 | 0 | 0.00% | 0.00% | 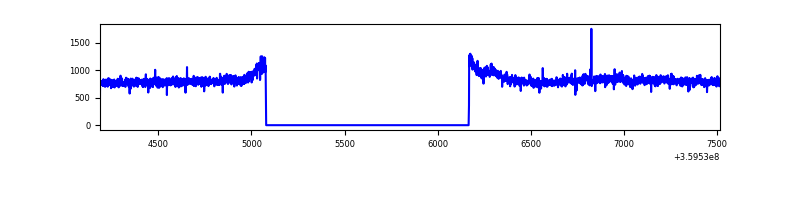 |
| C | 3329 | 2240 | 17 | 17 | 0.51% | 0.76% | 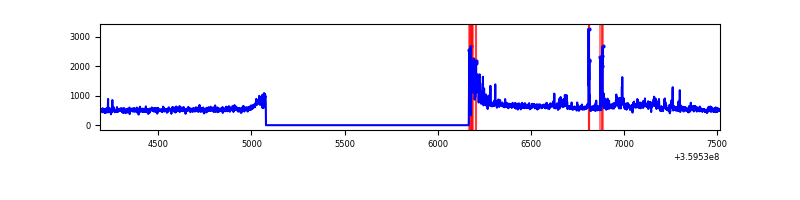 |
| D | 3328 | 2239 | 4 | 4 | 0.12% | 0.18% | 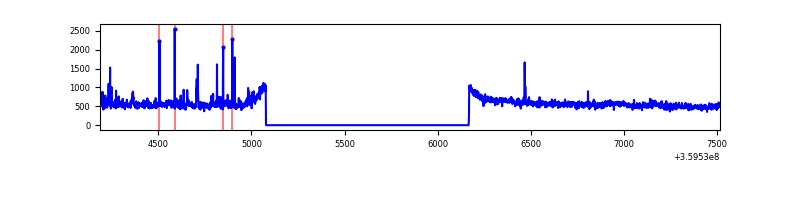 |
Top three noisy pixels from each quadrant. If the there are fewer than three noisy pixels in the level2.evt file, extra rows are filled as -1
| Pixel properties | Quadrant properties | ||||||
|---|---|---|---|---|---|---|---|
| Quadrant | DetID | PixID | Counts | Sigma | Mean | Median | Sigma |
| A | 8 | 192 | 10456 | 155.79 | 318 | 312 | 65.1 |
| A | 13 | 254 | 4237 | 60.28 | 318 | 312 | 65.1 |
| A | 3 | 137 | 3084 | 42.57 | 318 | 312 | 65.1 |
| B | 6 | 159 | 602611 | 9847.11 | 313 | 305 | 61.2 |
| B | 12 | 111 | 7319 | 114.67 | 313 | 305 | 61.2 |
| B | 11 | 111 | 6713 | 104.76 | 313 | 305 | 61.2 |
| C | 14 | 238 | 66979 | 928.47 | 302 | 304 | 71.8 |
| C | 0 | 10 | 59965 | 830.8 | 302 | 304 | 71.8 |
| C | 3 | 233 | 49540 | 685.63 | 302 | 304 | 71.8 |
| D | 8 | 195 | 67950 | 898.67 | 312 | 303 | 75.3 |
| D | 2 | 250 | 25444 | 333.99 | 312 | 303 | 75.3 |
| D | 1 | 52 | 10223 | 131.78 | 312 | 303 | 75.3 |
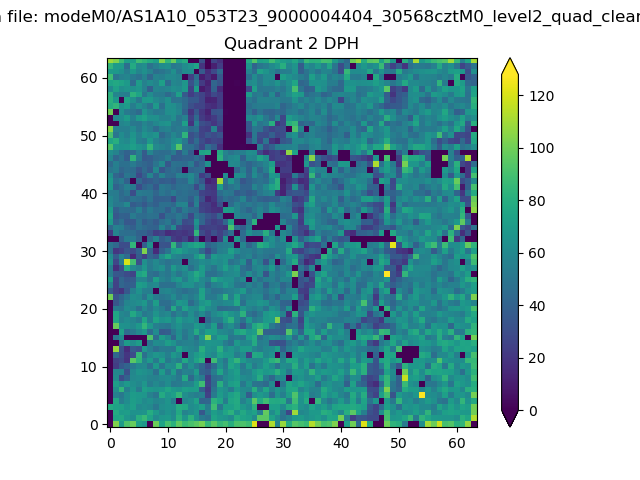
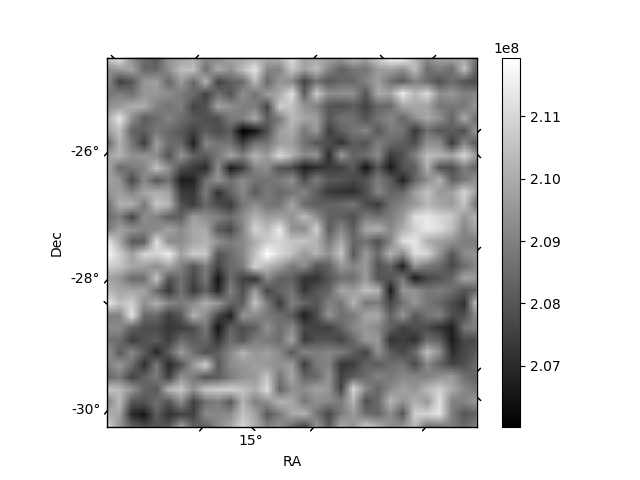
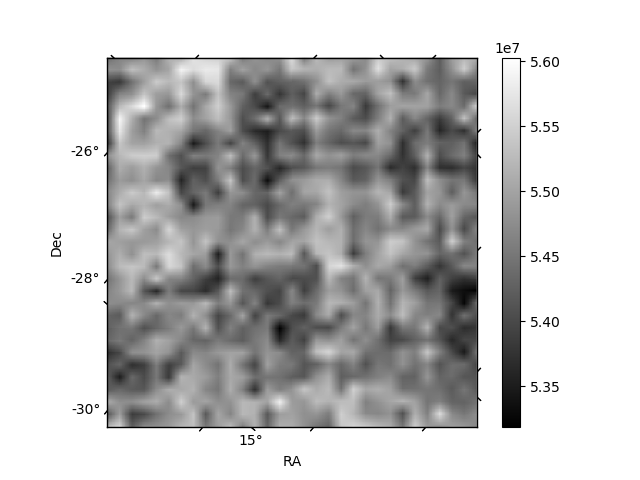
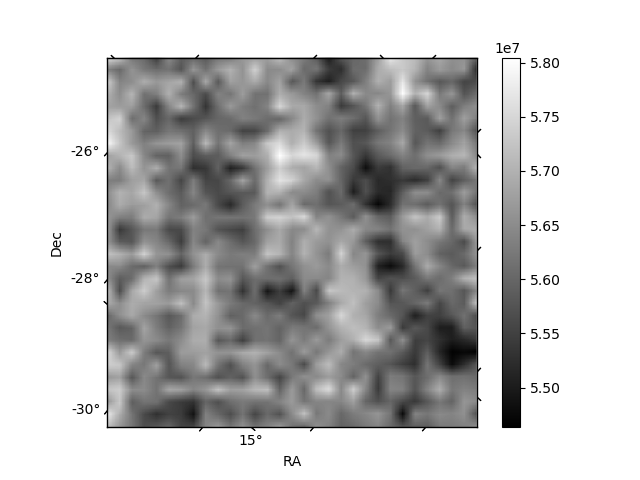
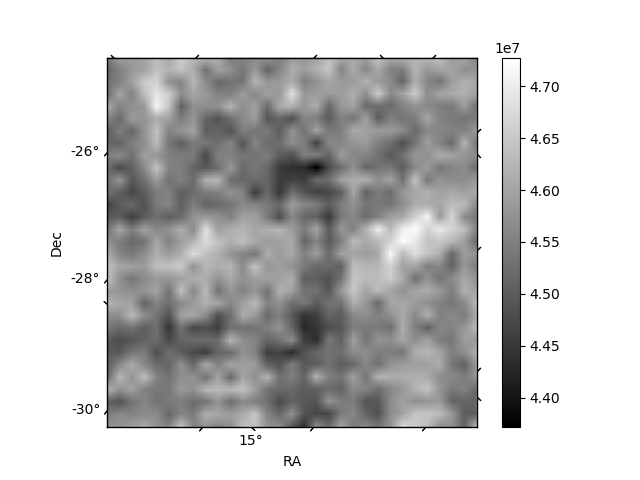
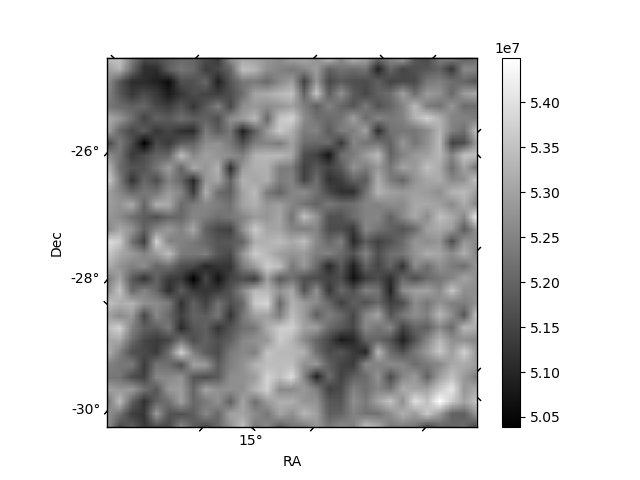
Histogram calculated using DETX and DETY for each event in the final _common_clean file
| Quadrant A | 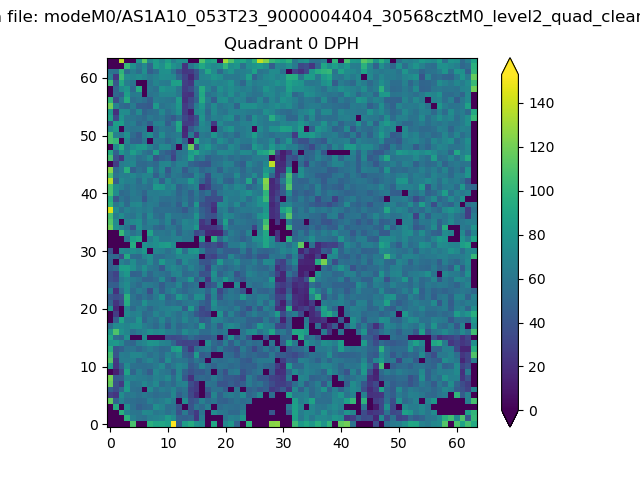 |
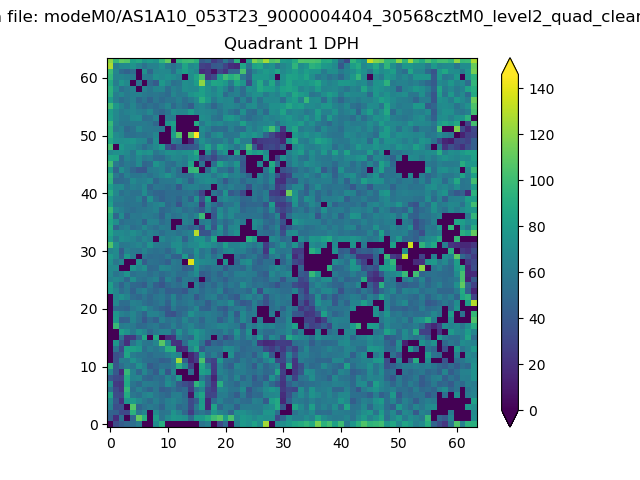 |
Quadrant B |
|---|---|---|---|
| Quadrant D | 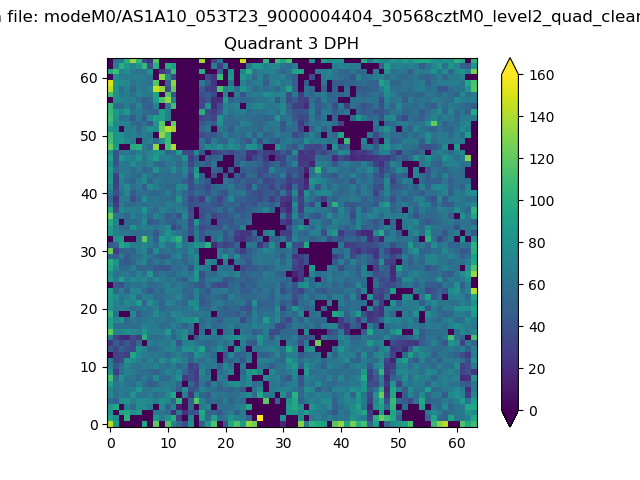 |
 |
Quadrant C |
| Plot type | Count rate plots | Images |
|---|---|---|
| Comparison with Poisson distribution Blue bars denote a histogram of data divided into 1 sec bins. Red curve is a Poisson curve with rate = median count rate of data. |
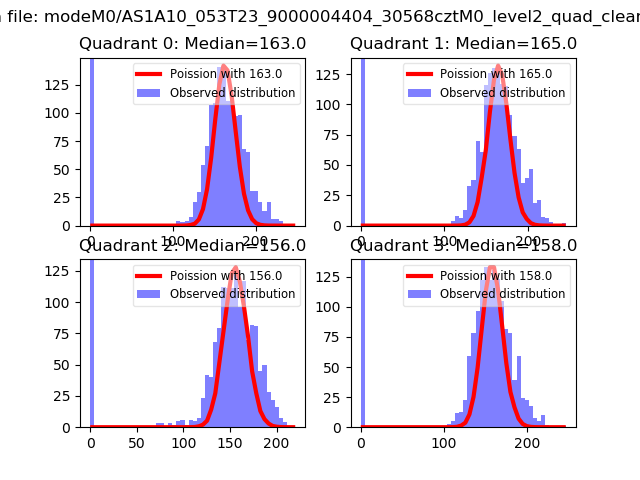 |
 |
| Quadrant-wise count rates Data is divided into 100 sec bins |
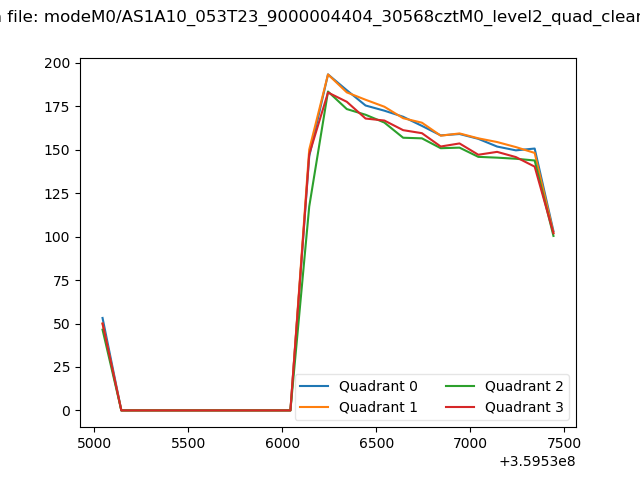 |
|
| Module-wise count rates for Quadrant A Data is divided into 100 sec bins |
 |
 |
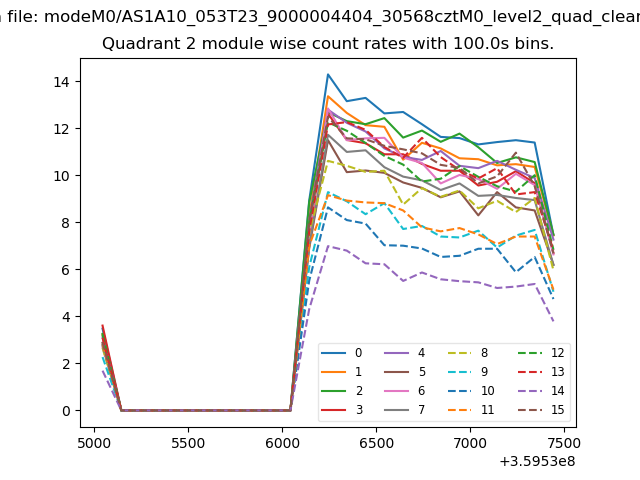
| Module-wise count rates for Quadrant B Data is divided into 100 sec bins |
 |
 |
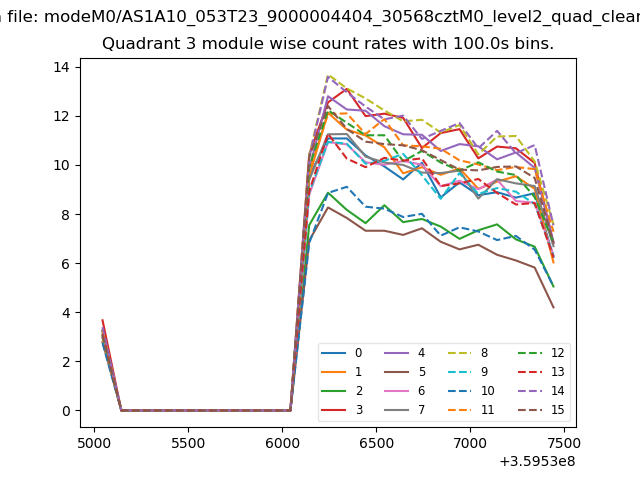
| Module-wise count rates for Quadrant C Data is divided into 100 sec bins |
 |
 |
| Module-wise count rates for Quadrant D Data is divided into 100 sec bins |
 |
 |
| Parameter | Plot |
|---|---|
| CZT HV Monitor | 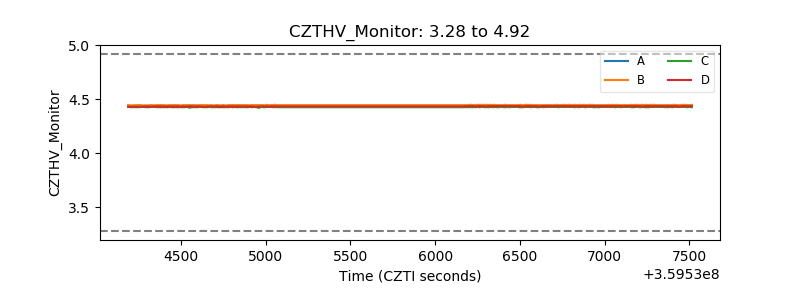 |
| D_VDD | 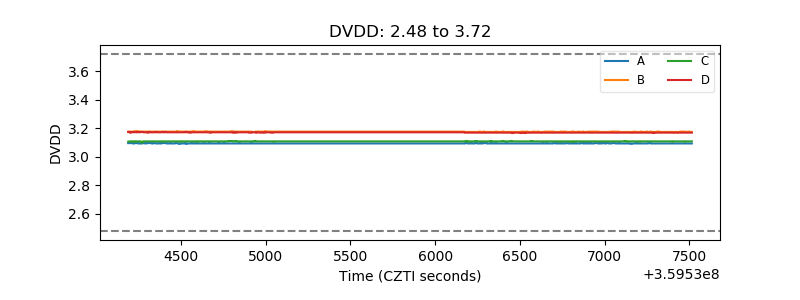 |
| Temperature 1 | 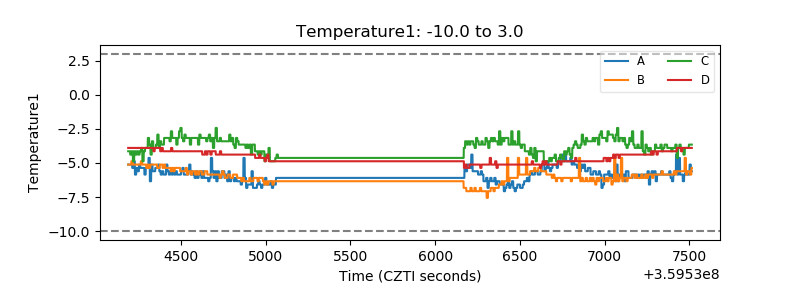 |
| Veto HV Monitor | 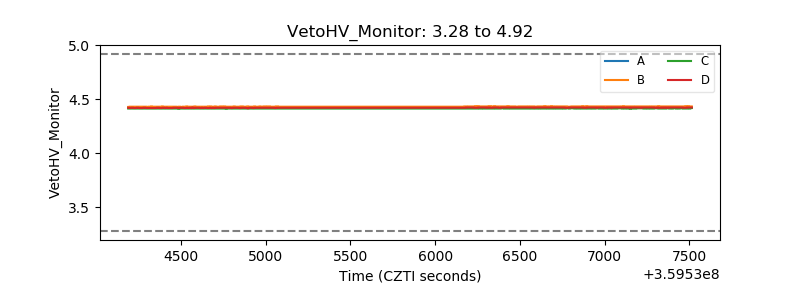 |
| Veto LLD | 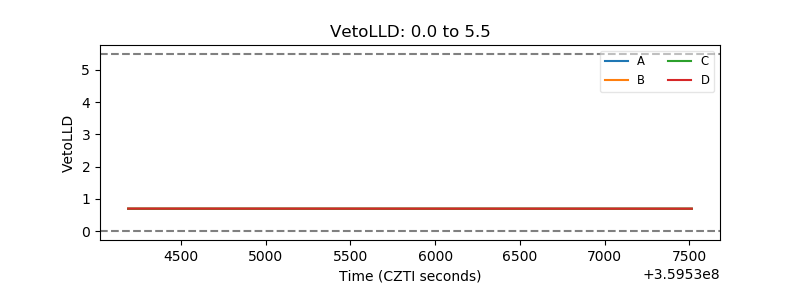 |
| Alpha Counter | 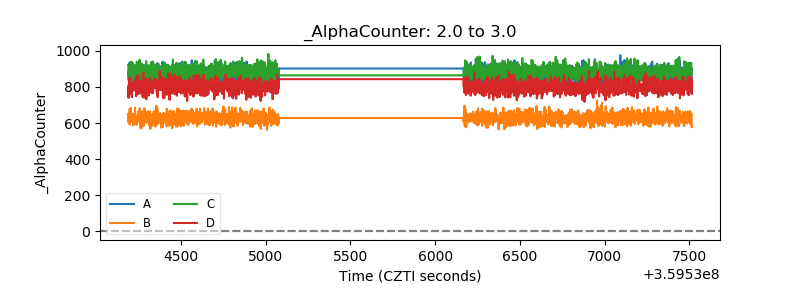 |
| _CPM_Rate | 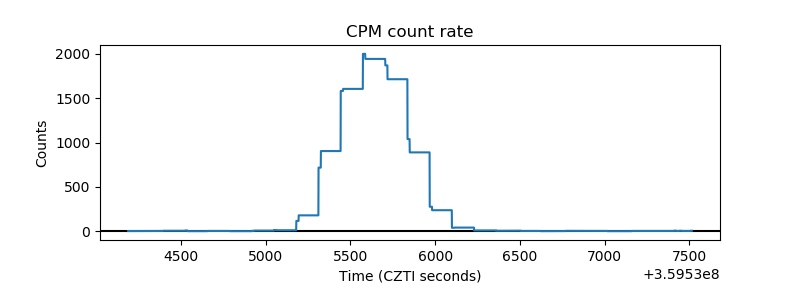 |
| CZT Counter | 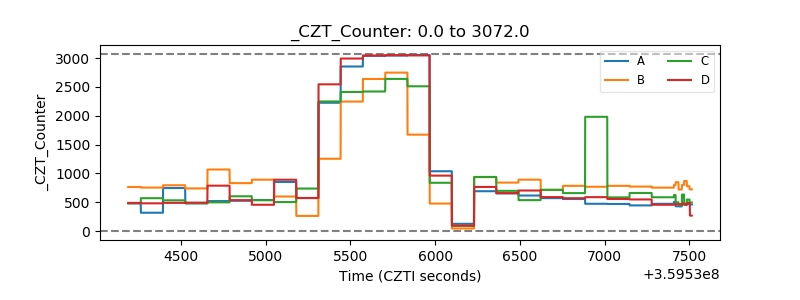 |
| +2.5 Volts monitor |  |
| +5 Volts monitor |  |
| _ROLL_ROT | 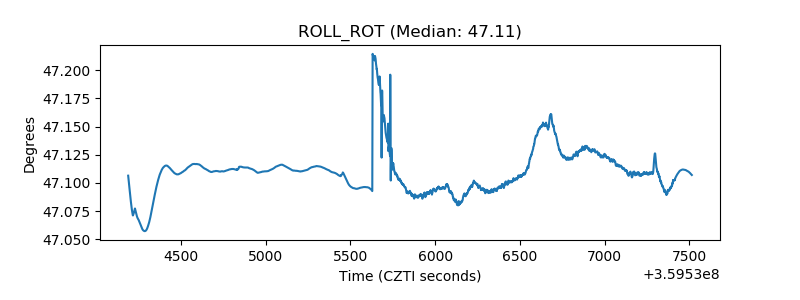 |
| _Roll_DEC | 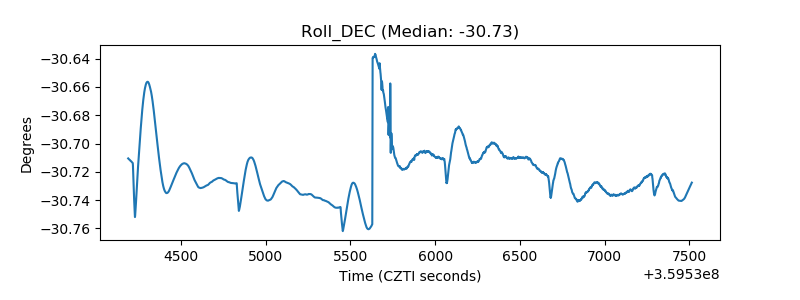 |
| _Roll_RA | 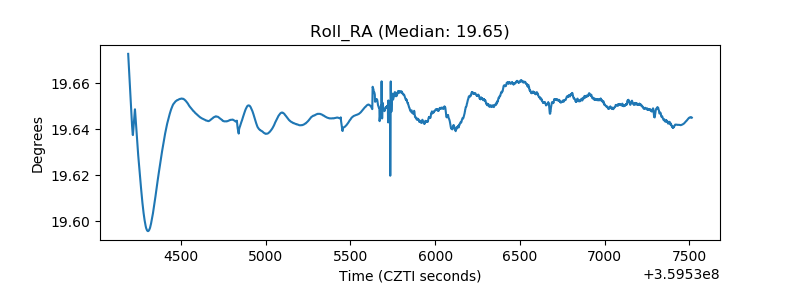 |
| Veto Counter | 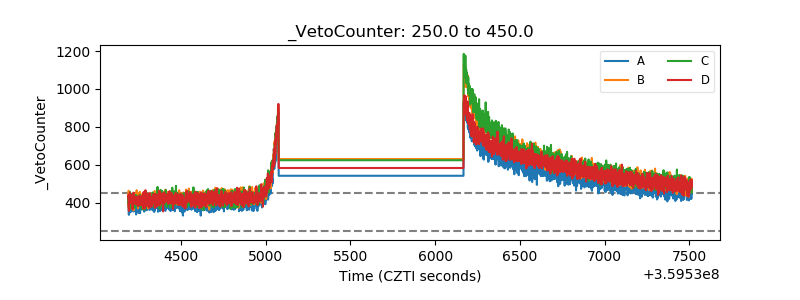 |