| Param | Original file | Final file |
|---|---|---|
| Filename | modeM0/AS1A10_053T23_9000004404_30569cztM0_level2.evt | modeM0/AS1A10_053T23_9000004404_30569cztM0_level2_quad_clean.evt |
| Size (bytes) | 553,302,720 | 105,442,560 |
| Size | 527.7 MB | 100.6 MB |
| Events in quadrant A | 3,458,299 | 702,486 |
| Events in quadrant B | 5,198,589 | 703,458 |
| Events in quadrant C | 3,963,154 | 658,564 |
| Events in quadrant D | 3,690,617 | 669,709 |
| Mode SS | |||
|---|---|---|---|
| Quadrant | BADHDUFLAG | Total packets | Discarded packets |
| A | 0 | 134 | 0 |
| B | 0 | 134 | 0 |
| C | 0 | 134 | 0 |
| D | 0 | 134 | 0 |
| Mode M0 | |||
|---|---|---|---|
| Quadrant | BADHDUFLAG | Total packets | Discarded packets |
| A | 0 | 14260 | 2 |
| B | 0 | 20079 | 2 |
| C | 0 | 15991 | 2 |
| D | 0 | 14966 | 2 |
| Mode M9 | |||
|---|---|---|---|
| Quadrant | BADHDUFLAG | Total packets | Discarded packets |
| A | 0 | 12 | 0 |
| B | 0 | 13 | 0 |
| C | 0 | 13 | 0 |
| D | 0 | 13 | 0 |
| Quadrant | Total seconds | Saturated seconds | Saturation percentage |
|---|---|---|---|
| A | 6583 | 60 | 0.911439% |
| B | 6583 | 117 | 1.777305% |
| C | 6583 | 459 | 6.972505% |
| D | 6583 | 69 | 1.048154% |
Noise dominated data is calculated using 1-second bins in cleaned event files. If a bin has >2000 counts, and if more than 50% of those come from <1% of pixels, then it is considered to be noise-dominated and hence unusable.
| Quadrant | # 1 sec bins | Bins with >0 counts | Bins with >2000 counts | High rate bins dominated by noise | Noise dominated (total time) | Noise dominated (detector-on time) | Marked lightcurve |
|---|---|---|---|---|---|---|---|
| A | 7783 | 6584 | 0 | 0 | 0.00% | 0.00% | 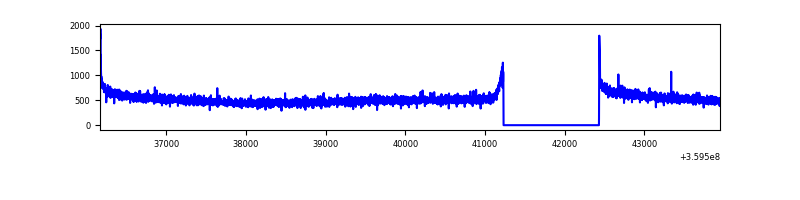 |
| B | 7783 | 6584 | 3 | 3 | 0.04% | 0.05% | 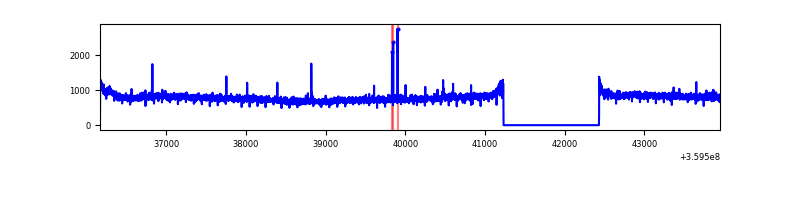 |
| C | 7783 | 6584 | 28 | 28 | 0.36% | 0.43% | 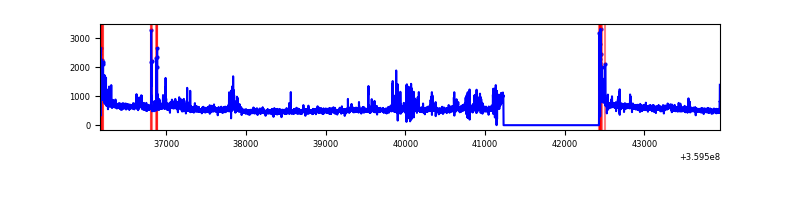 |
| D | 7783 | 6584 | 17 | 17 | 0.22% | 0.26% | 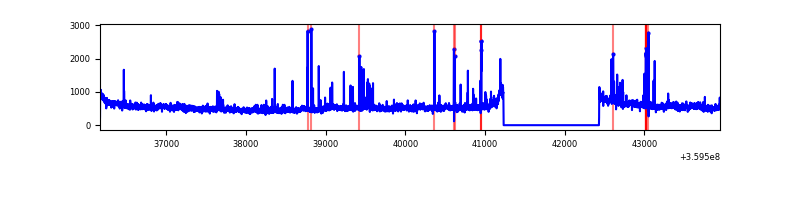 |
Top three noisy pixels from each quadrant. If the there are fewer than three noisy pixels in the level2.evt file, extra rows are filled as -1
| Pixel properties | Quadrant properties | ||||||
|---|---|---|---|---|---|---|---|
| Quadrant | DetID | PixID | Counts | Sigma | Mean | Median | Sigma |
| A | 8 | 192 | 22374 | 121.64 | 890 | 877 | 176.7 |
| A | 13 | 254 | 11442 | 59.78 | 890 | 877 | 176.7 |
| A | 3 | 137 | 8332 | 42.18 | 890 | 877 | 176.7 |
| B | 6 | 159 | 1745314 | 10549.04 | 872 | 853 | 165.4 |
| B | 12 | 111 | 19697 | 113.95 | 872 | 853 | 165.4 |
| B | 11 | 111 | 18356 | 105.84 | 872 | 853 | 165.4 |
| C | 14 | 238 | 224049 | 1161.19 | 829 | 839 | 192.2 |
| C | 3 | 233 | 152669 | 789.86 | 829 | 839 | 192.2 |
| C | 14 | 254 | 124590 | 643.78 | 829 | 839 | 192.2 |
| D | 8 | 195 | 227824 | 1115.67 | 869 | 849 | 203.4 |
| D | 5 | 222 | 79997 | 389.04 | 869 | 849 | 203.4 |
| D | 2 | 250 | 57462 | 278.27 | 869 | 849 | 203.4 |
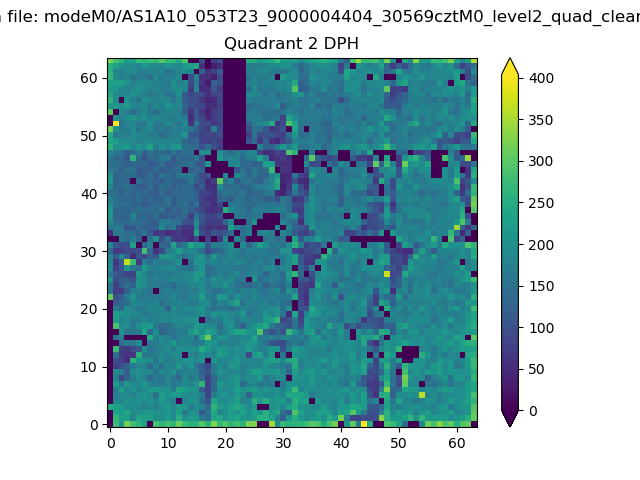
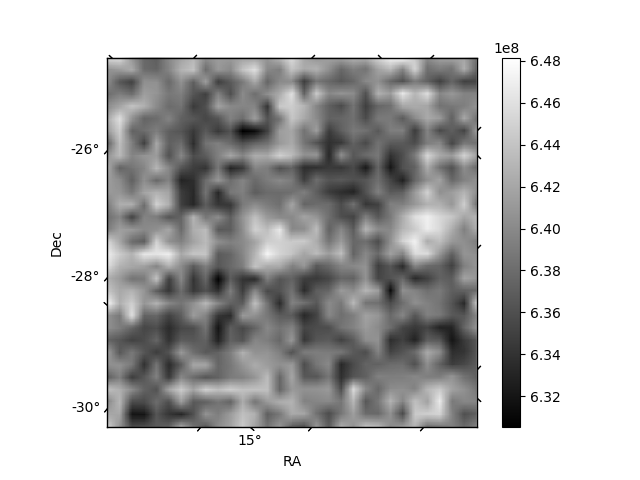
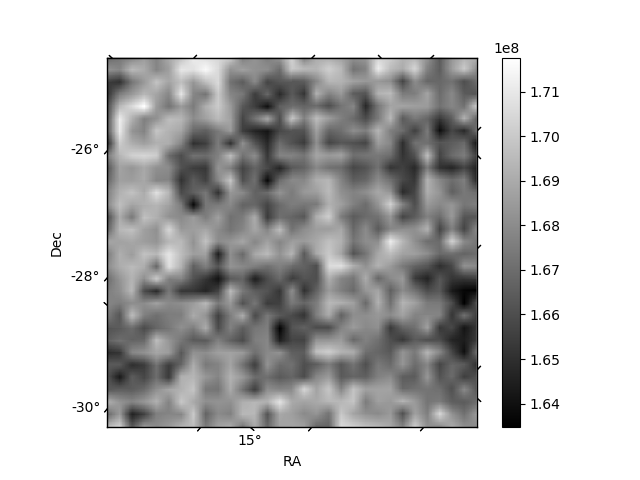
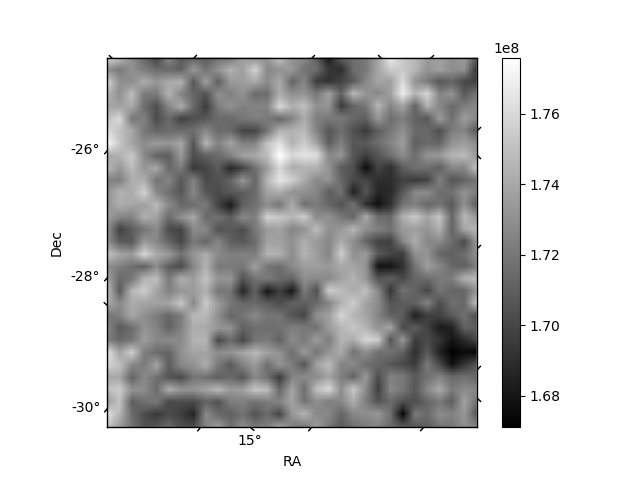
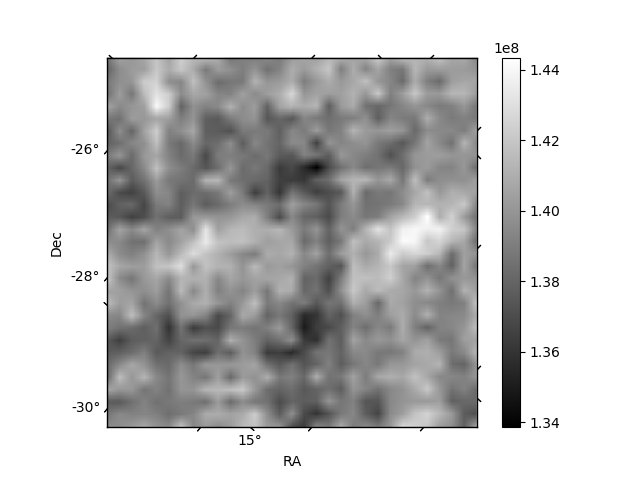
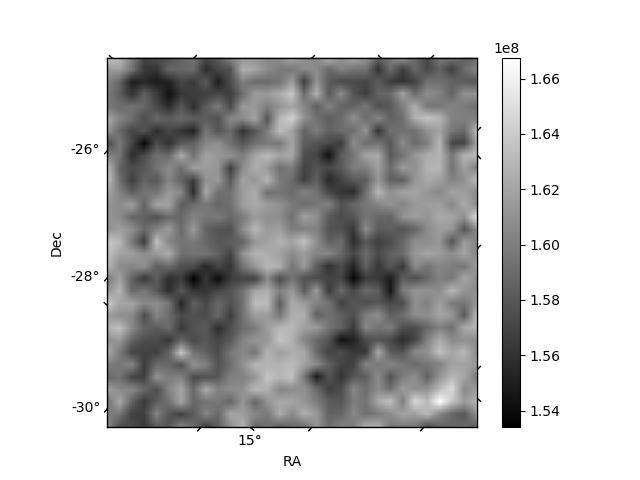
Histogram calculated using DETX and DETY for each event in the final _common_clean file
| Quadrant A | 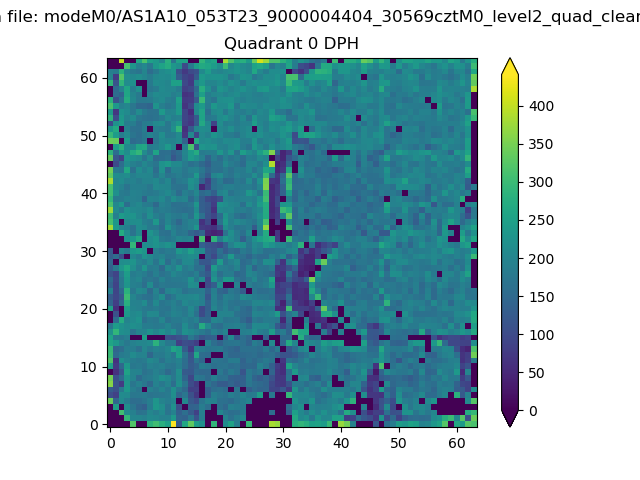 |
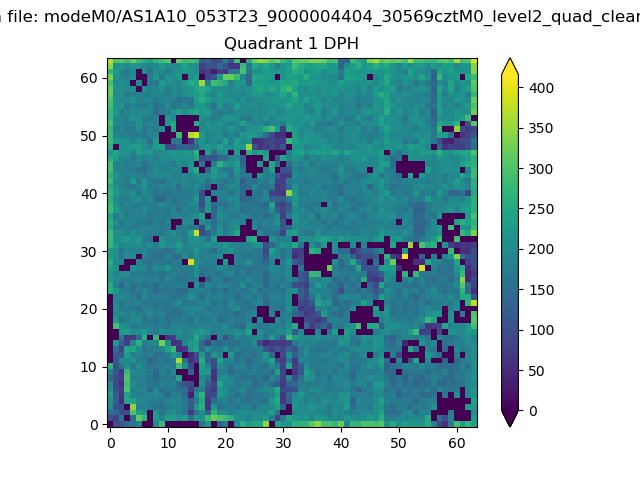 |
Quadrant B |
|---|---|---|---|
| Quadrant D | 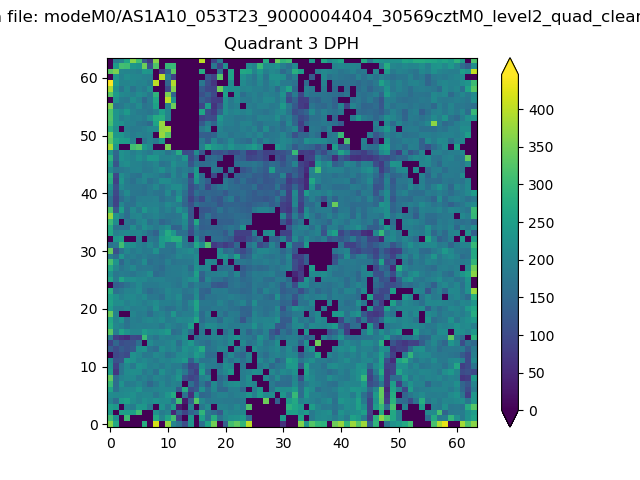 |
 |
Quadrant C |
| Plot type | Count rate plots | Images |
|---|---|---|
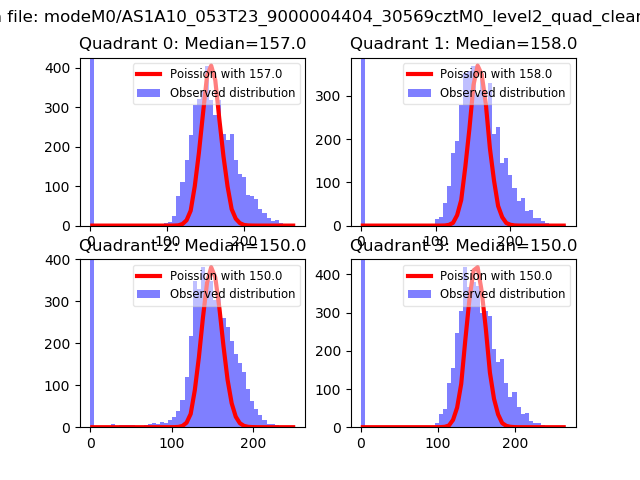
| Comparison with Poisson distribution Blue bars denote a histogram of data divided into 1 sec bins. Red curve is a Poisson curve with rate = median count rate of data. |
 |
 |
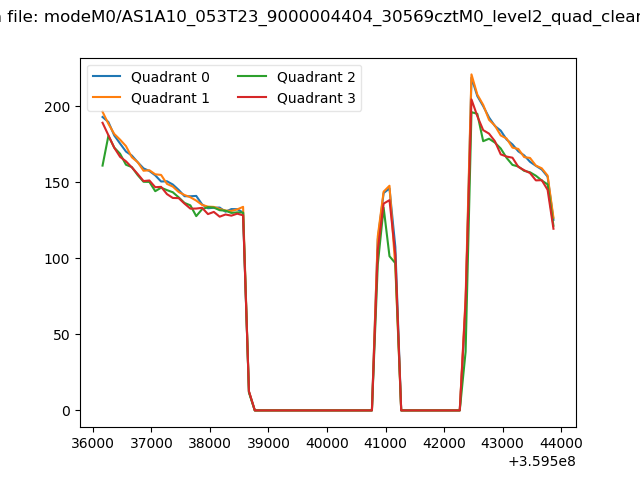
| Quadrant-wise count rates Data is divided into 100 sec bins |
 |
|
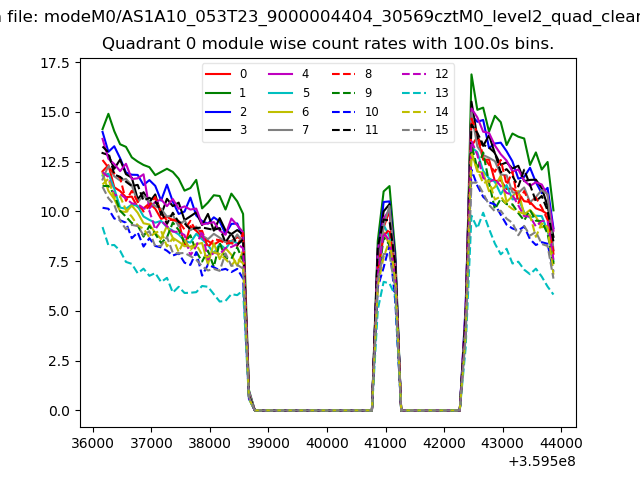
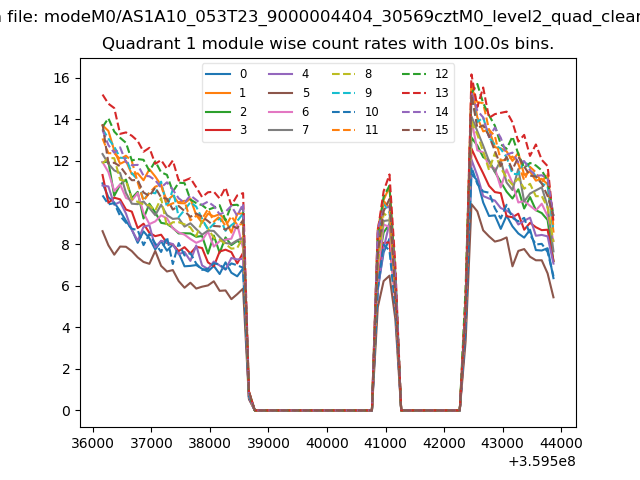
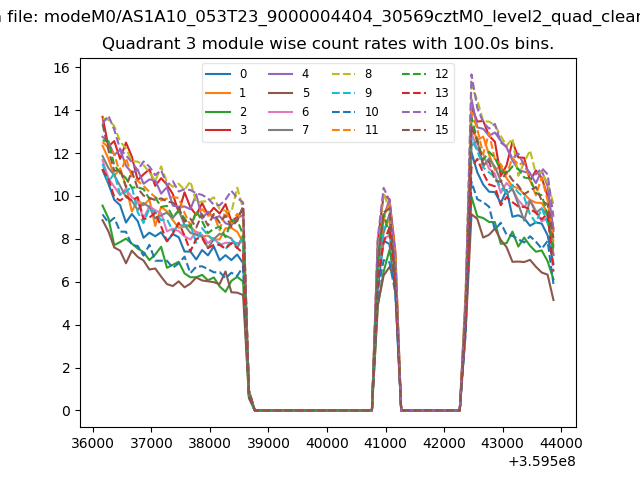
| Module-wise count rates for Quadrant A Data is divided into 100 sec bins |
 |
 |
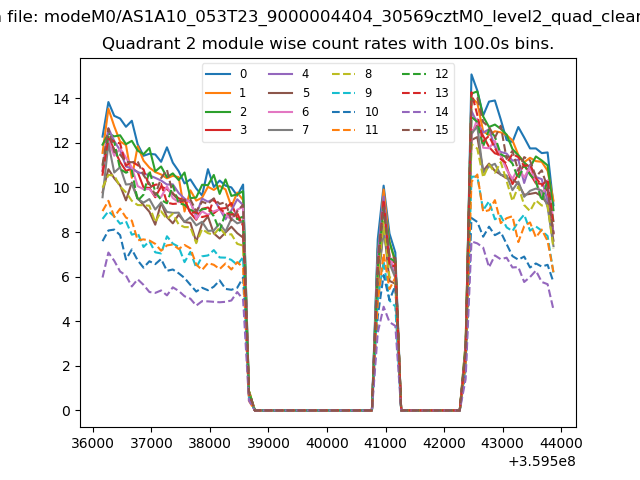
| Module-wise count rates for Quadrant B Data is divided into 100 sec bins |
 |
 |
| Module-wise count rates for Quadrant C Data is divided into 100 sec bins |
 |
 |
| Module-wise count rates for Quadrant D Data is divided into 100 sec bins |
 |
 |
| Parameter | Plot |
|---|---|
| CZT HV Monitor | 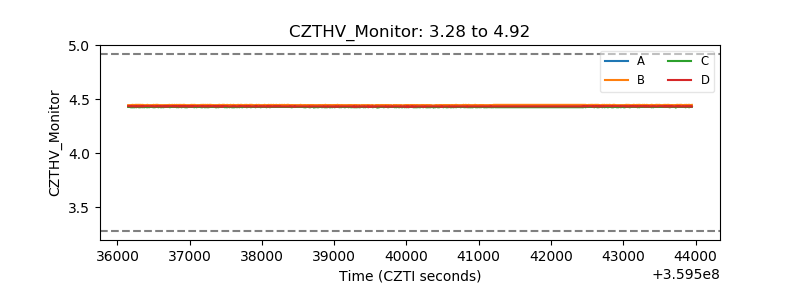 |
| D_VDD | 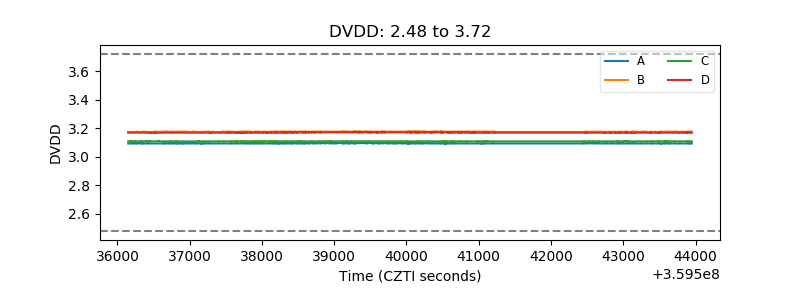 |
| Temperature 1 | 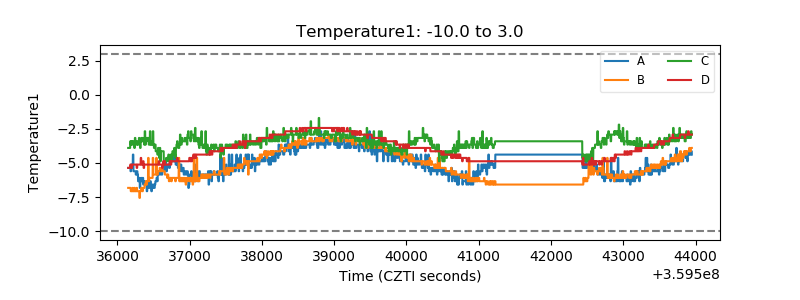 |
| Veto HV Monitor | 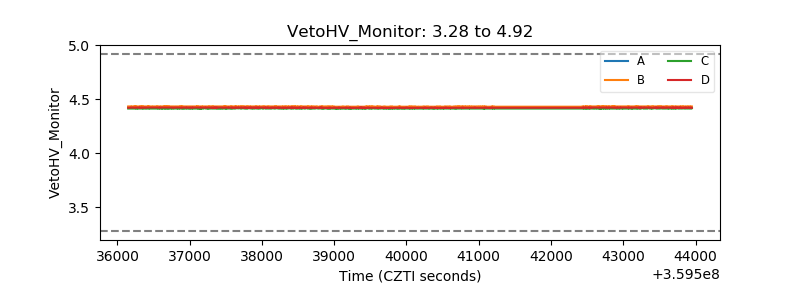 |
| Veto LLD | 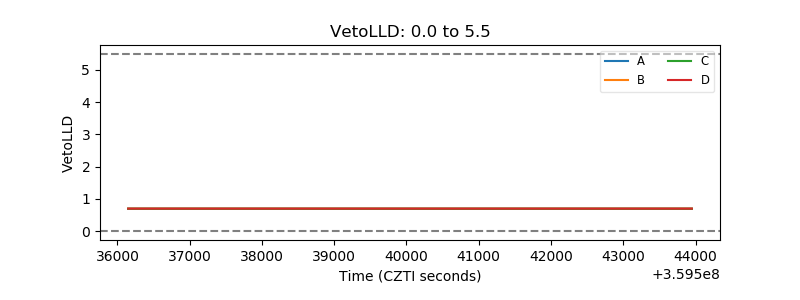 |
| Alpha Counter | 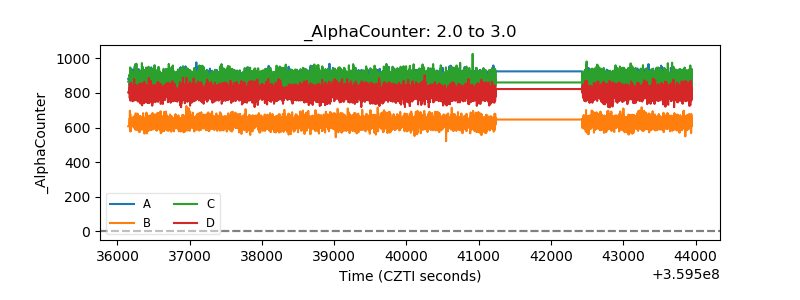 |
| _CPM_Rate | 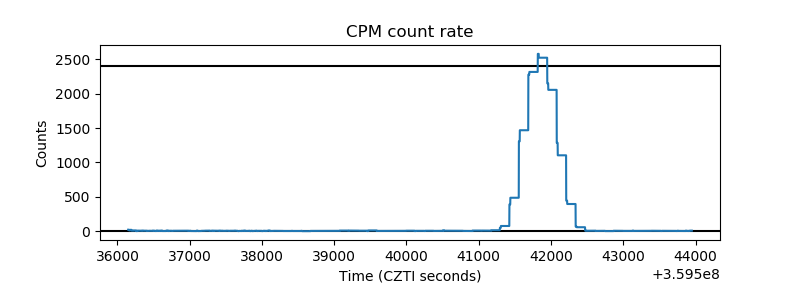 |
| CZT Counter |  |
| +2.5 Volts monitor |  |
| +5 Volts monitor |  |
| _ROLL_ROT | 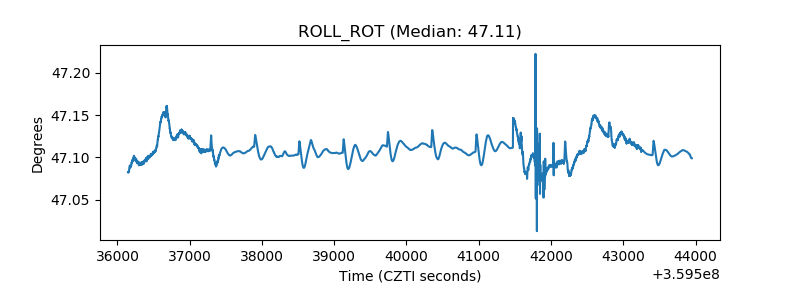 |
| _Roll_DEC | 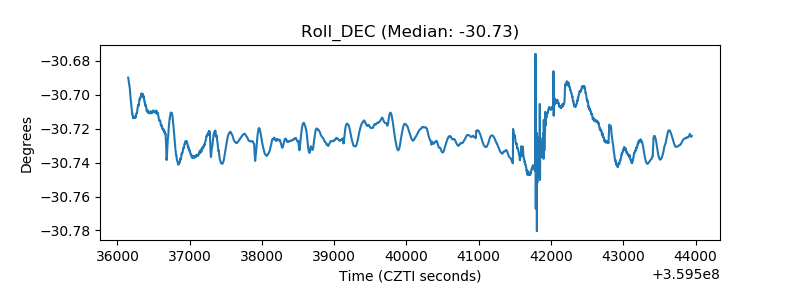 |
| _Roll_RA | 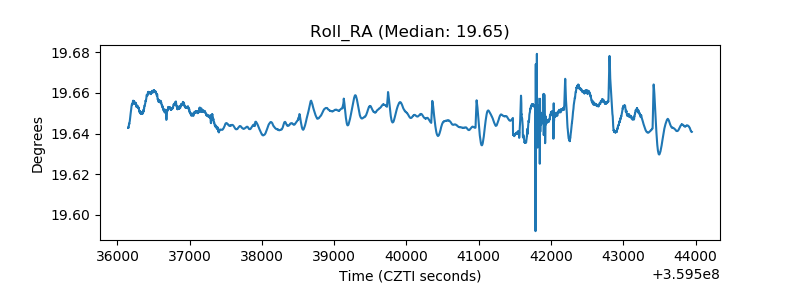 |
| Veto Counter | 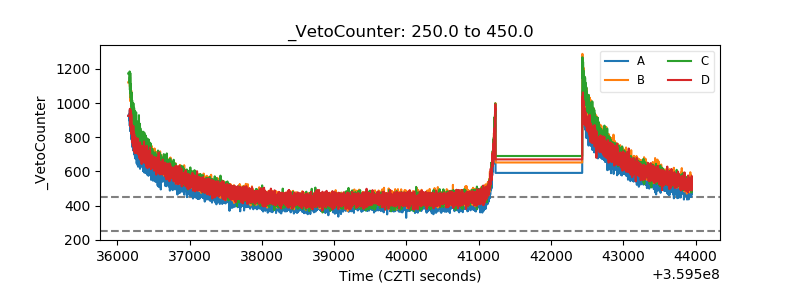 |