| Param | Original file | Final file |
|---|---|---|
| Filename | modeM0/AS1A10_053T23_9000004404_30570cztM0_level2.evt | modeM0/AS1A10_053T23_9000004404_30570cztM0_level2_quad_clean.evt |
| Size (bytes) | 554,901,120 | 105,287,040 |
| Size | 529.2 MB | 100.4 MB |
| Events in quadrant A | 3,476,947 | 714,763 |
| Events in quadrant B | 5,566,779 | 689,603 |
| Events in quadrant C | 3,645,561 | 665,955 |
| Events in quadrant D | 3,683,699 | 673,082 |
| Mode SS | |||
|---|---|---|---|
| Quadrant | BADHDUFLAG | Total packets | Discarded packets |
| A | 0 | 130 | 0 |
| B | 0 | 130 | 0 |
| C | 0 | 130 | 0 |
| D | 0 | 130 | 0 |
| Mode M0 | |||
|---|---|---|---|
| Quadrant | BADHDUFLAG | Total packets | Discarded packets |
| A | 0 | 14145 | 1 |
| B | 0 | 20979 | 1 |
| C | 0 | 14741 | 1 |
| D | 0 | 14879 | 1 |
| Mode M9 | |||
|---|---|---|---|
| Quadrant | BADHDUFLAG | Total packets | Discarded packets |
| A | 0 | 13 | 0 |
| B | 0 | 13 | 0 |
| C | 0 | 13 | 0 |
| D | 0 | 13 | 0 |
| Quadrant | Total seconds | Saturated seconds | Saturation percentage |
|---|---|---|---|
| A | 6379 | 46 | 0.721116% |
| B | 6379 | 370 | 5.800282% |
| C | 6379 | 166 | 2.602289% |
| D | 6379 | 35 | 0.548675% |
Noise dominated data is calculated using 1-second bins in cleaned event files. If a bin has >2000 counts, and if more than 50% of those come from <1% of pixels, then it is considered to be noise-dominated and hence unusable.
| Quadrant | # 1 sec bins | Bins with >0 counts | Bins with >2000 counts | High rate bins dominated by noise | Noise dominated (total time) | Noise dominated (detector-on time) | Marked lightcurve |
|---|---|---|---|---|---|---|---|
| A | 7699 | 6380 | 4 | 4 | 0.05% | 0.06% | 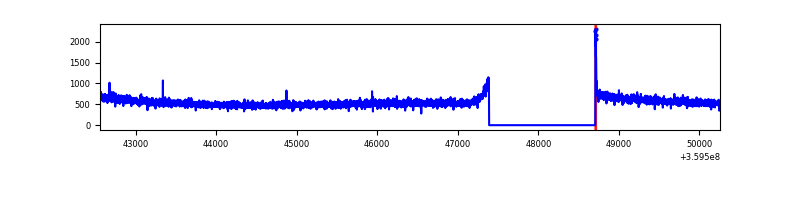 |
| B | 7699 | 6380 | 207 | 207 | 2.69% | 3.24% | 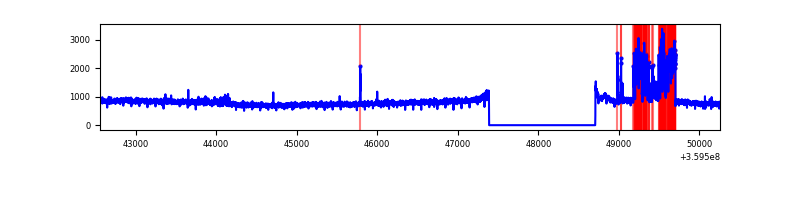 |
| C | 7699 | 6380 | 28 | 28 | 0.36% | 0.44% | 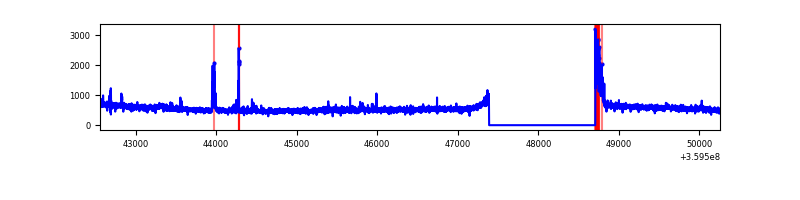 |
| D | 7699 | 6380 | 9 | 9 | 0.12% | 0.14% | 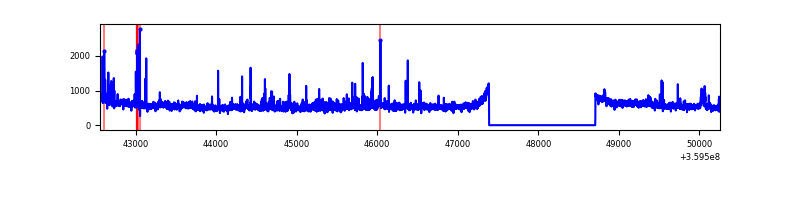 |
Top three noisy pixels from each quadrant. If the there are fewer than three noisy pixels in the level2.evt file, extra rows are filled as -1
| Pixel properties | Quadrant properties | ||||||
|---|---|---|---|---|---|---|---|
| Quadrant | DetID | PixID | Counts | Sigma | Mean | Median | Sigma |
| A | 8 | 192 | 14834 | 78.91 | 895 | 882 | 176.8 |
| A | 13 | 254 | 11598 | 60.61 | 895 | 882 | 176.8 |
| A | 13 | 210 | 11259 | 58.69 | 895 | 882 | 176.8 |
| B | 6 | 159 | 1632498 | 10267.44 | 854 | 836 | 158.9 |
| B | 6 | 36 | 561307 | 3526.83 | 854 | 836 | 158.9 |
| B | 12 | 111 | 18881 | 113.55 | 854 | 836 | 158.9 |
| C | 14 | 238 | 140269 | 720.54 | 833 | 840 | 193.5 |
| C | 0 | 10 | 116135 | 595.82 | 833 | 840 | 193.5 |
| C | 10 | 22 | 74938 | 382.92 | 833 | 840 | 193.5 |
| D | 8 | 195 | 179363 | 888.78 | 865 | 846 | 200.9 |
| D | 5 | 222 | 86183 | 424.87 | 865 | 846 | 200.9 |
| D | 2 | 250 | 70789 | 348.23 | 865 | 846 | 200.9 |
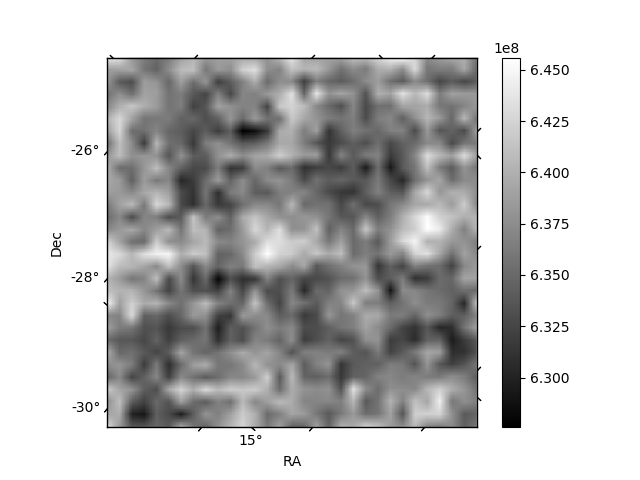
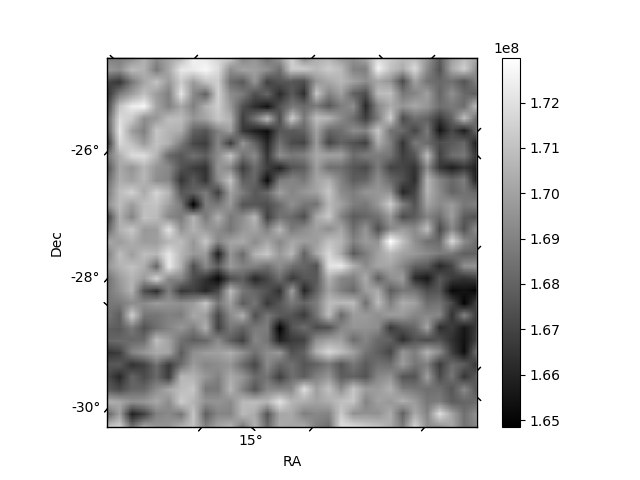
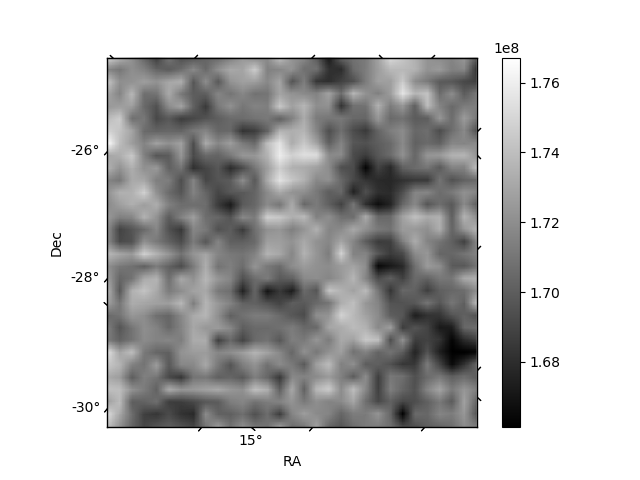
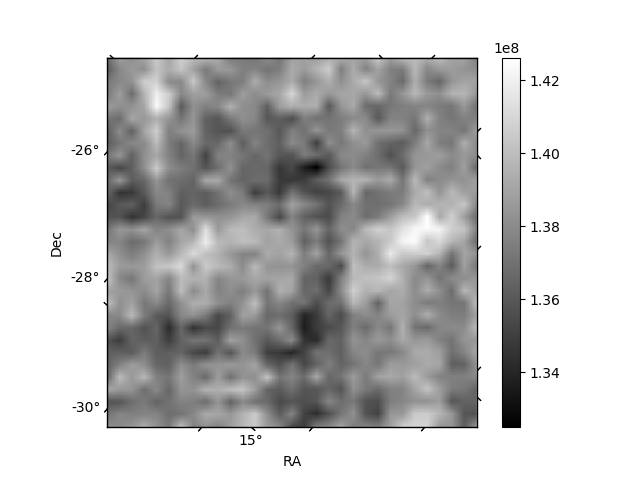
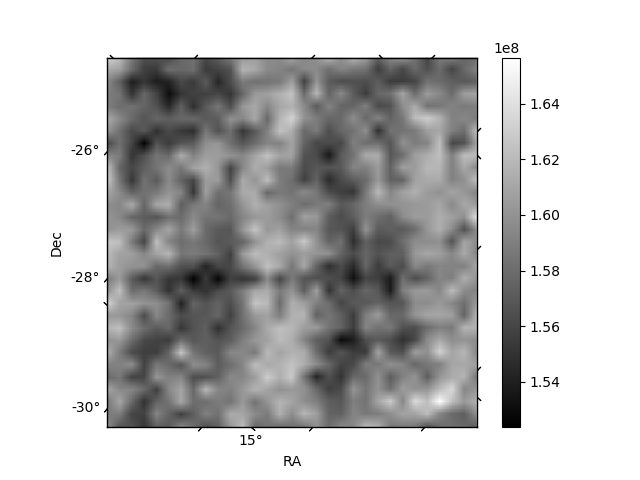
Histogram calculated using DETX and DETY for each event in the final _common_clean file
| Quadrant A | 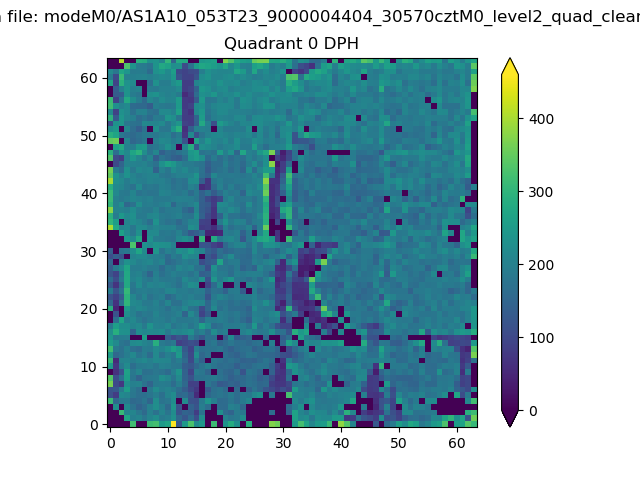 |
 |
Quadrant B |
|---|---|---|---|
| Quadrant D | 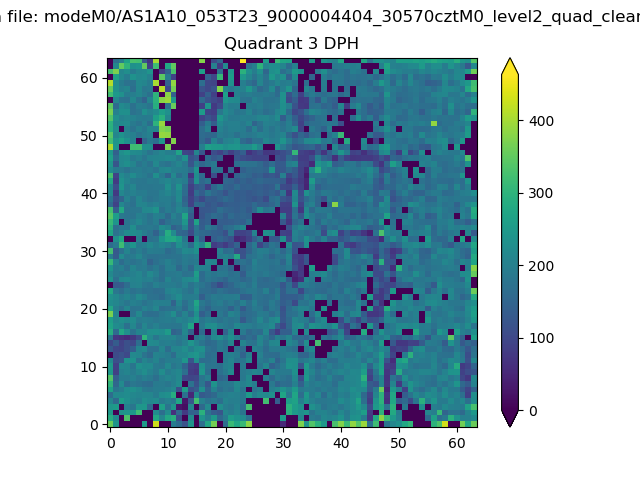 |
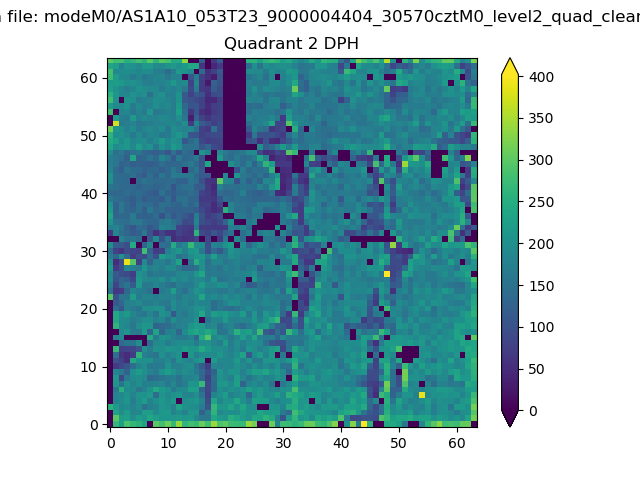 |
Quadrant C |
| Plot type | Count rate plots | Images |
|---|---|---|
| Comparison with Poisson distribution Blue bars denote a histogram of data divided into 1 sec bins. Red curve is a Poisson curve with rate = median count rate of data. |
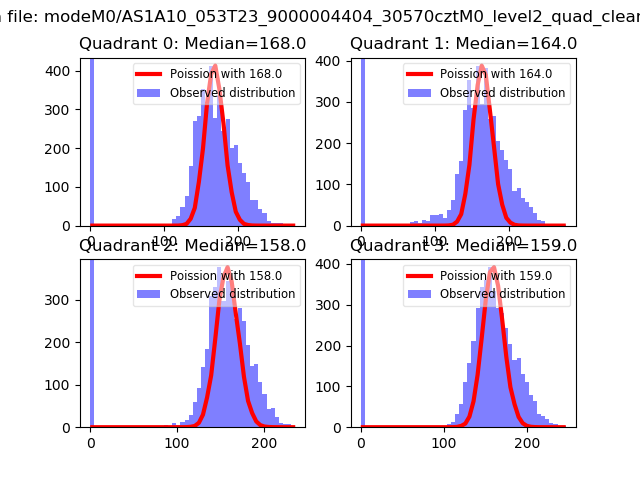 |
 |
| Quadrant-wise count rates Data is divided into 100 sec bins |
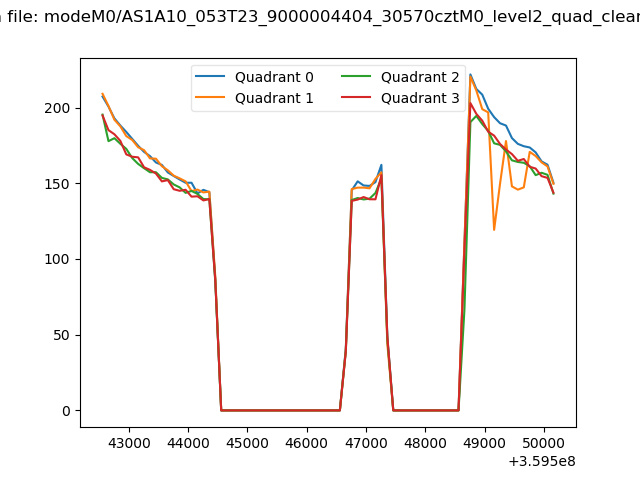 |
|
| Module-wise count rates for Quadrant A Data is divided into 100 sec bins |
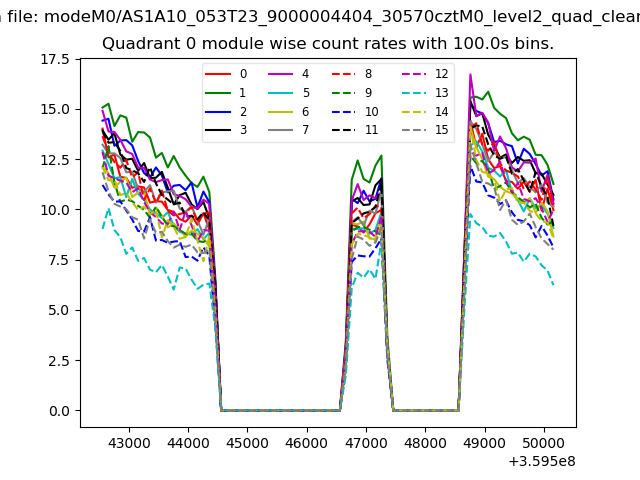 |
 |
| Module-wise count rates for Quadrant B Data is divided into 100 sec bins |
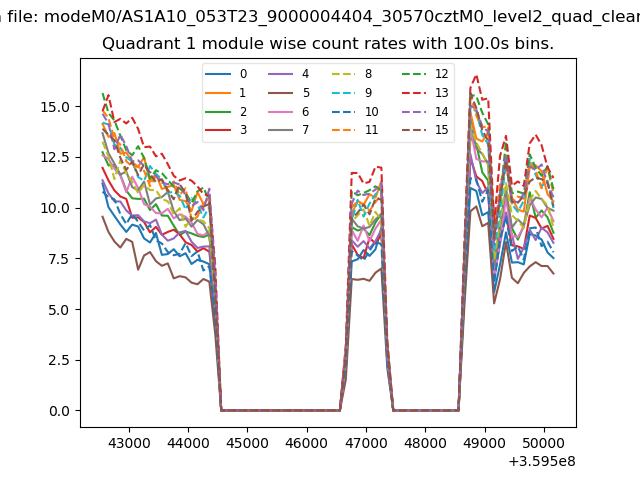 |
 |
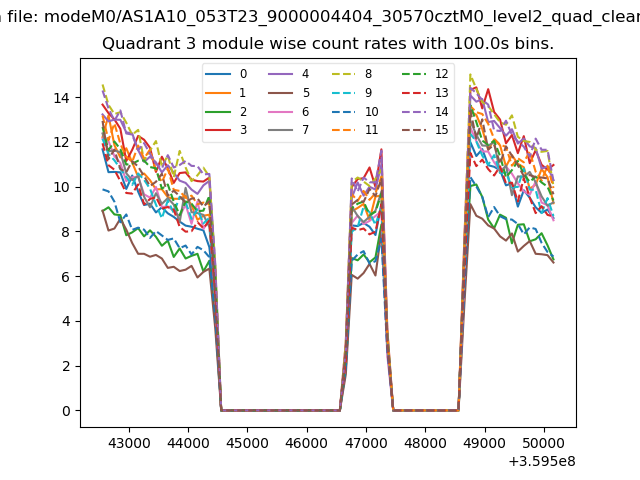
| Module-wise count rates for Quadrant C Data is divided into 100 sec bins |
 |
 |
| Module-wise count rates for Quadrant D Data is divided into 100 sec bins |
 |
 |
| Parameter | Plot |
|---|---|
| CZT HV Monitor |  |
| D_VDD | 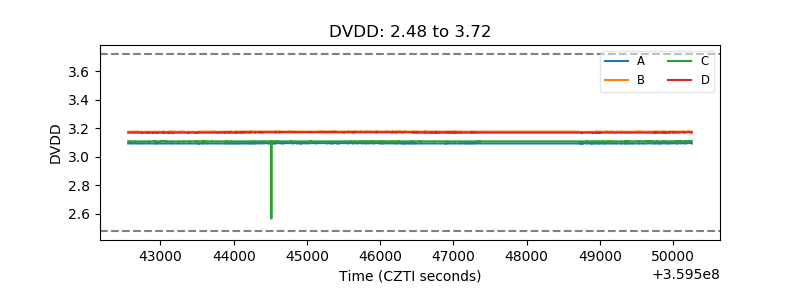 |
| Temperature 1 | 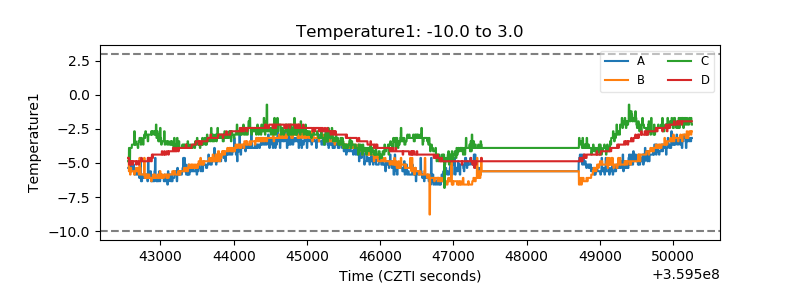 |
| Veto HV Monitor | 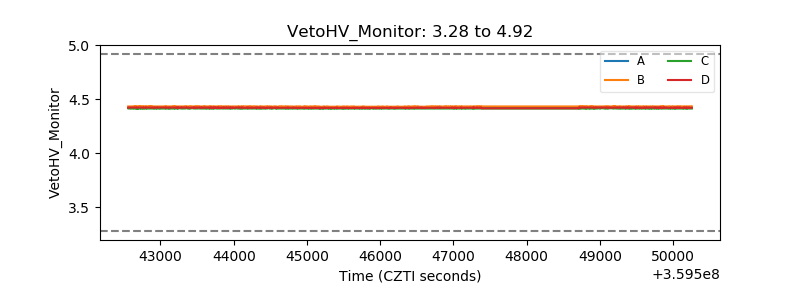 |
| Veto LLD | 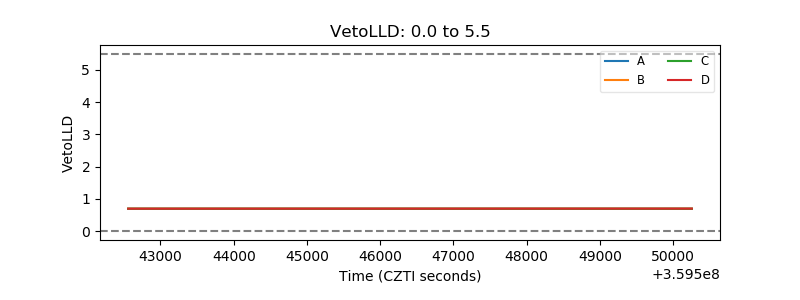 |
| Alpha Counter | 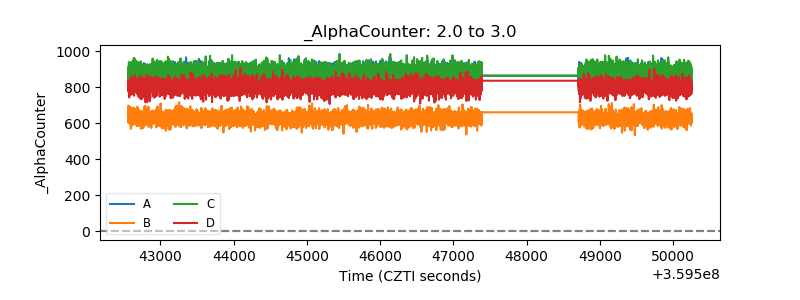 |
| _CPM_Rate | 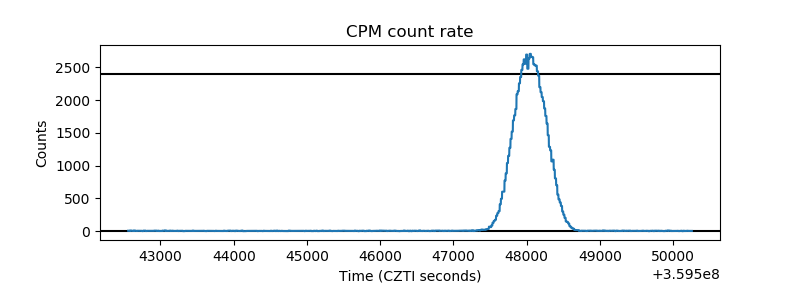 |
| CZT Counter | 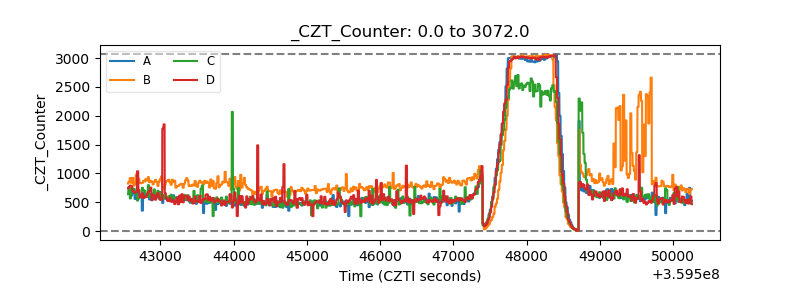 |
| +2.5 Volts monitor |  |
| +5 Volts monitor | 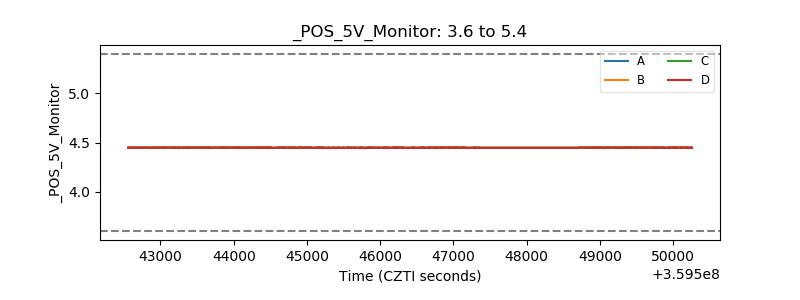 |
| _ROLL_ROT | 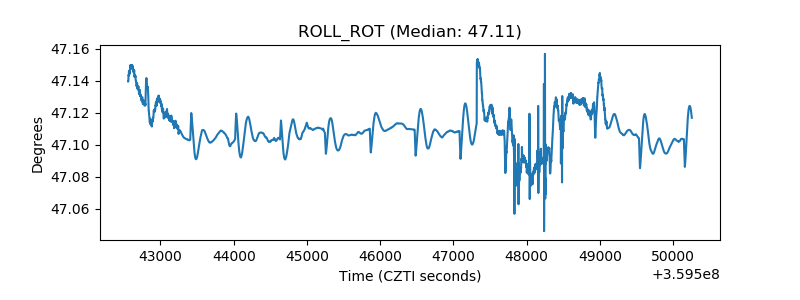 |
| _Roll_DEC | 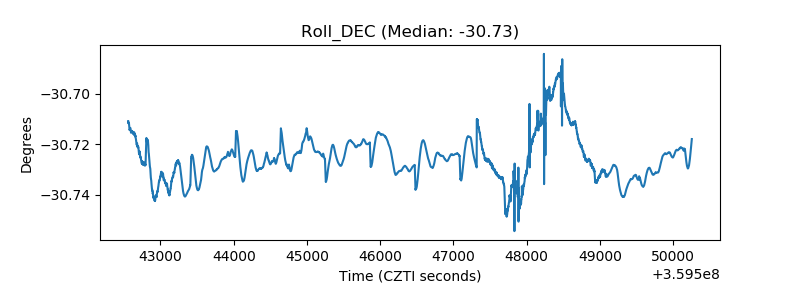 |
| _Roll_RA | 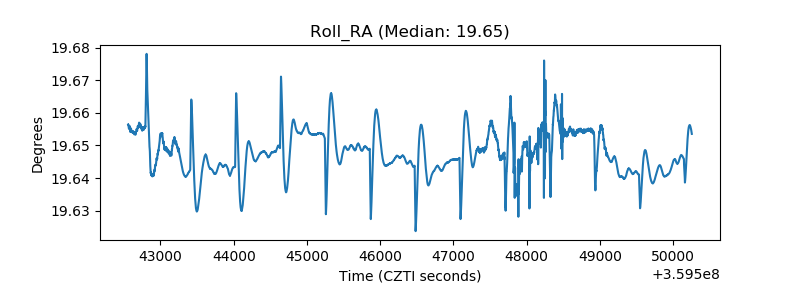 |
| Veto Counter | 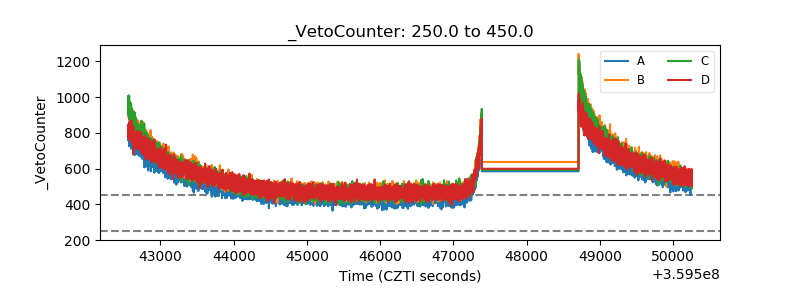 |