| Param | Original file | Final file |
|---|---|---|
| Filename | modeM0/AS1A10_053T23_9000004404_30571cztM0_level2.evt | modeM0/AS1A10_053T23_9000004404_30571cztM0_level2_quad_clean.evt |
| Size (bytes) | 560,609,280 | 94,910,400 |
| Size | 534.6 MB | 90.5 MB |
| Events in quadrant A | 3,567,329 | 641,384 |
| Events in quadrant B | 5,537,321 | 616,396 |
| Events in quadrant C | 3,813,344 | 586,932 |
| Events in quadrant D | 3,640,396 | 596,560 |
| Mode SS | |||
|---|---|---|---|
| Quadrant | BADHDUFLAG | Total packets | Discarded packets |
| A | 0 | 126 | 0 |
| B | 0 | 126 | 0 |
| C | 0 | 126 | 0 |
| D | 0 | 126 | 0 |
| Mode M0 | |||
|---|---|---|---|
| Quadrant | BADHDUFLAG | Total packets | Discarded packets |
| A | 0 | 14232 | 1 |
| B | 0 | 20714 | 1 |
| C | 0 | 15400 | 1 |
| D | 0 | 14649 | 1 |
| Mode M9 | |||
|---|---|---|---|
| Quadrant | BADHDUFLAG | Total packets | Discarded packets |
| A | 0 | 13 | 0 |
| B | 0 | 13 | 0 |
| C | 0 | 13 | 0 |
| D | 0 | 13 | 0 |
| Quadrant | Total seconds | Saturated seconds | Saturation percentage |
|---|---|---|---|
| A | 6200 | 106 | 1.709677% |
| B | 6201 | 424 | 6.837607% |
| C | 6201 | 393 | 6.337687% |
| D | 6201 | 53 | 0.854701% |
Noise dominated data is calculated using 1-second bins in cleaned event files. If a bin has >2000 counts, and if more than 50% of those come from <1% of pixels, then it is considered to be noise-dominated and hence unusable.
| Quadrant | # 1 sec bins | Bins with >0 counts | Bins with >2000 counts | High rate bins dominated by noise | Noise dominated (total time) | Noise dominated (detector-on time) | Marked lightcurve |
|---|---|---|---|---|---|---|---|
| A | 7535 | 6201 | 36 | 36 | 0.48% | 0.58% | 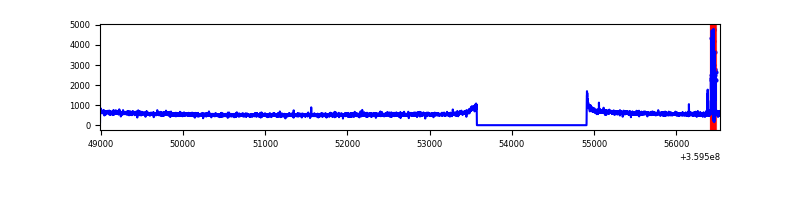 |
| B | 7536 | 6202 | 212 | 212 | 2.81% | 3.42% | 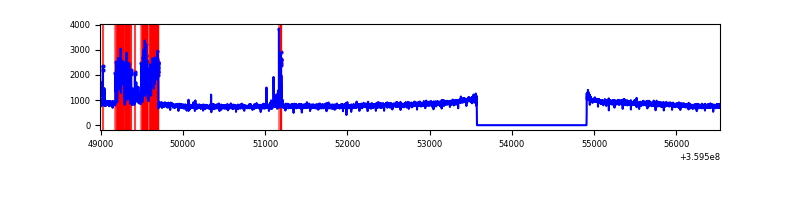 |
| C | 7536 | 6201 | 27 | 27 | 0.36% | 0.44% | 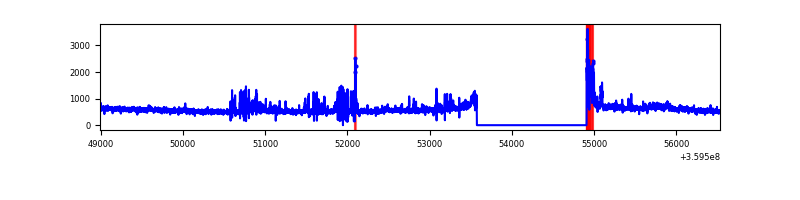 |
| D | 7536 | 6202 | 24 | 24 | 0.32% | 0.39% | 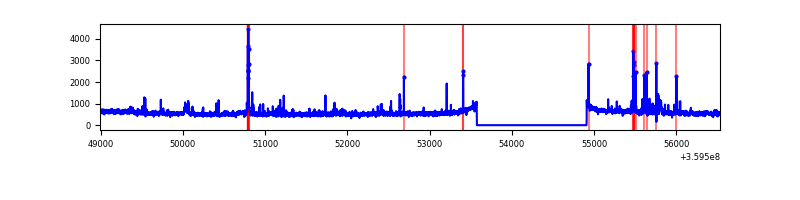 |
Top three noisy pixels from each quadrant. If the there are fewer than three noisy pixels in the level2.evt file, extra rows are filled as -1
| Pixel properties | Quadrant properties | ||||||
|---|---|---|---|---|---|---|---|
| Quadrant | DetID | PixID | Counts | Sigma | Mean | Median | Sigma |
| A | 12 | 96 | 142173 | 817.85 | 883 | 869 | 172.8 |
| A | 13 | 210 | 10906 | 58.09 | 883 | 869 | 172.8 |
| A | 13 | 254 | 10875 | 57.91 | 883 | 869 | 172.8 |
| B | 6 | 159 | 1633287 | 10263.55 | 847 | 830 | 159.1 |
| B | 6 | 36 | 584812 | 3671.6 | 847 | 830 | 159.1 |
| B | 12 | 111 | 18461 | 110.85 | 847 | 830 | 159.1 |
| C | 3 | 233 | 218208 | 1176.14 | 799 | 808 | 184.8 |
| C | 14 | 238 | 207817 | 1119.92 | 799 | 808 | 184.8 |
| C | 0 | 10 | 109123 | 585.99 | 799 | 808 | 184.8 |
| D | 8 | 195 | 164013 | 821.99 | 851 | 832 | 198.5 |
| D | 1 | 52 | 71102 | 353.97 | 851 | 832 | 198.5 |
| D | 13 | 249 | 69271 | 344.75 | 851 | 832 | 198.5 |
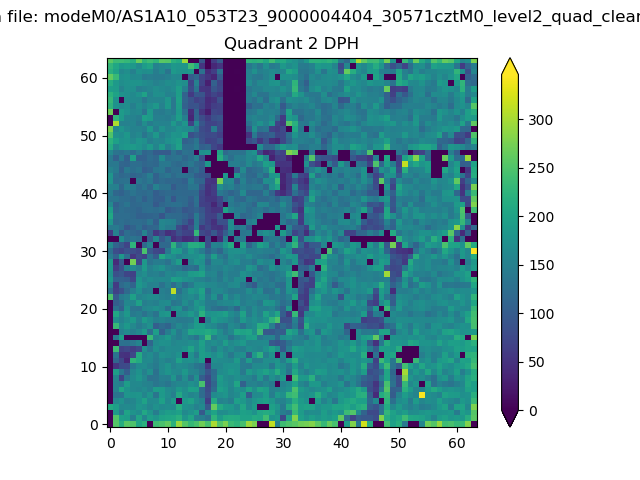
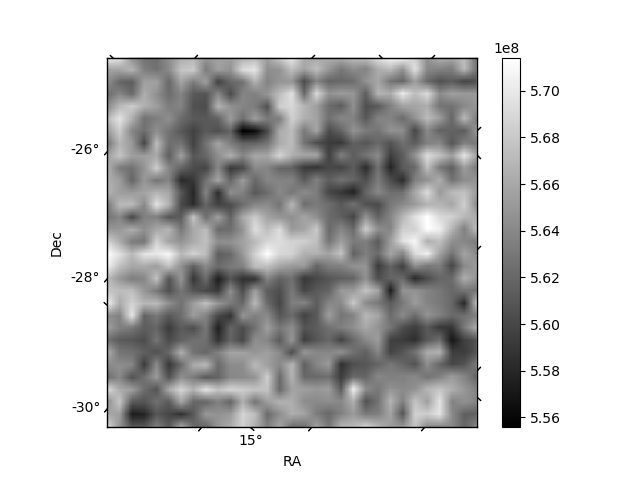
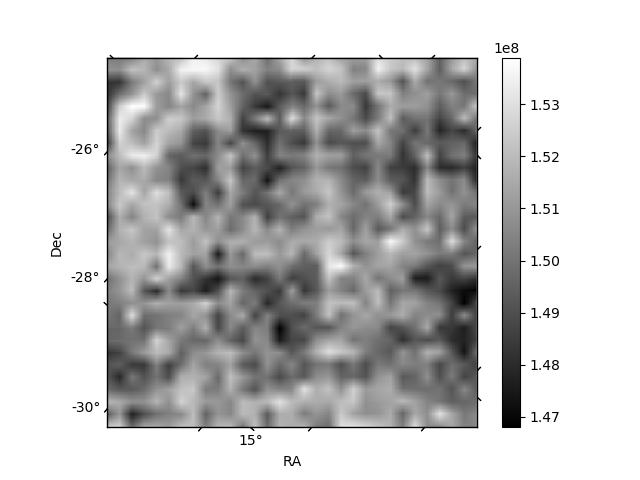
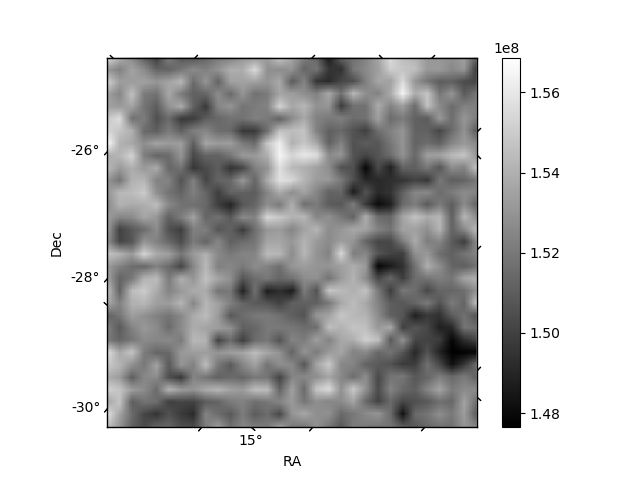
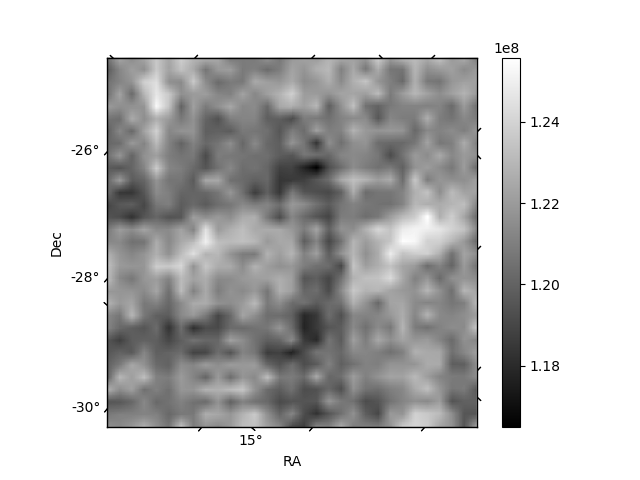
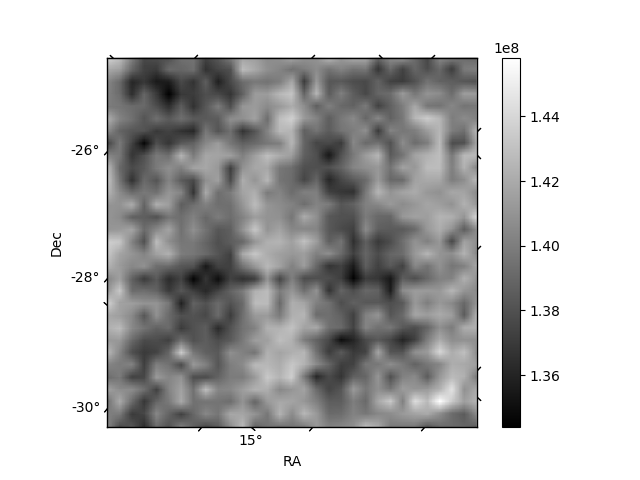
Histogram calculated using DETX and DETY for each event in the final _common_clean file
| Quadrant A | 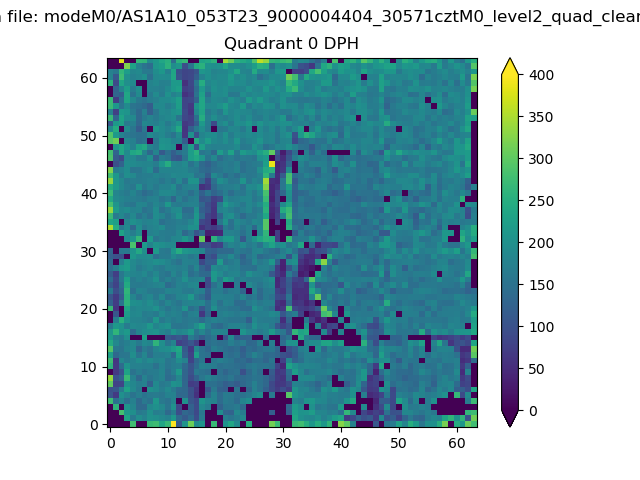 |
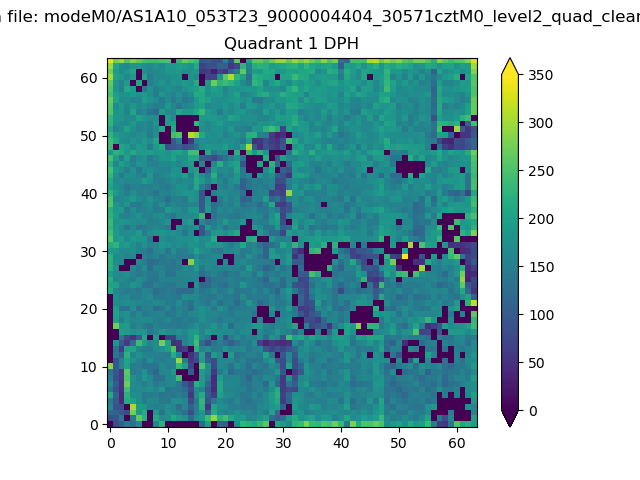 |
Quadrant B |
|---|---|---|---|
| Quadrant D | 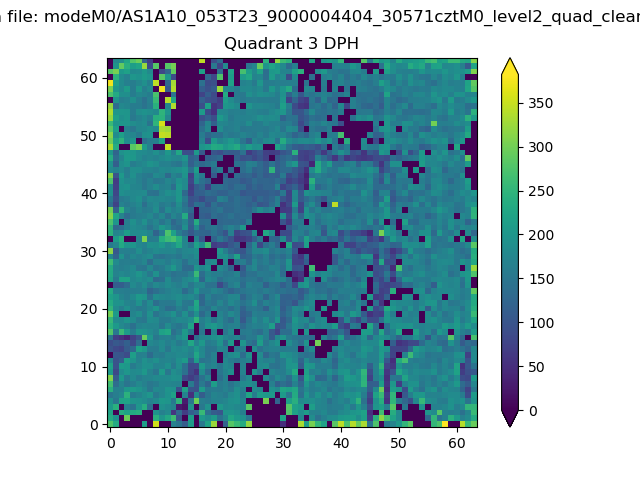 |
 |
Quadrant C |
| Plot type | Count rate plots | Images |
|---|---|---|
| Comparison with Poisson distribution Blue bars denote a histogram of data divided into 1 sec bins. Red curve is a Poisson curve with rate = median count rate of data. |
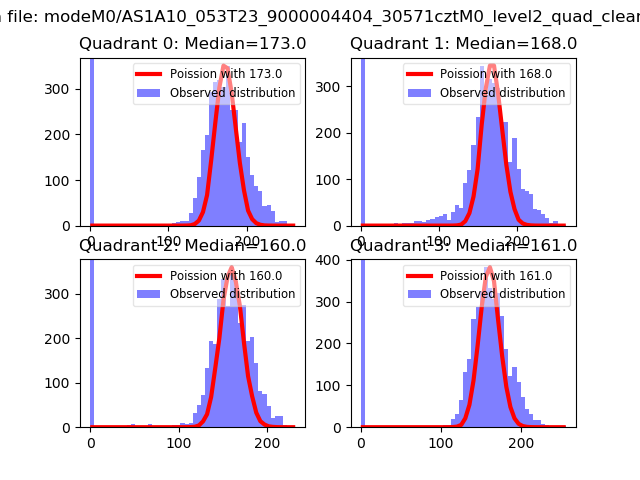 |
 |
| Quadrant-wise count rates Data is divided into 100 sec bins |
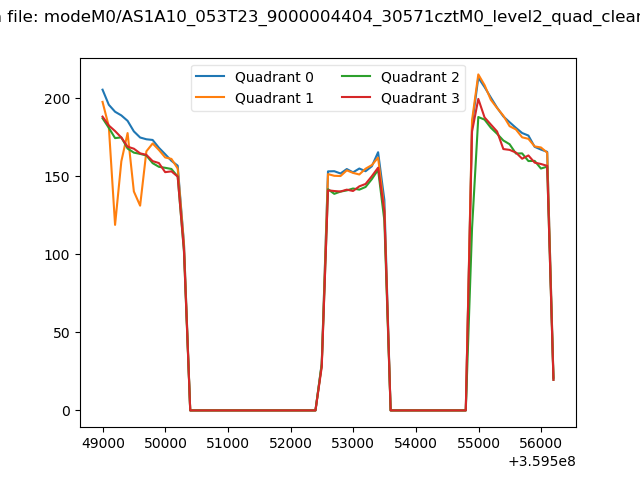 |
|
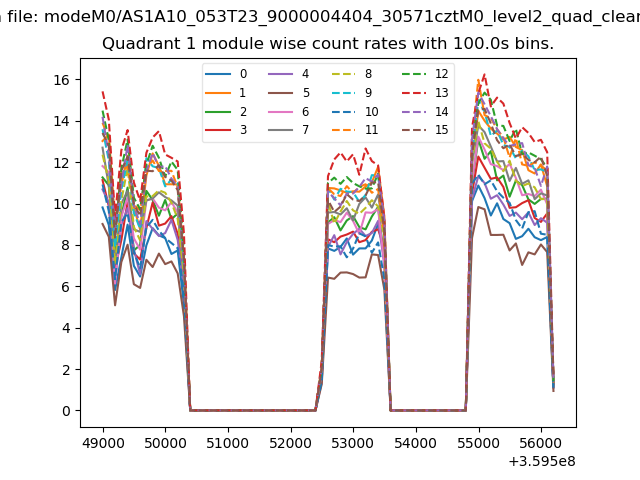
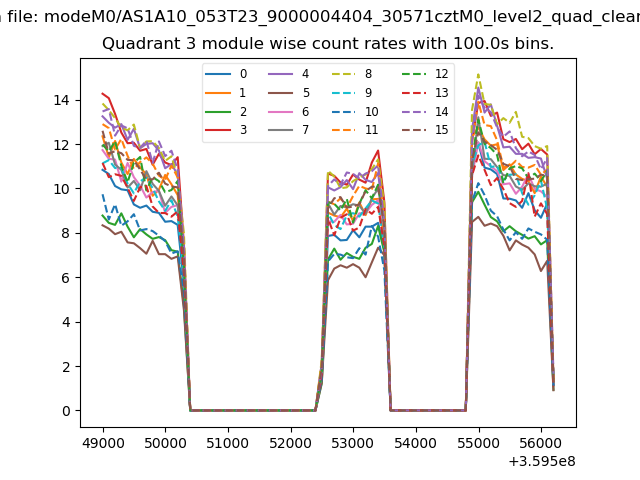
| Module-wise count rates for Quadrant A Data is divided into 100 sec bins |
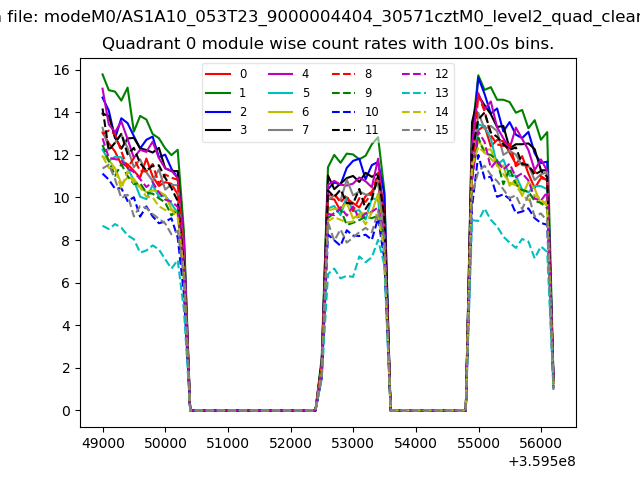 |
 |
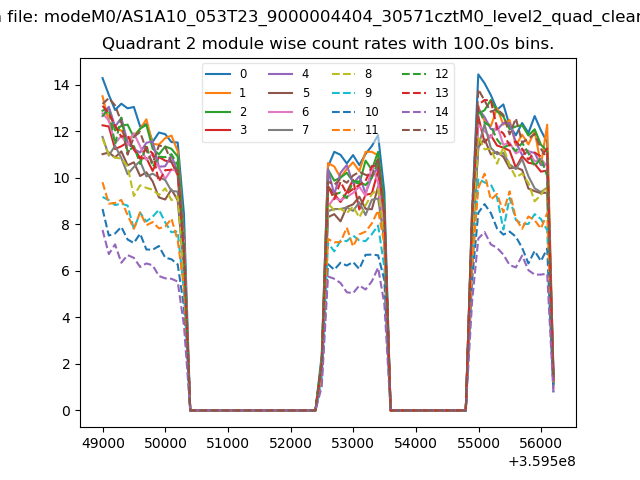
| Module-wise count rates for Quadrant B Data is divided into 100 sec bins |
 |
 |
| Module-wise count rates for Quadrant C Data is divided into 100 sec bins |
 |
 |
| Module-wise count rates for Quadrant D Data is divided into 100 sec bins |
 |
 |
| Parameter | Plot |
|---|---|
| CZT HV Monitor | 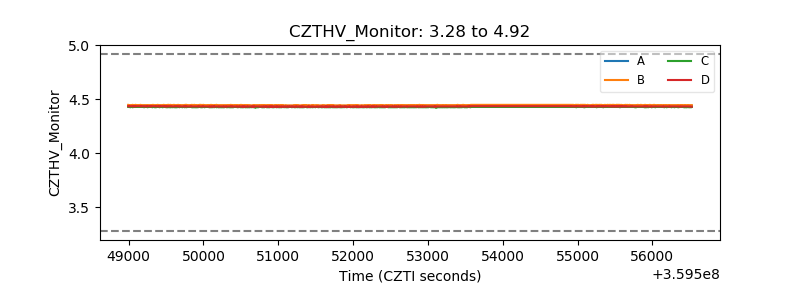 |
| D_VDD | 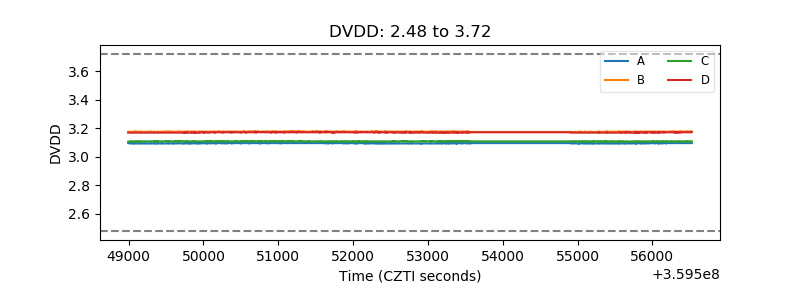 |
| Temperature 1 | 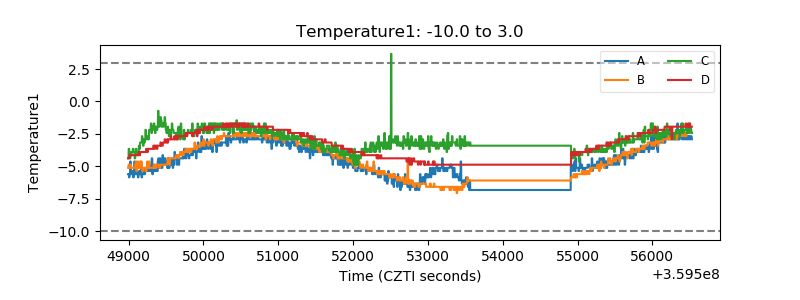 |
| Veto HV Monitor |  |
| Veto LLD | 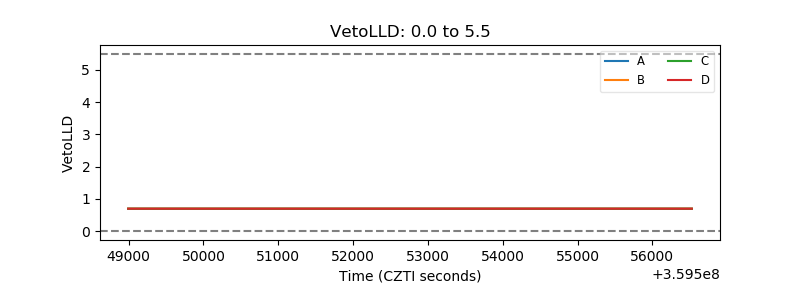 |
| Alpha Counter |  |
| _CPM_Rate | 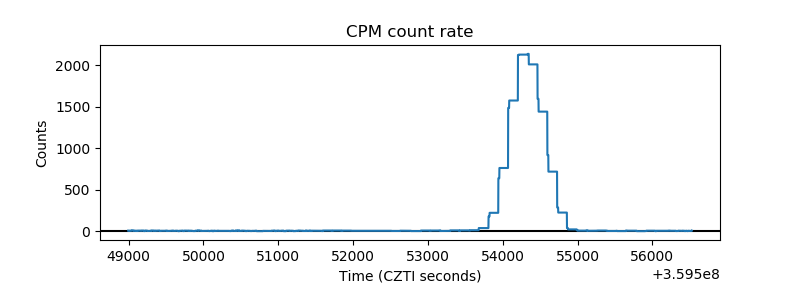 |
| CZT Counter | 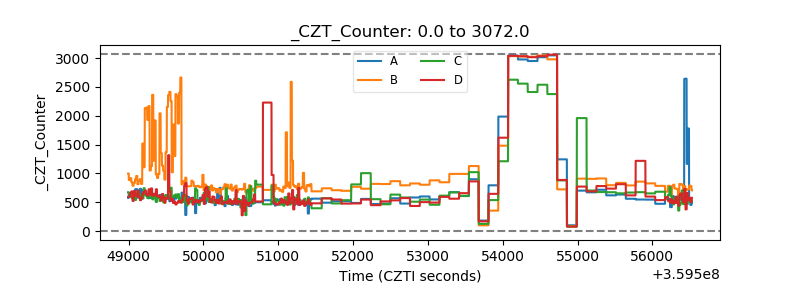 |
| +2.5 Volts monitor |  |
| +5 Volts monitor | 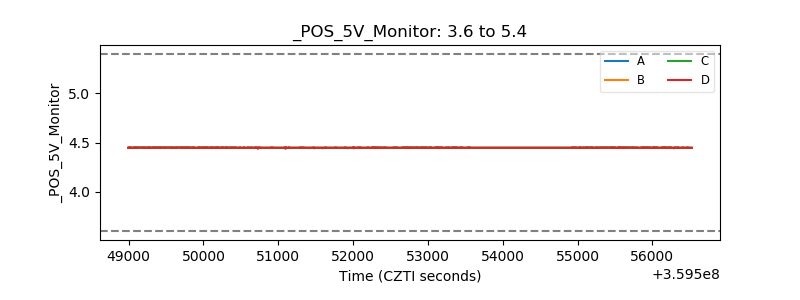 |
| _ROLL_ROT | 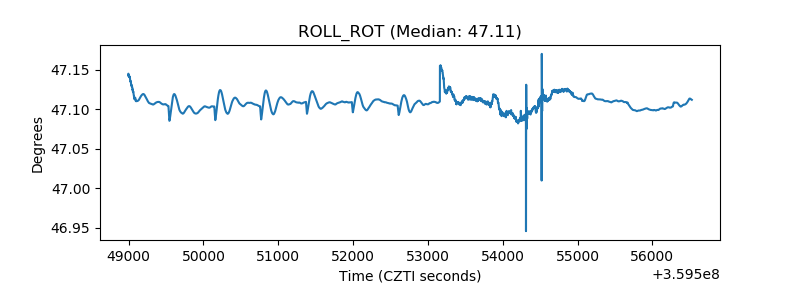 |
| _Roll_DEC | 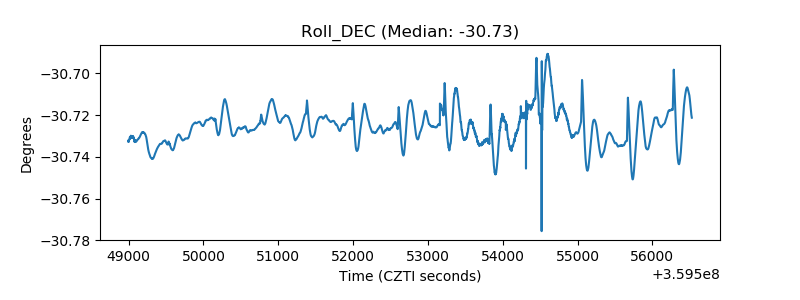 |
| _Roll_RA | 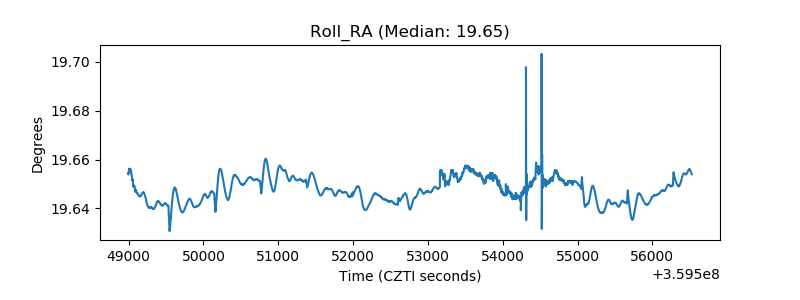 |
| Veto Counter | 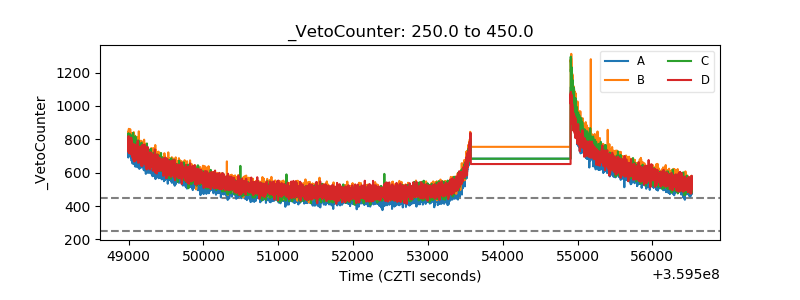 |