| Param | Original file | Final file |
|---|---|---|
| Filename | modeM0/AS1A10_053T23_9000004404_30572cztM0_level2.evt | modeM0/AS1A10_053T23_9000004404_30572cztM0_level2_quad_clean.evt |
| Size (bytes) | 541,532,160 | 80,677,440 |
| Size | 516.4 MB | 76.9 MB |
| Events in quadrant A | 3,479,446 | 525,881 |
| Events in quadrant B | 4,889,636 | 522,659 |
| Events in quadrant C | 3,461,069 | 484,486 |
| Events in quadrant D | 4,158,952 | 485,993 |
| Mode SS | |||
|---|---|---|---|
| Quadrant | BADHDUFLAG | Total packets | Discarded packets |
| A | 0 | 126 | 0 |
| B | 0 | 126 | 0 |
| C | 0 | 126 | 0 |
| D | 0 | 126 | 0 |
| Mode M0 | |||
|---|---|---|---|
| Quadrant | BADHDUFLAG | Total packets | Discarded packets |
| A | 0 | 13724 | 1 |
| B | 0 | 18600 | 1 |
| C | 0 | 13979 | 1 |
| D | 0 | 16248 | 1 |
| Mode M9 | |||
|---|---|---|---|
| Quadrant | BADHDUFLAG | Total packets | Discarded packets |
| A | 0 | 13 | 0 |
| B | 0 | 13 | 0 |
| C | 0 | 13 | 0 |
| D | 0 | 13 | 0 |
| Quadrant | Total seconds | Saturated seconds | Saturation percentage |
|---|---|---|---|
| A | 6070 | 138 | 2.273476% |
| B | 6070 | 140 | 2.306425% |
| C | 6071 | 157 | 2.586065% |
| D | 6071 | 153 | 2.520178% |
Noise dominated data is calculated using 1-second bins in cleaned event files. If a bin has >2000 counts, and if more than 50% of those come from <1% of pixels, then it is considered to be noise-dominated and hence unusable.
| Quadrant | # 1 sec bins | Bins with >0 counts | Bins with >2000 counts | High rate bins dominated by noise | Noise dominated (total time) | Noise dominated (detector-on time) | Marked lightcurve |
|---|---|---|---|---|---|---|---|
| A | 7365 | 6072 | 40 | 40 | 0.54% | 0.66% | 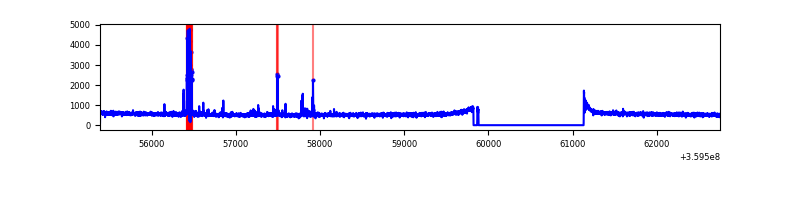 |
| B | 7365 | 6072 | 4 | 4 | 0.05% | 0.07% | 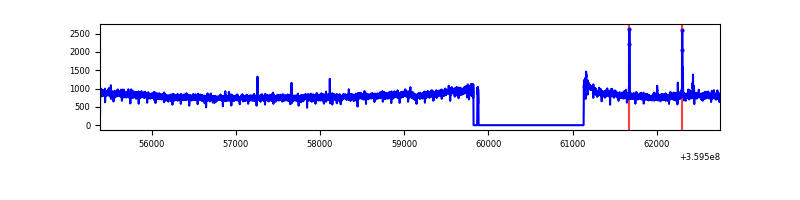 |
| C | 7366 | 6073 | 19 | 19 | 0.26% | 0.31% | 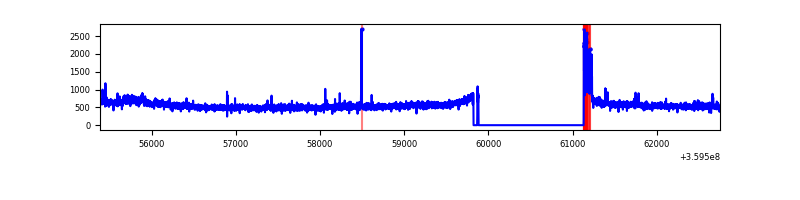 |
| D | 7366 | 6073 | 100 | 100 | 1.36% | 1.65% | 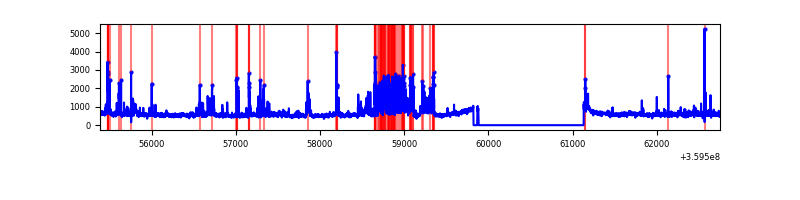 |
Top three noisy pixels from each quadrant. If the there are fewer than three noisy pixels in the level2.evt file, extra rows are filled as -1
| Pixel properties | Quadrant properties | ||||||
|---|---|---|---|---|---|---|---|
| Quadrant | DetID | PixID | Counts | Sigma | Mean | Median | Sigma |
| A | 12 | 96 | 202757 | 1208.29 | 847 | 833 | 167.1 |
| A | 13 | 254 | 10719 | 59.16 | 847 | 833 | 167.1 |
| A | 8 | 192 | 9004 | 48.89 | 847 | 833 | 167.1 |
| B | 6 | 159 | 1589624 | 10238.72 | 828 | 810 | 155.2 |
| B | 6 | 36 | 35712 | 224.92 | 828 | 810 | 155.2 |
| B | 12 | 111 | 18513 | 114.08 | 828 | 810 | 155.2 |
| C | 3 | 233 | 137241 | 751.99 | 783 | 789 | 181.5 |
| C | 14 | 238 | 129651 | 710.16 | 783 | 789 | 181.5 |
| C | 0 | 10 | 99531 | 544.17 | 783 | 789 | 181.5 |
| D | 5 | 222 | 562347 | 2979.32 | 810 | 792 | 188.5 |
| D | 8 | 195 | 257830 | 1363.71 | 810 | 792 | 188.5 |
| D | 13 | 249 | 85553 | 449.7 | 810 | 792 | 188.5 |
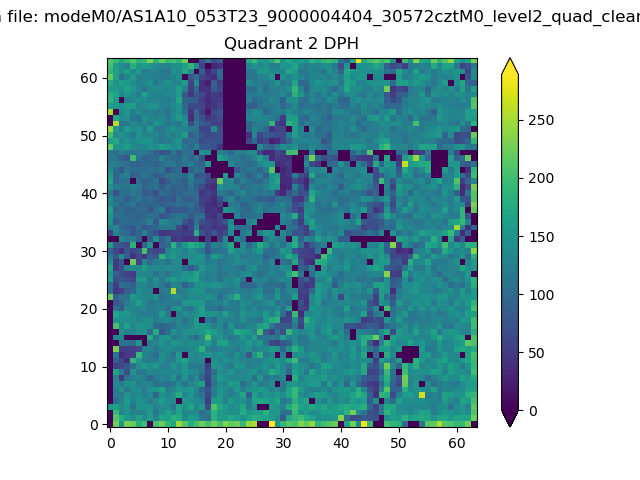
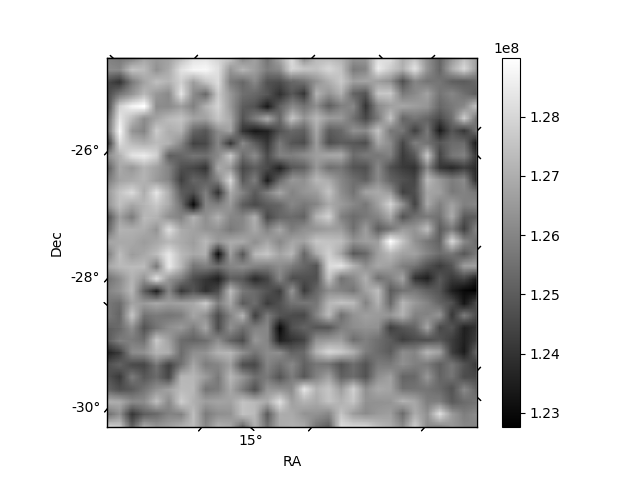
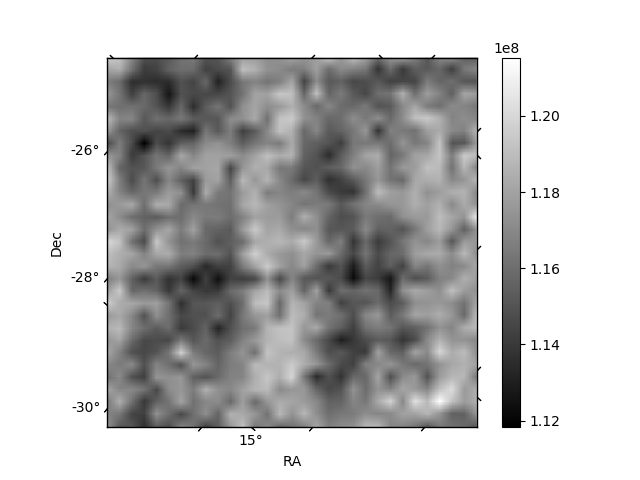
Histogram calculated using DETX and DETY for each event in the final _common_clean file
| Quadrant A | 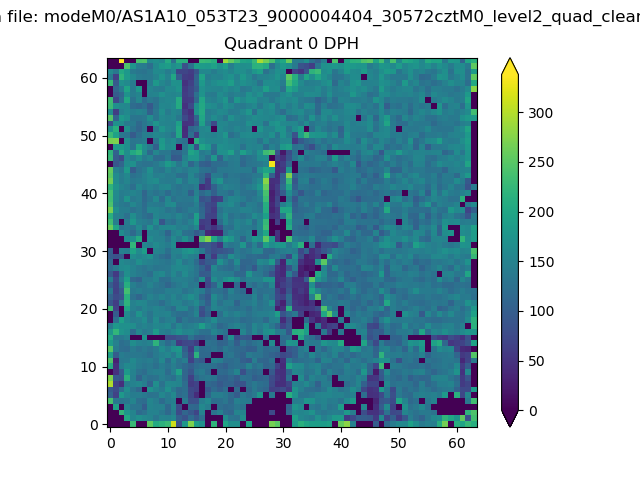 |
 |
Quadrant B |
|---|---|---|---|
| Quadrant D |  |
 |
Quadrant C |
| Plot type | Count rate plots | Images |
|---|---|---|
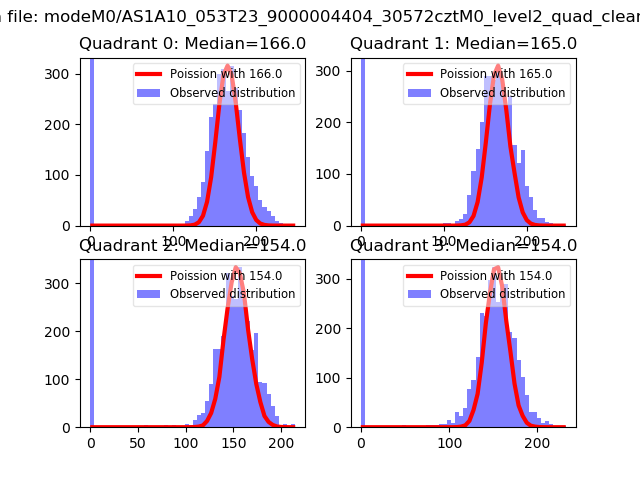
| Comparison with Poisson distribution Blue bars denote a histogram of data divided into 1 sec bins. Red curve is a Poisson curve with rate = median count rate of data. |
 |
 |
| Quadrant-wise count rates Data is divided into 100 sec bins |
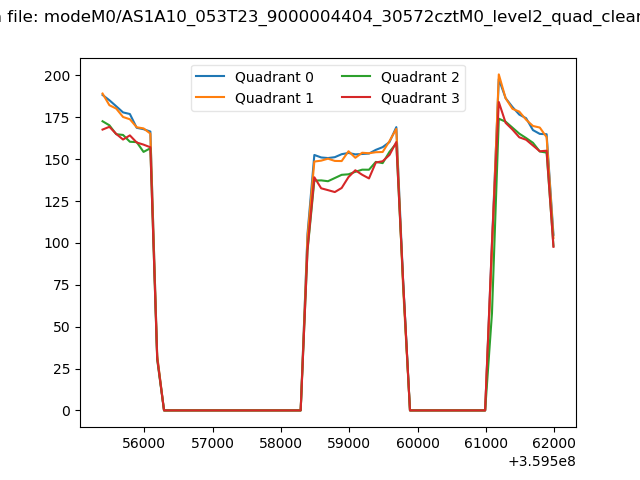 |
|
| Module-wise count rates for Quadrant A Data is divided into 100 sec bins |
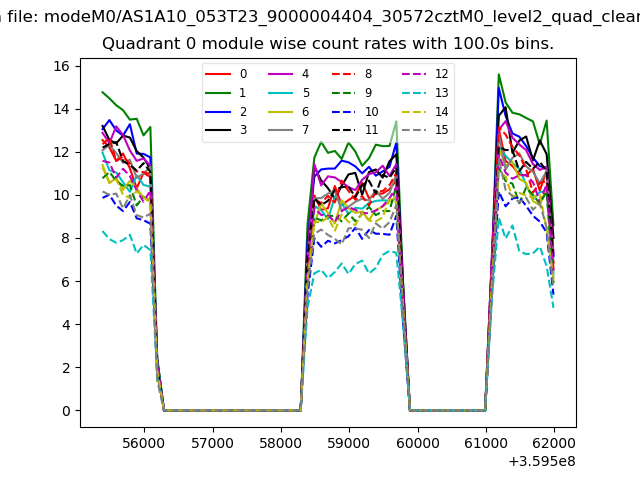 |
 |
| Module-wise count rates for Quadrant B Data is divided into 100 sec bins |
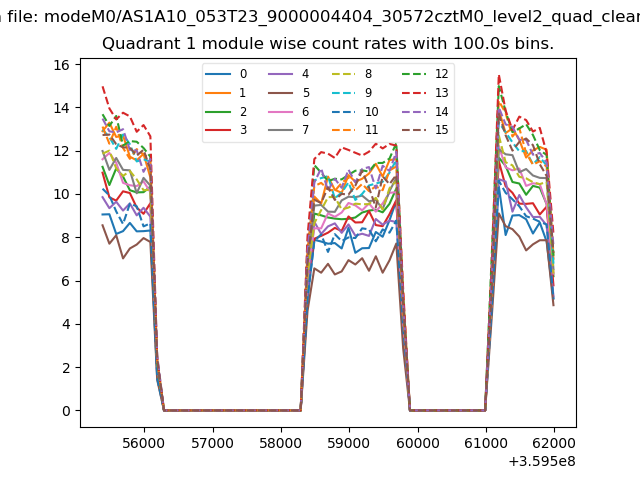 |
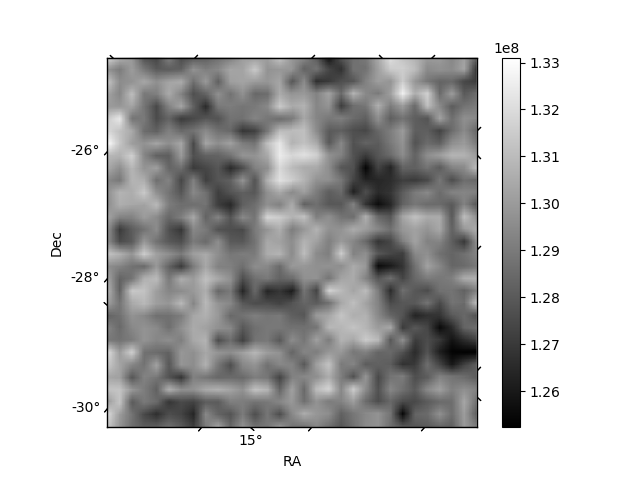 |
| Module-wise count rates for Quadrant C Data is divided into 100 sec bins |
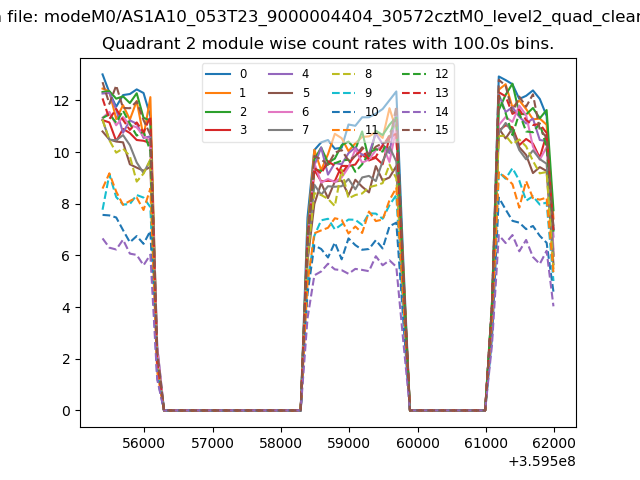 |
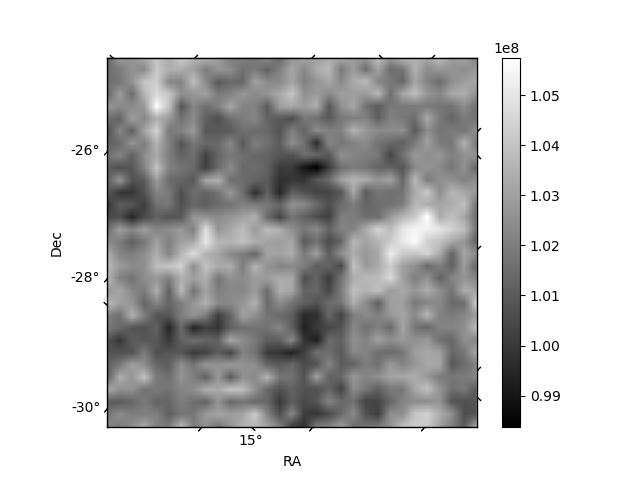 |
| Module-wise count rates for Quadrant D Data is divided into 100 sec bins |
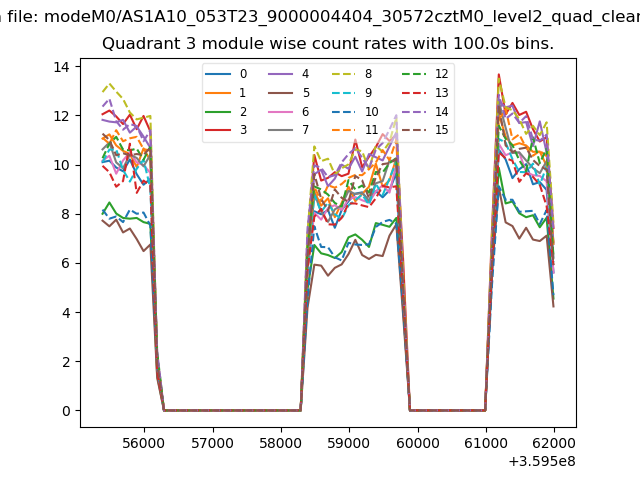 |
 |
| Parameter | Plot |
|---|---|
| CZT HV Monitor | 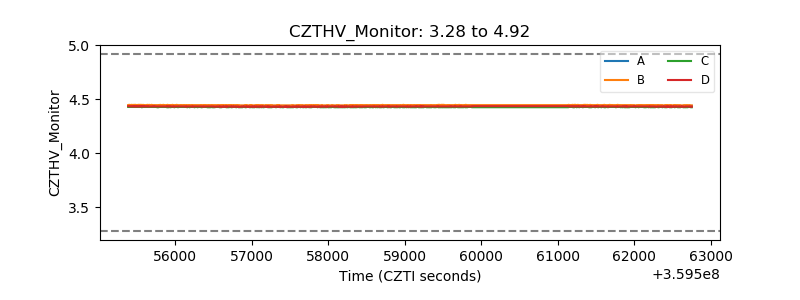 |
| D_VDD | 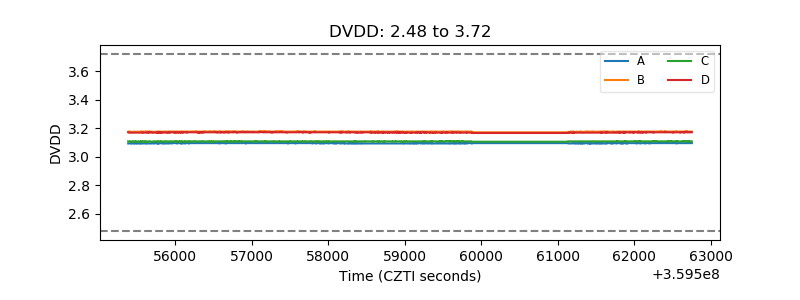 |
| Temperature 1 | 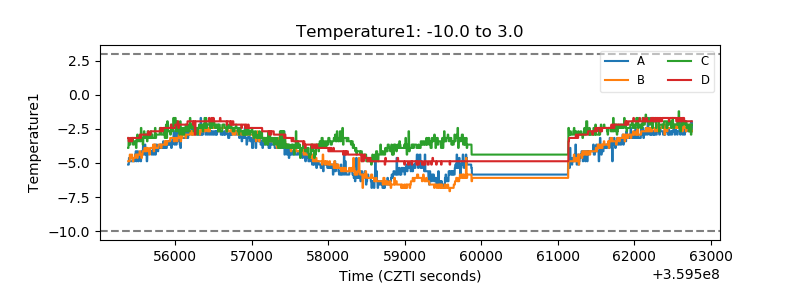 |
| Veto HV Monitor | 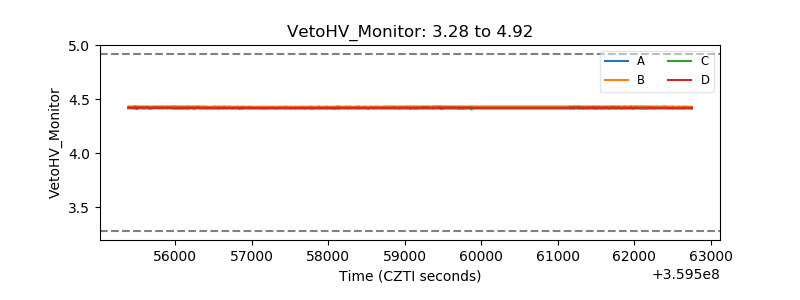 |
| Veto LLD | 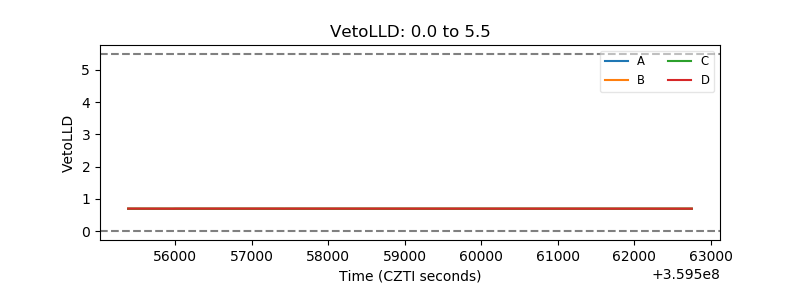 |
| Alpha Counter | 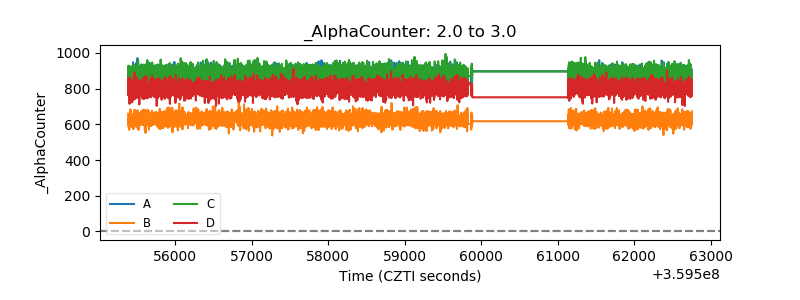 |
| _CPM_Rate |  |
| CZT Counter | 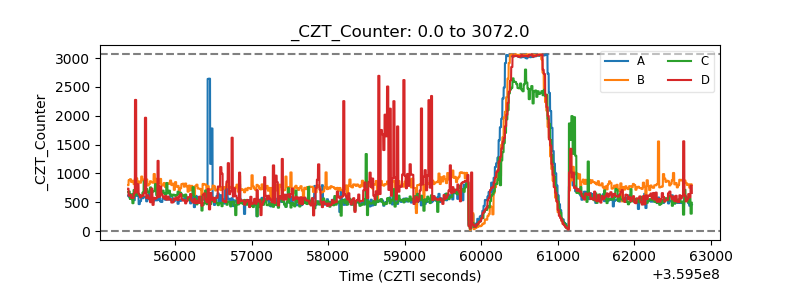 |
| +2.5 Volts monitor |  |
| +5 Volts monitor | 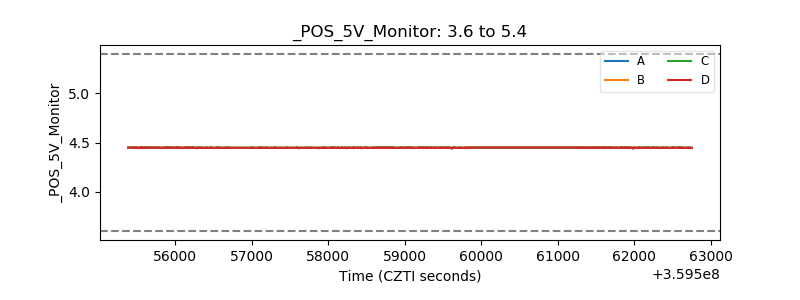 |
| _ROLL_ROT | 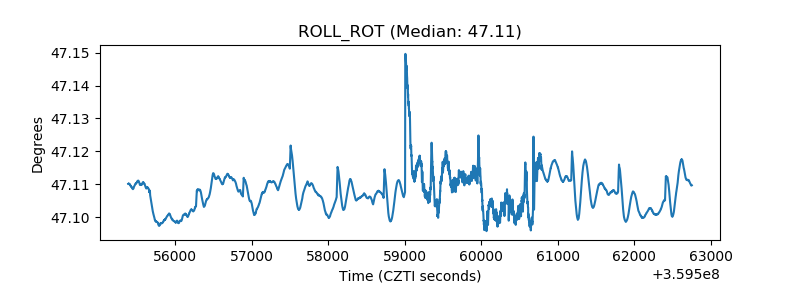 |
| _Roll_DEC | 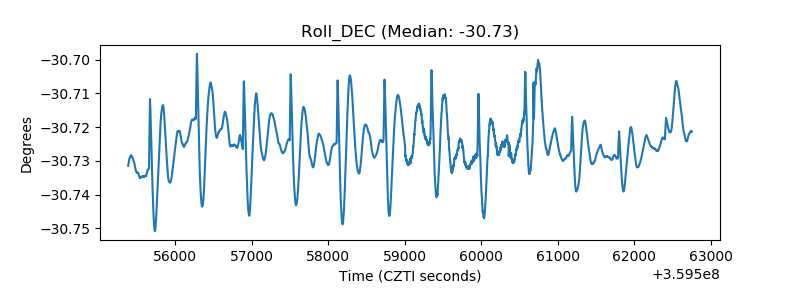 |
| _Roll_RA | 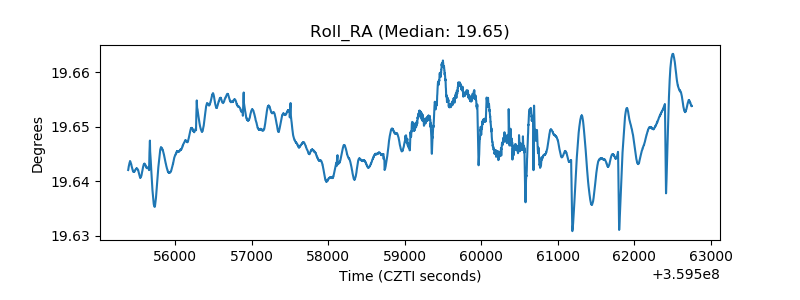 |
| Veto Counter | 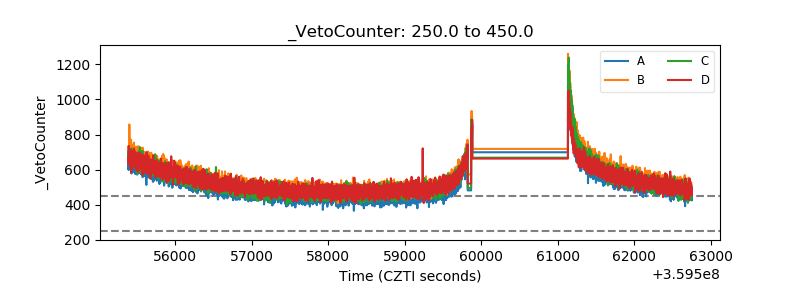 |