| Param | Original file | Final file |
|---|---|---|
| Filename | modeM0/AS1A10_053T23_9000004404_30576cztM0_level2.evt | modeM0/AS1A10_053T23_9000004404_30576cztM0_level2_quad_clean.evt |
| Size (bytes) | 672,307,200 | 78,819,840 |
| Size | 641.2 MB | 75.2 MB |
| Events in quadrant A | 3,759,437 | 474,544 |
| Events in quadrant B | 6,065,605 | 471,374 |
| Events in quadrant C | 3,881,241 | 455,988 |
| Events in quadrant D | 6,136,397 | 451,989 |
| Mode SS | |||
|---|---|---|---|
| Quadrant | BADHDUFLAG | Total packets | Discarded packets |
| A | 0 | 158 | 0 |
| B | 0 | 158 | 0 |
| C | 0 | 158 | 0 |
| D | 0 | 158 | 0 |
| Mode M0 | |||
|---|---|---|---|
| Quadrant | BADHDUFLAG | Total packets | Discarded packets |
| A | 0 | 15972 | 3 |
| B | 0 | 23803 | 3 |
| C | 0 | 16193 | 3 |
| D | 0 | 23358 | 3 |
| Mode M9 | |||
|---|---|---|---|
| Quadrant | BADHDUFLAG | Total packets | Discarded packets |
| A | 0 | 3 | 0 |
| B | 0 | 4 | 0 |
| C | 0 | 4 | 0 |
| D | 0 | 4 | 0 |
| Quadrant | Total seconds | Saturated seconds | Saturation percentage |
|---|---|---|---|
| A | 7655 | 180 | 2.351404% |
| B | 7655 | 349 | 4.559112% |
| C | 7655 | 250 | 3.265839% |
| D | 7655 | 781 | 10.202482% |
Noise dominated data is calculated using 1-second bins in cleaned event files. If a bin has >2000 counts, and if more than 50% of those come from <1% of pixels, then it is considered to be noise-dominated and hence unusable.
| Quadrant | # 1 sec bins | Bins with >0 counts | Bins with >2000 counts | High rate bins dominated by noise | Noise dominated (total time) | Noise dominated (detector-on time) | Marked lightcurve |
|---|---|---|---|---|---|---|---|
| A | 7760 | 7657 | 0 | 0 | 0.00% | 0.00% | 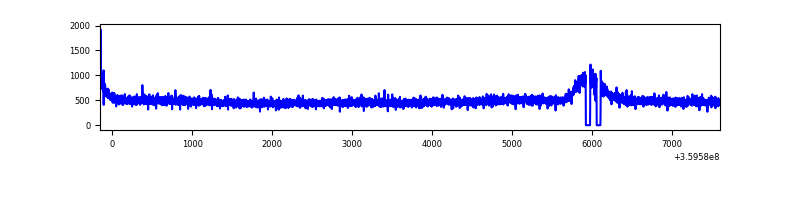 |
| B | 7760 | 7657 | 22 | 22 | 0.28% | 0.29% | 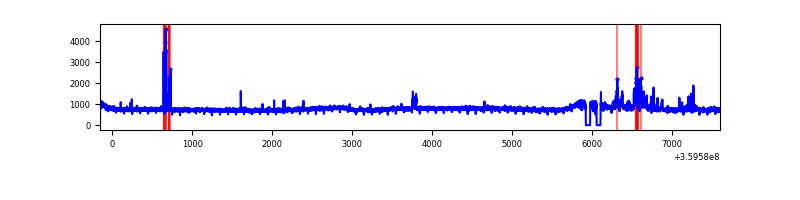 |
| C | 7760 | 7657 | 1 | 1 | 0.01% | 0.01% | 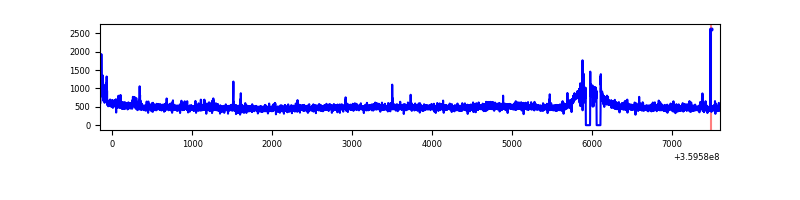 |
| D | 7760 | 7657 | 636 | 636 | 8.20% | 8.31% | 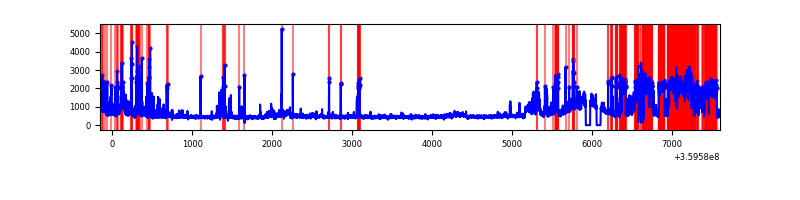 |
Top three noisy pixels from each quadrant. If the there are fewer than three noisy pixels in the level2.evt file, extra rows are filled as -1
| Pixel properties | Quadrant properties | ||||||
|---|---|---|---|---|---|---|---|
| Quadrant | DetID | PixID | Counts | Sigma | Mean | Median | Sigma |
| A | 8 | 192 | 15405 | 73.6 | 970 | 949 | 196.4 |
| A | 13 | 254 | 13806 | 65.46 | 970 | 949 | 196.4 |
| A | 3 | 137 | 10162 | 46.91 | 970 | 949 | 196.4 |
| B | 6 | 159 | 2084580 | 11199.73 | 948 | 921 | 186.0 |
| B | 6 | 36 | 231119 | 1237.32 | 948 | 921 | 186.0 |
| B | 12 | 111 | 23120 | 119.32 | 948 | 921 | 186.0 |
| C | 14 | 238 | 147458 | 677.94 | 917 | 920 | 216.2 |
| C | 3 | 233 | 72641 | 331.81 | 917 | 920 | 216.2 |
| C | 0 | 10 | 29263 | 131.13 | 917 | 920 | 216.2 |
| D | 1 | 52 | 1922986 | 8712.26 | 917 | 889 | 220.6 |
| D | 12 | 227 | 342024 | 1546.26 | 917 | 889 | 220.6 |
| D | 13 | 104 | 159204 | 717.59 | 917 | 889 | 220.6 |
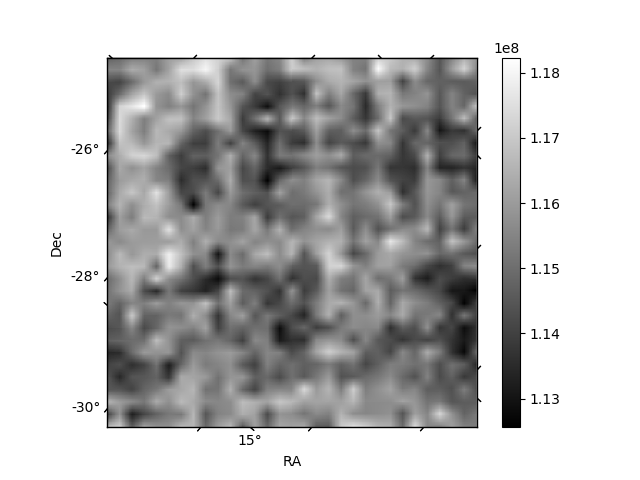
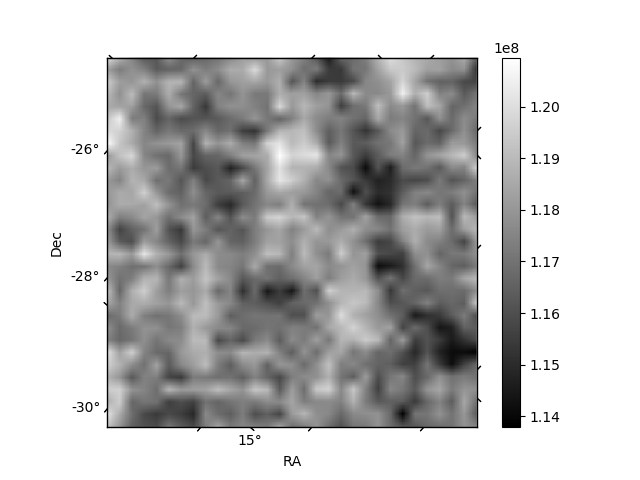
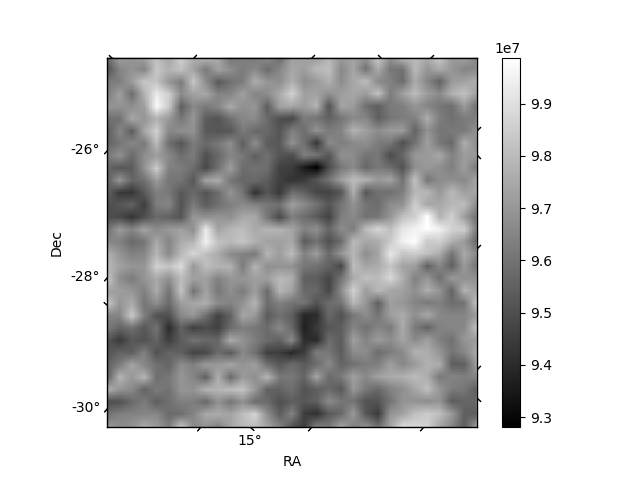
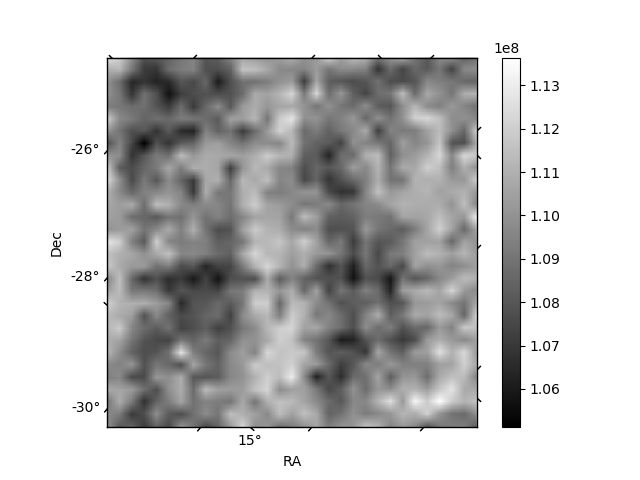
Histogram calculated using DETX and DETY for each event in the final _common_clean file
| Quadrant A | 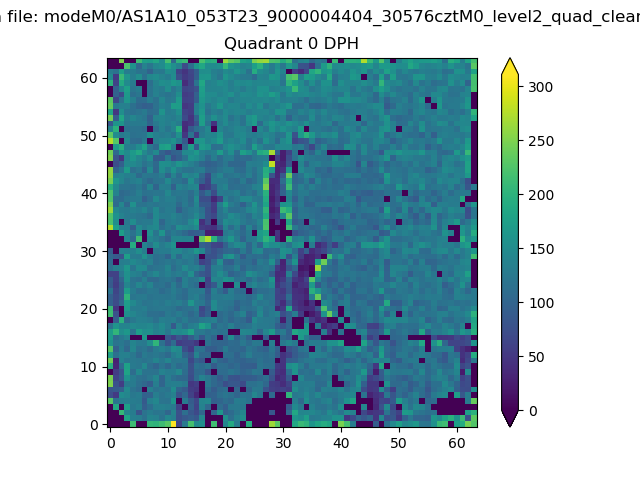 |
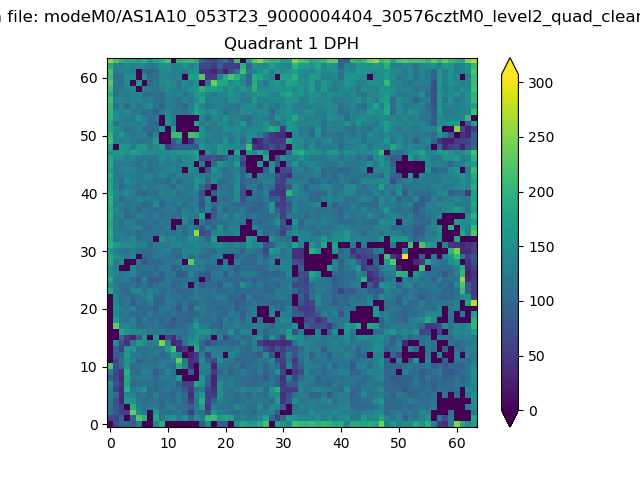 |
Quadrant B |
|---|---|---|---|
| Quadrant D | 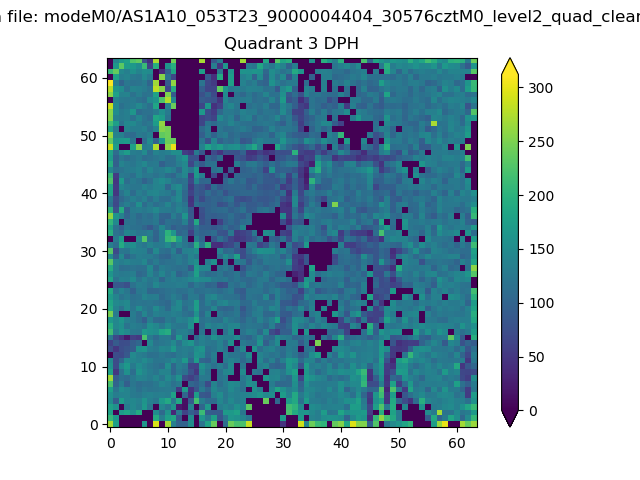 |
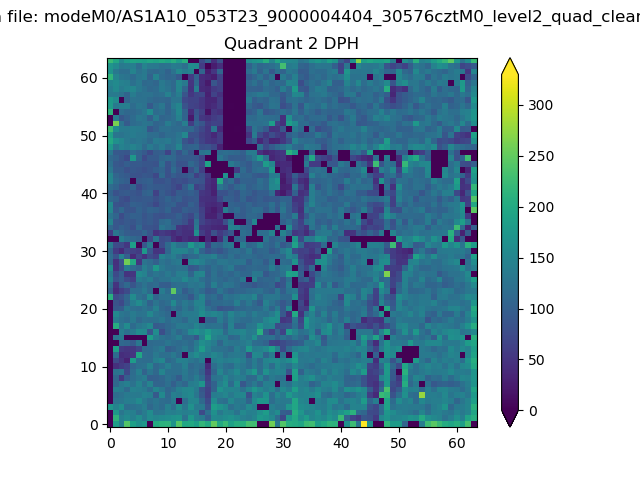 |
Quadrant C |
| Plot type | Count rate plots | Images |
|---|---|---|
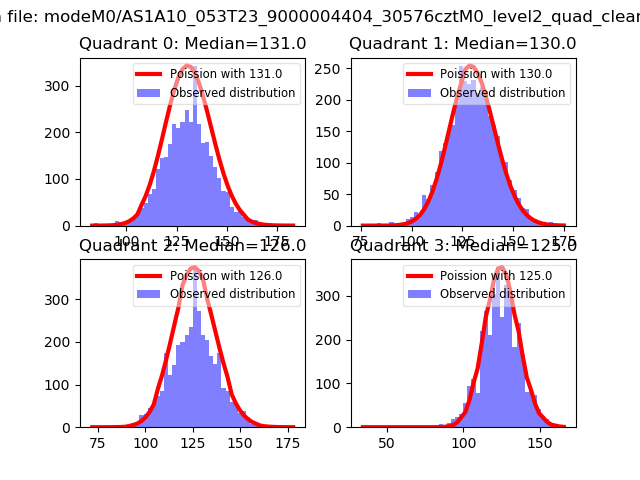
| Comparison with Poisson distribution Blue bars denote a histogram of data divided into 1 sec bins. Red curve is a Poisson curve with rate = median count rate of data. |
 |
 |
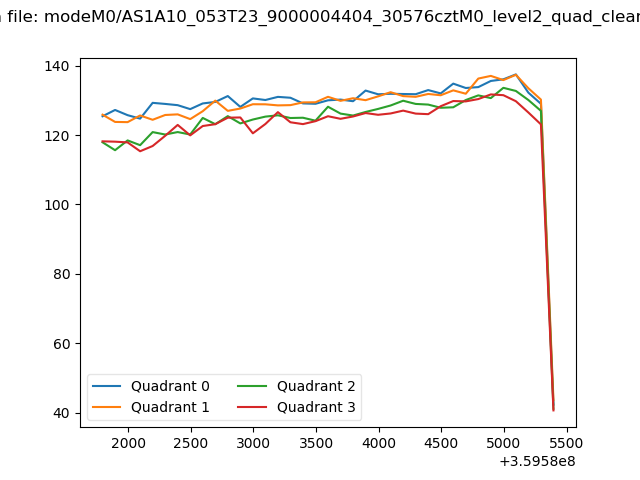
| Quadrant-wise count rates Data is divided into 100 sec bins |
 |
|
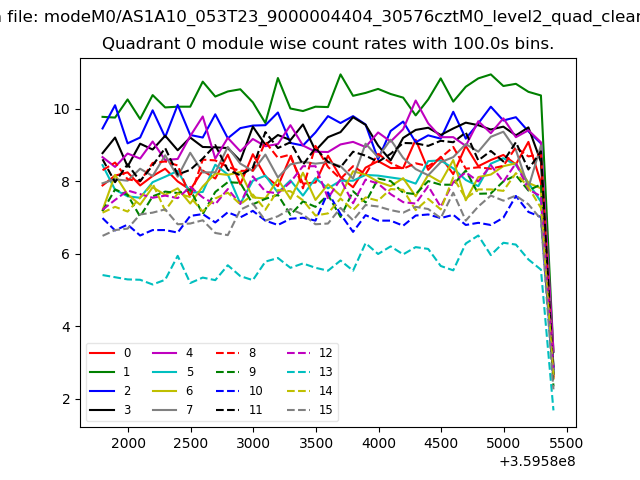
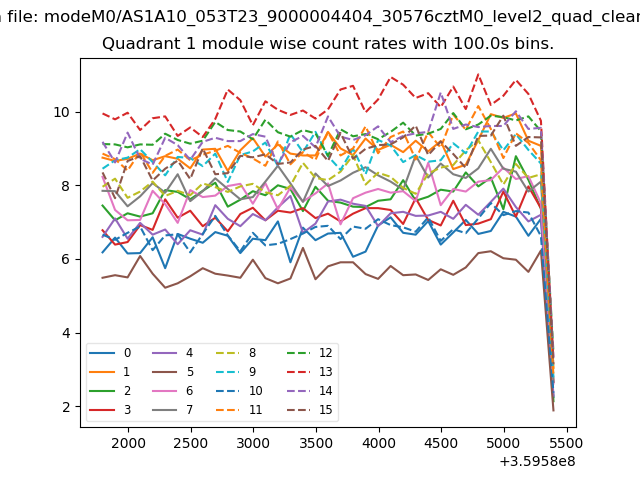
| Module-wise count rates for Quadrant A Data is divided into 100 sec bins |
 |
 |
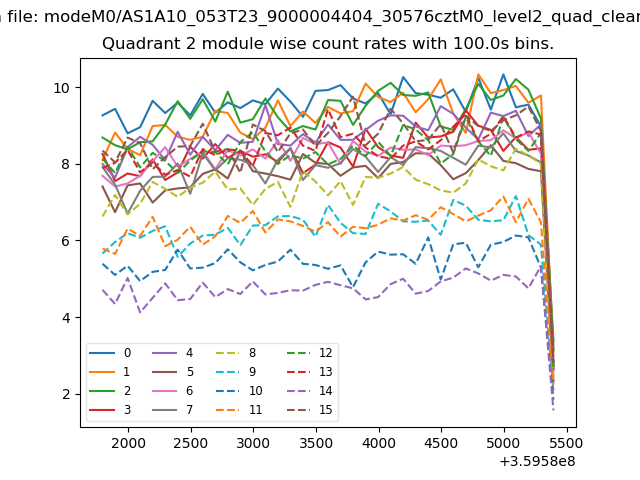
| Module-wise count rates for Quadrant B Data is divided into 100 sec bins |
 |
 |
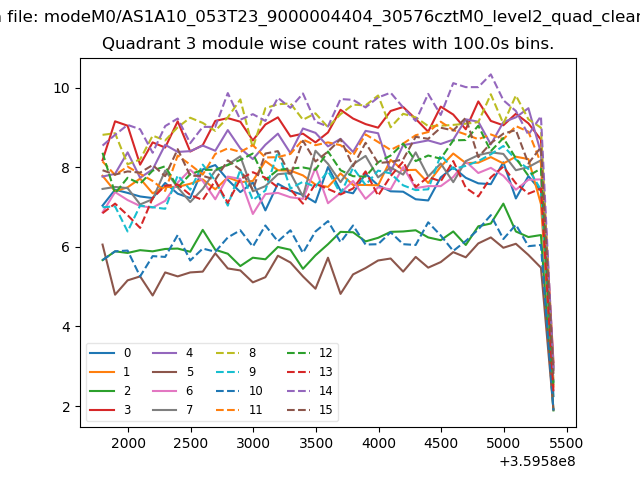
| Module-wise count rates for Quadrant C Data is divided into 100 sec bins |
 |
 |
| Module-wise count rates for Quadrant D Data is divided into 100 sec bins |
 |
 |
| Parameter | Plot |
|---|---|
| CZT HV Monitor | 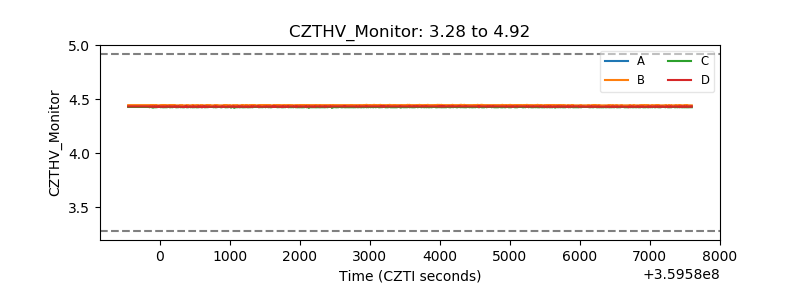 |
| D_VDD | 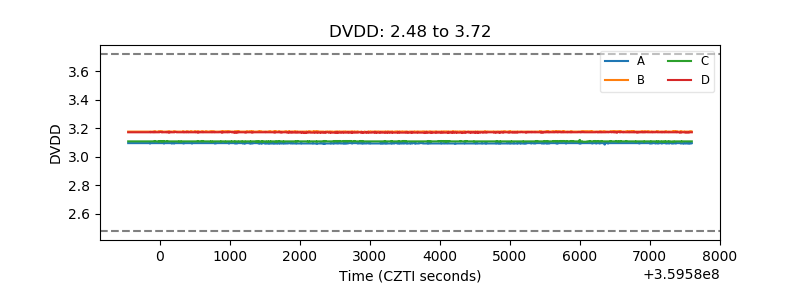 |
| Temperature 1 | 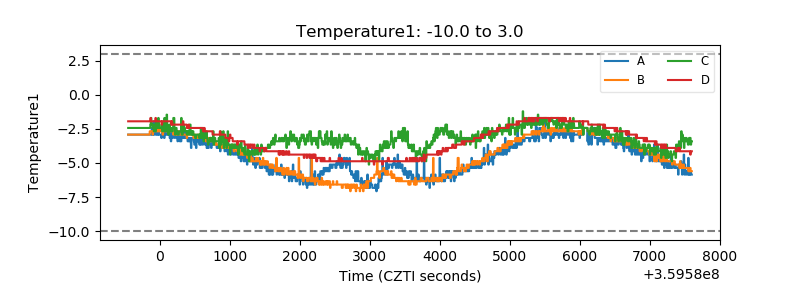 |
| Veto HV Monitor | 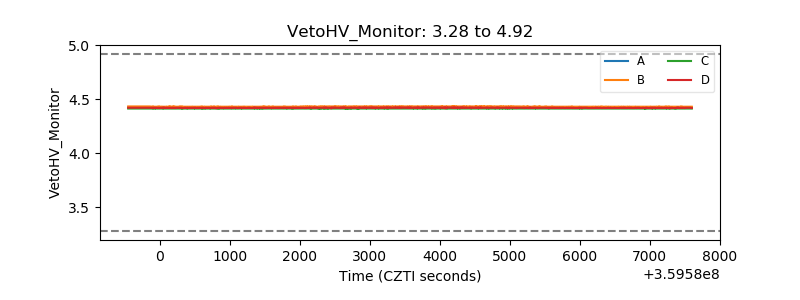 |
| Veto LLD | 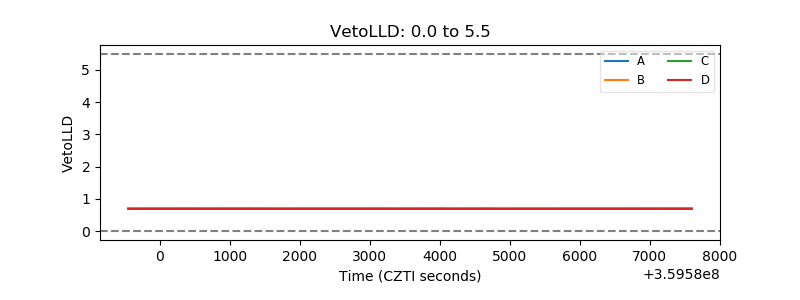 |
| Alpha Counter | 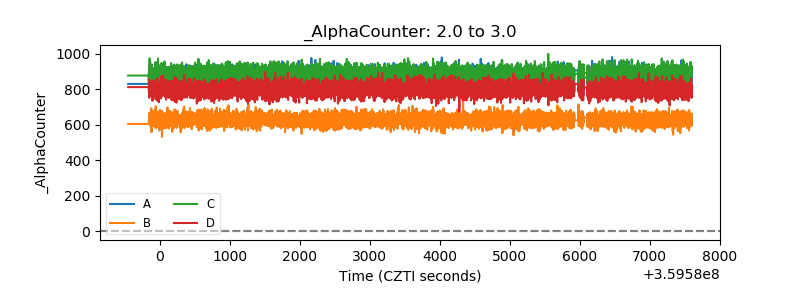 |
| _CPM_Rate | 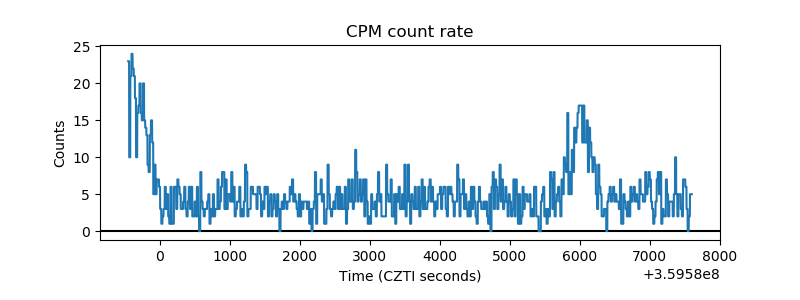 |
| CZT Counter | 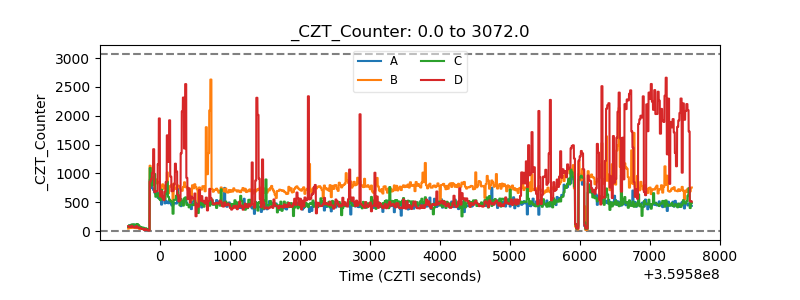 |
| +2.5 Volts monitor |  |
| +5 Volts monitor |  |
| _ROLL_ROT | 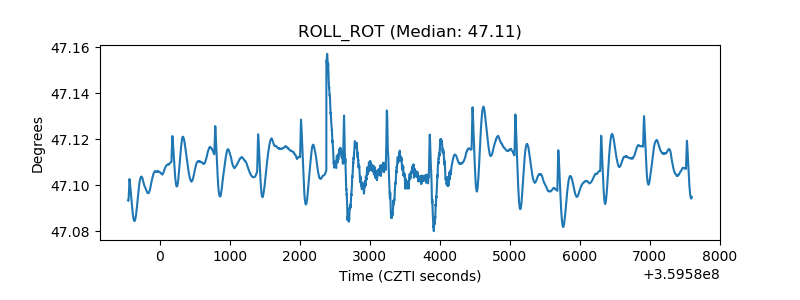 |
| _Roll_DEC | 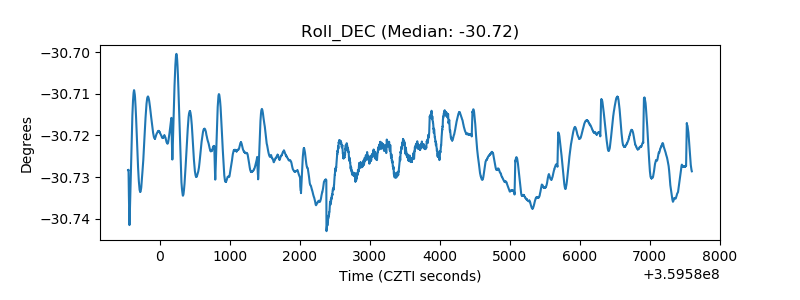 |
| _Roll_RA | 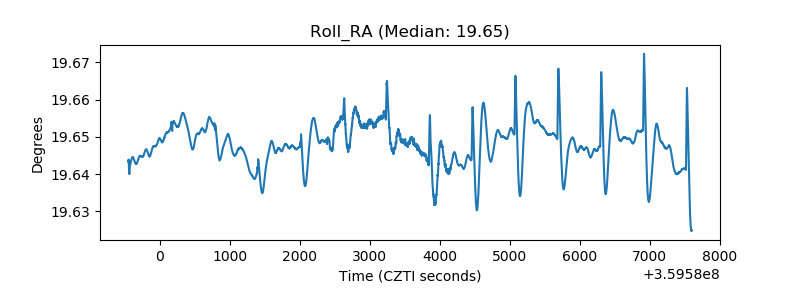 |
| Veto Counter | 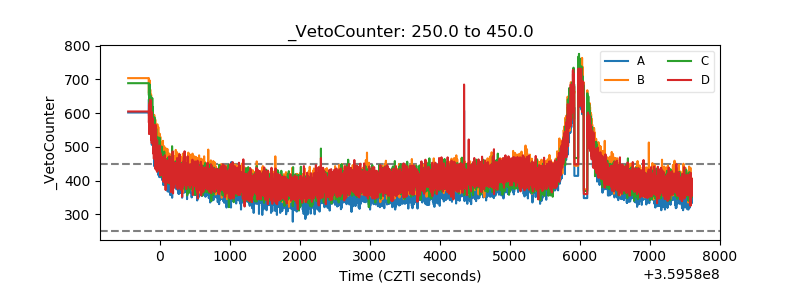 |